XAMAS indicator
- インディケータ
- EHSAN KHADEMOLAMA
- バージョン: 1.12
- アップデート済み: 6 6月 2020
- アクティベーション: 5
***Please Give Some Feedback and Reviews***
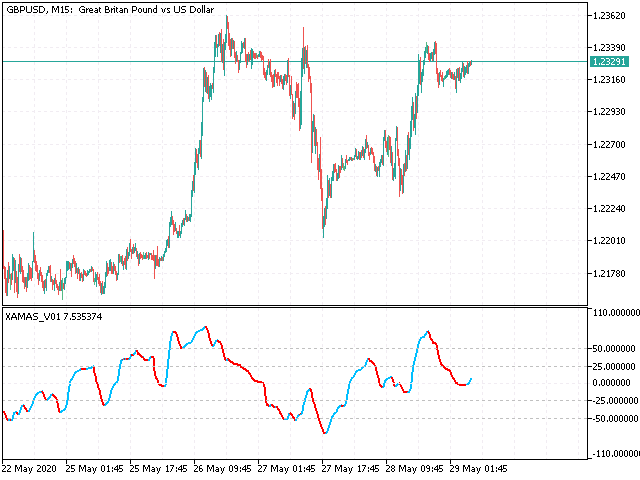
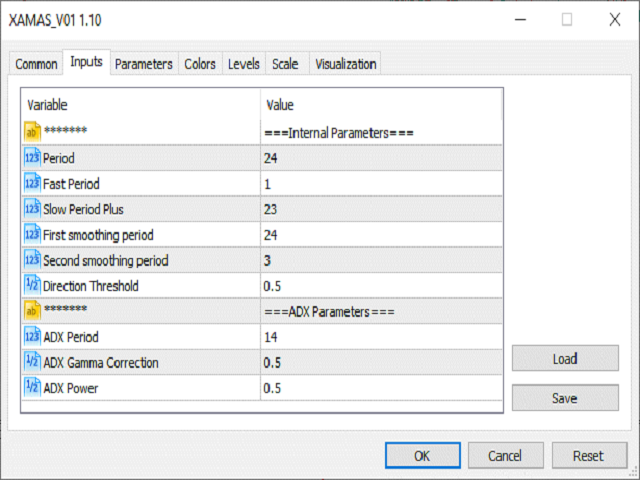
This is an indicator which shows the direction and the strength of the selected Symbol based on the two outputs, Signal and Value. The Signal indicates the directions as Buy equals 2(Blue) and Sell equals 1(Red). The Value output indicates the strength of the signal between -100 to 100. This indicator is both trend and fast preliminary indicator by choosing appropriate parameters. Indicator uses the Normalized ADX value as the hitting catalyst, which by choosing the value for the parameters from 0.0 to 1.0 could help us distinguish between the trends. The threshold parameter limits the micro-trends noises effects on the main trends. For using this indicator please use the "previous bar" based algorithms.

ユーザーは評価に対して何もコメントを残しませんでした