ForexSessionMT4
- インディケータ
- Jia Jia Chen
- バージョン: 1.0
- アクティベーション: 10
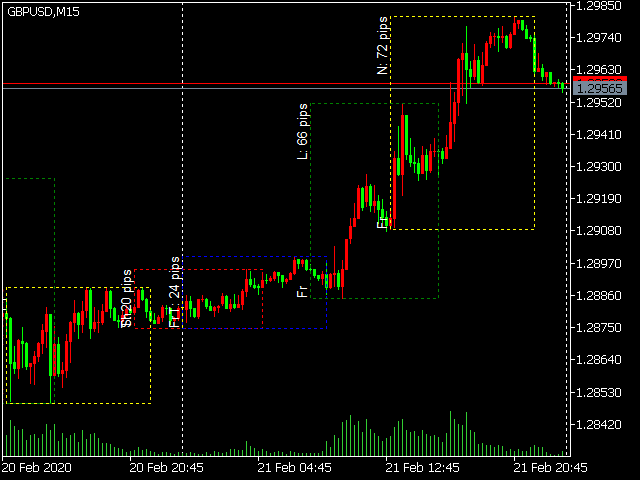
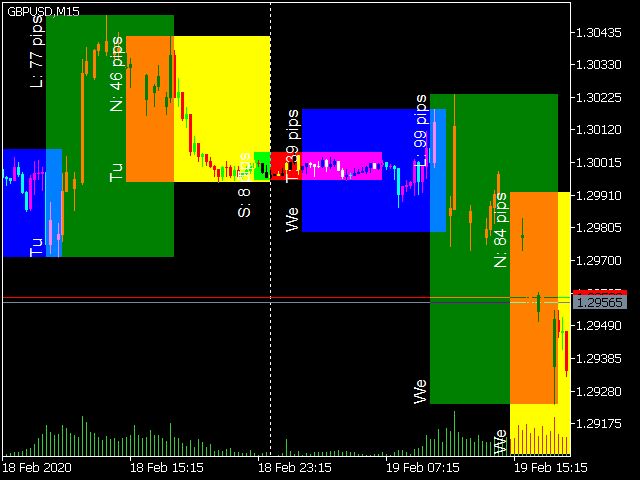
シドニー、東京、ロンドン、ニューヨークを含む外国為替市場時間インジケータ4市場時間各市場でのサーバーの夏時間の切り替えと夏時間の切り替えを考慮
- input int InpServerTimeZoneNoDSTOffset =2; 夏時間なしのGMTオフセットサーバー時間
- input ENUM_DST_ZONE InpServerDSTChangeRule = DST_ZONE_US; //サーバー側の夏時間切り替えルール
- input int InpBackDays = 100; //パフォーマンス上の理由から、最大描画日数
- input bool InpShowTextLabel = true; //市場、現在のボラティリティを表示するテキストラベルを表示
- input string InpTextColor = clrWhite; //ラベルテキストの色
- input int InpTextFontSize = 8; //ラベルのテキストサイズ
- input bool InpFillBack = false; //ボックスの背景色が塗りつぶされるかどうか
- input ENUM_LINE_STYLE InpLineStyle = STYLE_DOT; //ボックスの線のスタイル
- input bool InpShowWeekday = true; //市場の日は曜日
- input bool InpShowSydneySession = true; //シドニーの市場時間を表示
- input bool InpShowTokyoSession = true; //東京のマーケットタイムを表示
- input bool InpShowLondonSession = true; //ロンドンの市場時間を表示
- input bool InpShowNewyorkSesion = true; //ニューヨークの市場時間を表示
- input int InpSydneyOpen = 8; //シドニー市場の現地開始時刻
- input int InpSydneyClose = 16; //シドニー市場の現地終了時刻
- input int InpTokyoOpen = 9; //東京マーケットのローカル開始時間
- input int InpTokyoClose = 18; //東京市場の現地終了時刻
- input int InpLondonOpen = 8; //ロンドンマーケットのローカル開始時間
- input int InpLondonClose = 16; //ロンドンマーケットの現地終了時刻
- input int InpNewyorkOpen = 8; //ニューヨーク市場の現地開始時刻
- input int InpNewyorkClose = 17; //ニューヨーク市場の現地終了時刻
- input string InpMagicStr = "forex_session"; //オブジェクトプレフィックスを描画
I bought this indicator because i liked the graphical interface but other than that, it is half baked and really does not work that well. I am in the middle of the us session right now and it has not drawn the session on my screen. Don't buy this product until he gets his act together. I sent him a question and got no response. I was stupid to spend $30 bucks.