Last month High and Low
- インディケータ
- Jorge Delgado Segura
- バージョン: 2.0
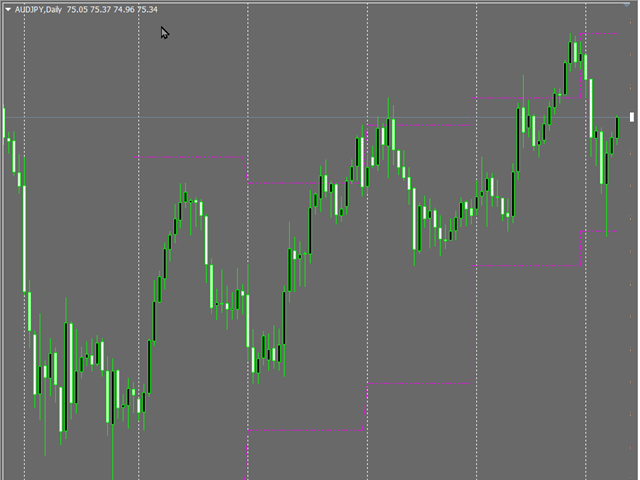
Displays previous months Highs & Lows. You can set the number of months to display levels for, also the line style, color and width.
This is very useful for traders using the BTMM® and other methods like ICT®.
I'll be creating similar indicators for MT5 for the BTMM®.
Send me your suggestions to my Telegram:
Take a look at my other products at:
https://www.mql5.com/en/users/jdelgadocr/seller