High and Low for MT5
- インディケータ
- Oleg Kolesov
- バージョン: 1.0
High and Low
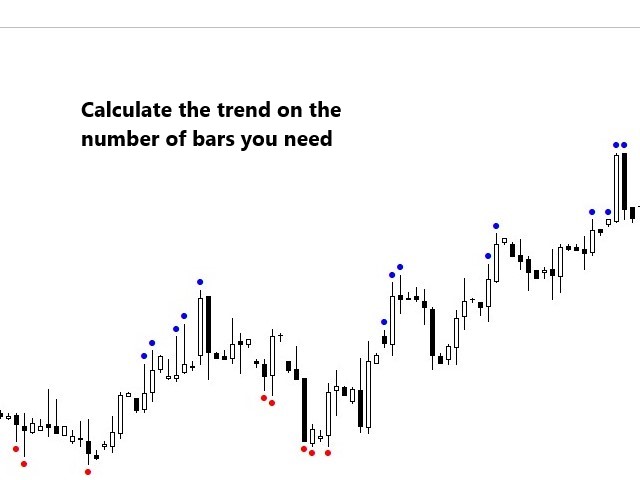
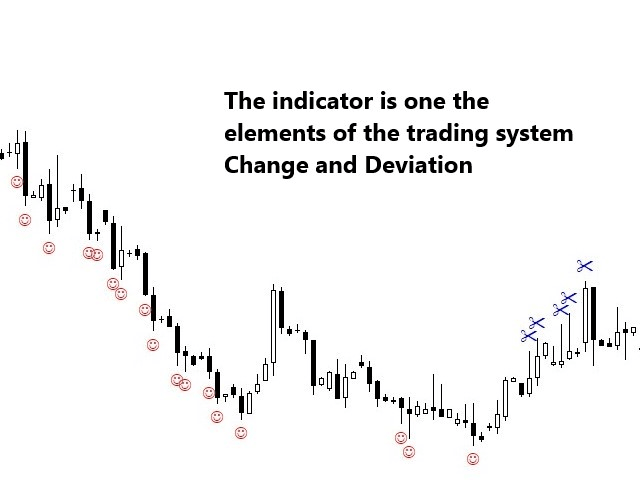
The indicator marks bars with a simple trend definition“ each subsequent high above/below the previous one and each subsequent low above/below the previous one ”.
Charles Dow
Formula:
Max – The current maximum
Min – The current minimum
MaxK – Maximum per period
MinK – Minimum per period
Min>MinK & Max>=MaxK – Symbol on top
Max<MaxK & Min<=MinK – The symbol on the bottom
Input parameter:
Number of bars in the calculated history
Period for current timeframe
The distance to the symbol
Select the symbol from the top 33-255
Select the symbol from the bottom 33-255
Comments and questions please send a personal message or mail koles170375@mail.ru