Candle Pattern Scanner
- インディケータ
- Bruno Goncalves Mascarenhas
- バージョン: 1.0
- アクティベーション: 5
Candlestick patterns
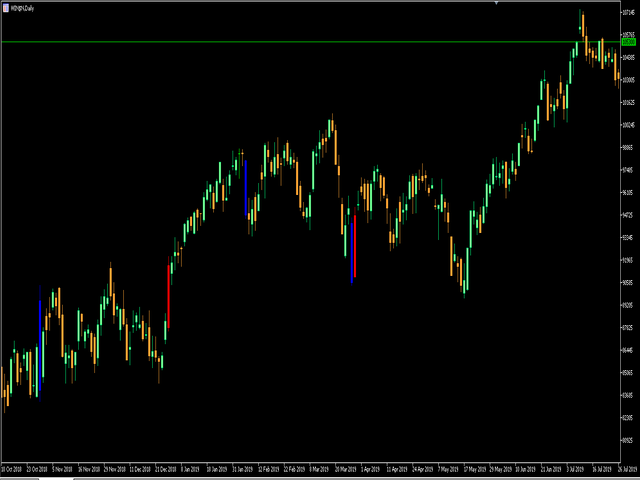
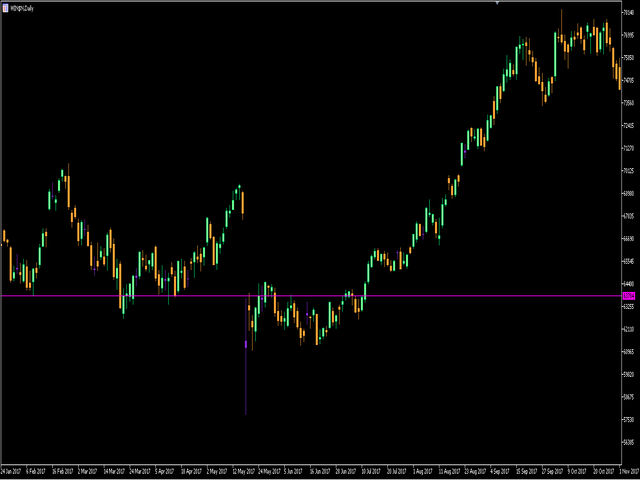
The candlestick Pattern Indicator and Scanner is designed to be a complete aid tool for discretionary traders to find and analyze charts from powerful candle patterns.
Recognized Patterns:
Hammer
Shooting star
Bearish Engulfing
Bullish Engulfing
Doji
Marubozu
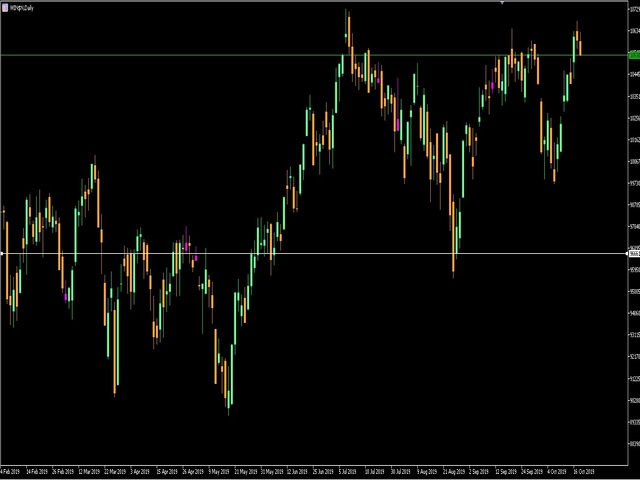
Scanner
Imagine if you could look at all the market assets in all timeframes looking for candlestick signals.


ユーザーは評価に対して何もコメントを残しませんでした