Price Touch Alert
- インディケータ
- CornavinBound
- バージョン: 2.0
- アップデート済み: 21 10月 2019
- アクティベーション: 10
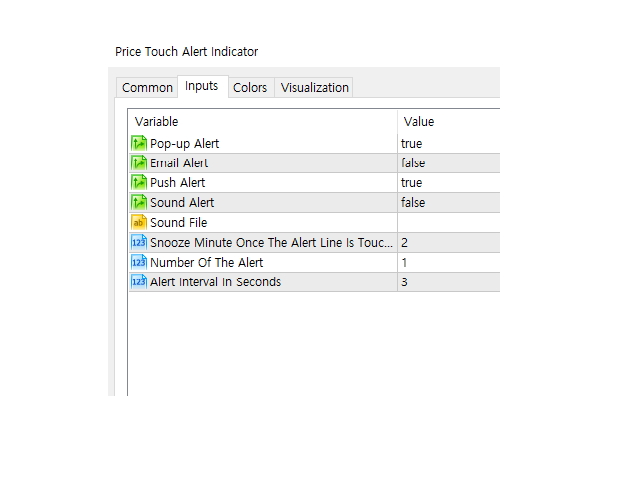
Attach the indicator on the chart and draw the red line from the button on MT5's built-in menu bar
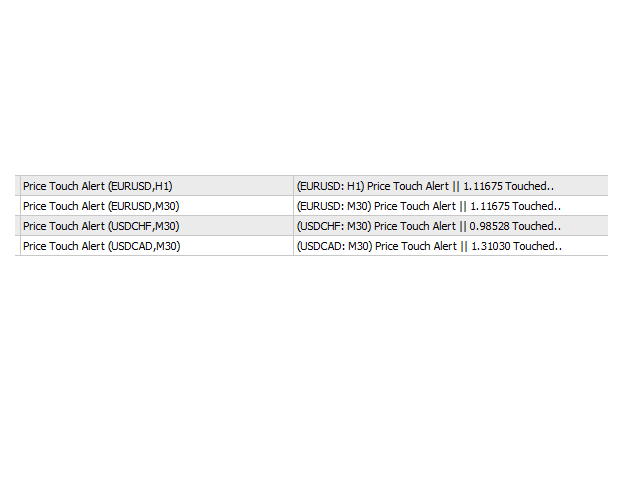
then the alert will be sent to you(push,email,popup and sound)
Hi
You all know the red line(the MT5 built-in red line) drawn from the menu bar on MT5. It is often used to check the resistance etc.....It is very useful but it is little troublesome to get an alert(sound, push, email and popup) when the red line is touched by the price.
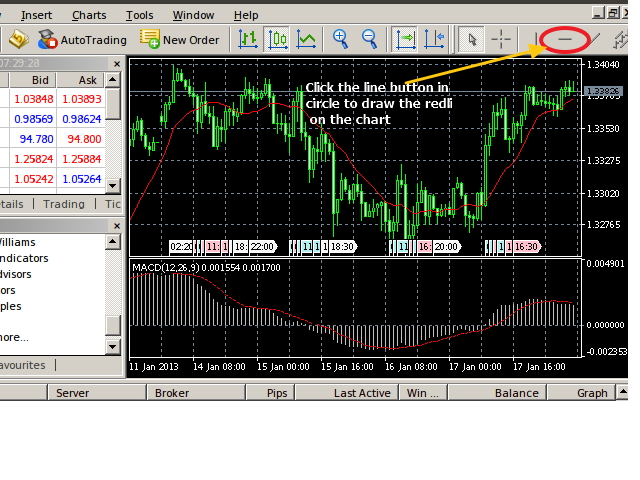
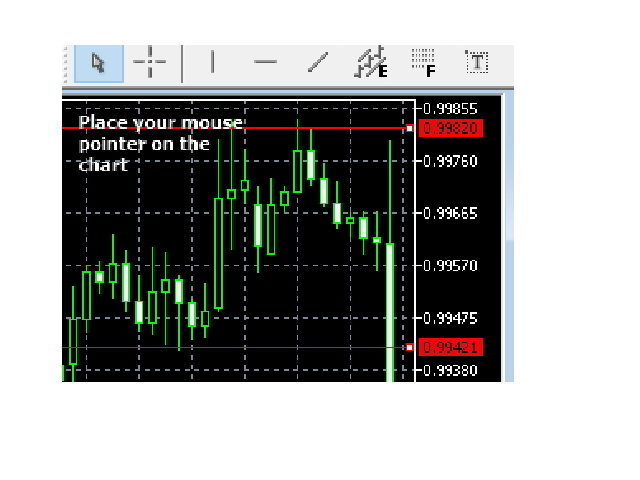
Here is Price Touch Alert indication, just use the button to draw the redline from the MT5 menu bar,(yellow circle on the screenshot below) just like you always do then an alert will be sent to you in any of the following forms; sound, push, email and popup.
You can either attach Price Touch Alert first on the chart and draw the red line or you can just attach Price Touch Alert on any existing chart which 'already' has all those red lines. Don't forget this Indicator works for each red line you draw.
Please be sure that if you have other indicator or object of which the colour is red then please change it, otherwise you get a wrong alert.