AO MACD colored
- インディケータ
- Alexander Zaitsev
- バージョン: 1.0
- アクティベーション: 5
Awesome Oscillator Moving Average Convergence/Divergence Indicator.
Not late as AO and not noisy as MACD. The basic version of the indicator is presented. The "PRO" version is under development with such
features as sending signals to e-mail and plotting divergence and convergence lines on the chart.
Input parameters:
- Fast: short EMA
- Slow: long EMA
- Signal: signal line
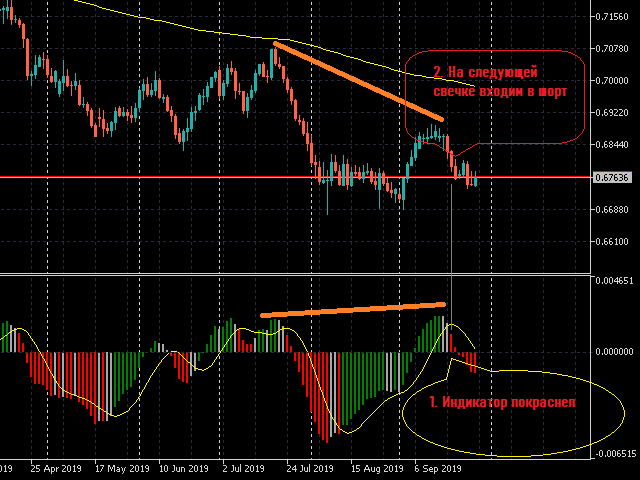
Colors:
Red: MACD < Signal
Green: MACD > Signal
Gray:
- MACD above Signal, but lower than the previous MACD
- MACD below Signal, but higher than the previous MACD