ADX Cross Trend Filter Alert
- インディケータ
- Eadvisors Software Inc.
- バージョン: 115.219
- アクティベーション: 5
ADX CROSS Trend Filter Alert
The average directional index (ADX) is used to determine when the price is trending strongly. In many cases, it is the ultimate trend indicator.
We added many types of alerts plus the TrendDI Filter Level to aid in your search for better opportunities in the market.
Product Features
- Sound alert
- Push Notification (Alerts can be sent to your mobile phone)
- Signs on chart
- Alert box
- Trend Filter
- Delay Cross Filter
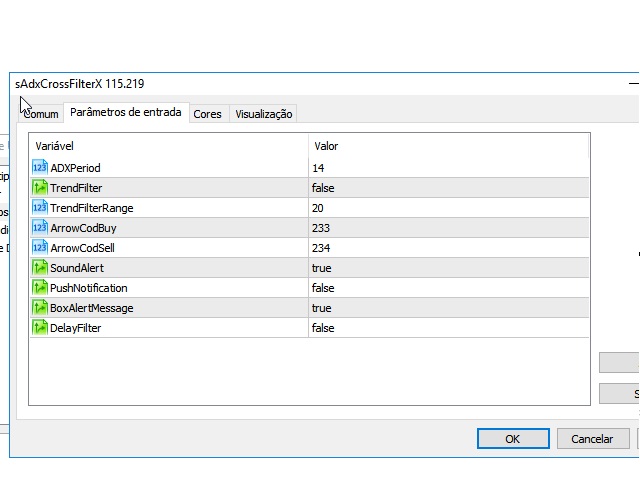
Indicator Parameters
- ADXPeriod - Set the ADX indicator period to work with.
- TrendFilter - Enable the AD trend filter level.
- TrendFilterRange - Set the AD Line level to filter the alerts. (Default value is set 20)
- ArrowCodBuy - Set the MQL Arrow code to buy sign.
- ArrowCodSell - Set the MQL Arrow code to sell sign.
- SoundAlert - Enable sound alert on the events.
- PushNotification - This option enables your MetaTrader 4 to send alerts to your smartphone (IOS or Android).
- BoxAlertMessage - Enable alert box on events.
- DelayFilter - Set the alerts on the next bar to avoid premature crosses. (False alerts filter)