IVolX horizontal volume
- インディケータ
- Denis Chebatarev
- バージョン: 1.8
- アクティベーション: 5
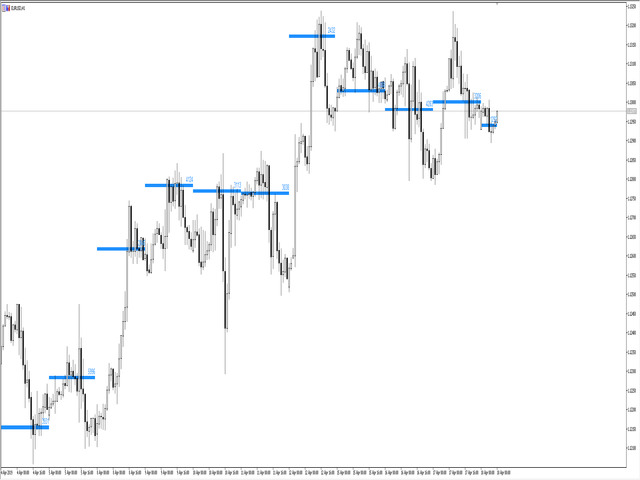
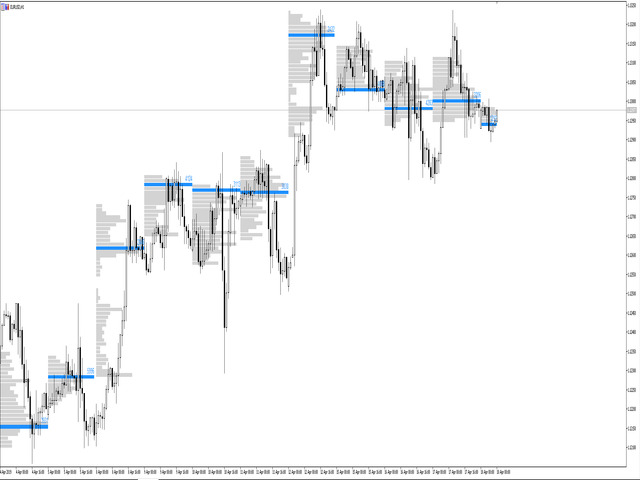
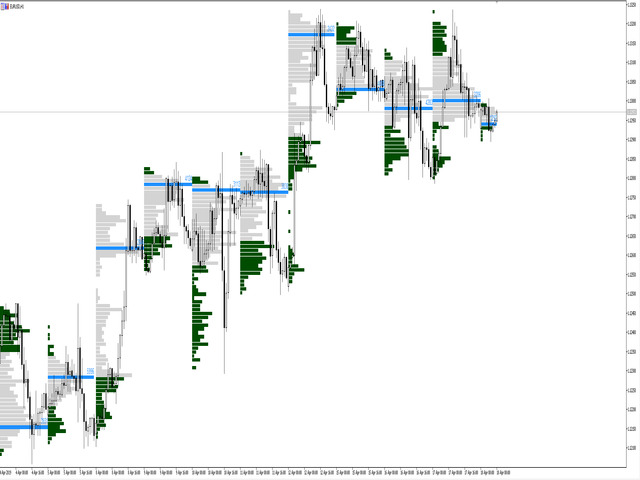
iVolX indicator horizontal volumes for all time periods
Main settings of the indicator:
- VolumeSource - select data for volumes (tick or real)
- PeriodMinutes - selection period for rendering of volumes
- PeriodsNumber - number of periods to show on the chart
- StartDate - the start date of the calculations
- ClusterPoints - cluster width
- Color - color
- MaxVolColor - maximum volume color
- ValueArea - the value of the zone of balance
- ValueAreaColor - color of the balance zone
- MaxVolFontSize - font size
- MavVolVAOnly - show only balance area
- Show - on/off indicator