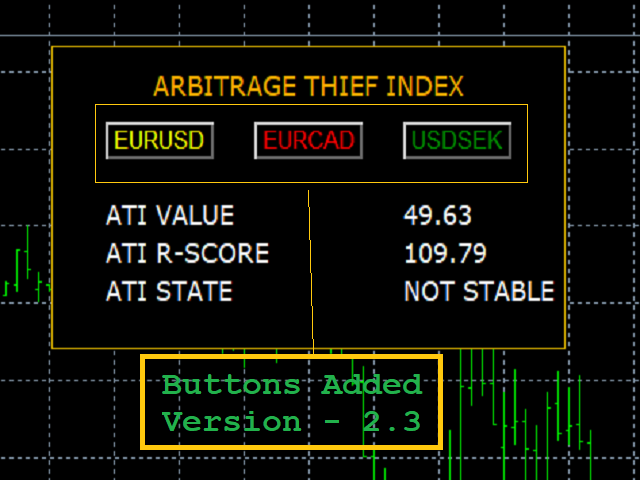
Arbitrage Thief Index
- インディケータ
- Philip Pankaj Suthagar
- バージョン: 2.90
- アップデート済み: 14 3月 2023
- アクティベーション: 10
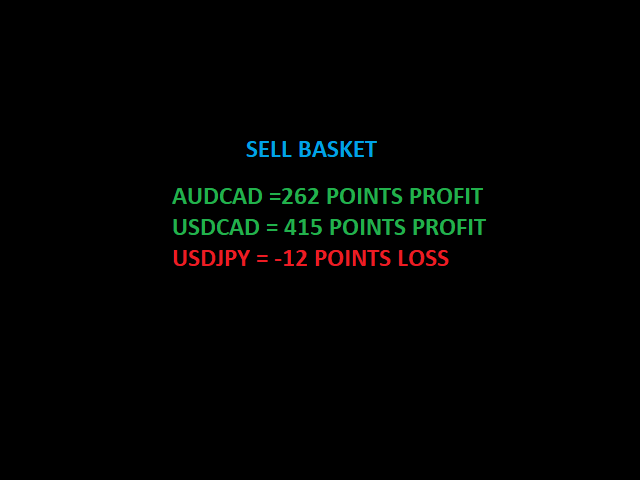
Today you have the ability to unlock the most powerful trading Indicator.In my trading Carrier,I have been using this indicator to take a perfect entry and exit with nice safe profit.And with full trust,Today I'm sharing this secret strategy with you.Great fund manager never risk their trade on one single order,instead they take more trade orders at different instrument to build an effective balanced portfolio.
Why use Arbitrage Thief Index?
- Great for novice traders as well as experienced traders.
- Low risk entries.
- Doesn't repaints.
- No additional Indicator is needed.
- Its a trading strategy itself.
- It is perfect for scalping Basket trades.
- Simple and easy to use.
- Works in both trending and non trending markets.
- Popup Alerts, Push Notification and Email alerts.
- Can be integrated in Expert Advisors.
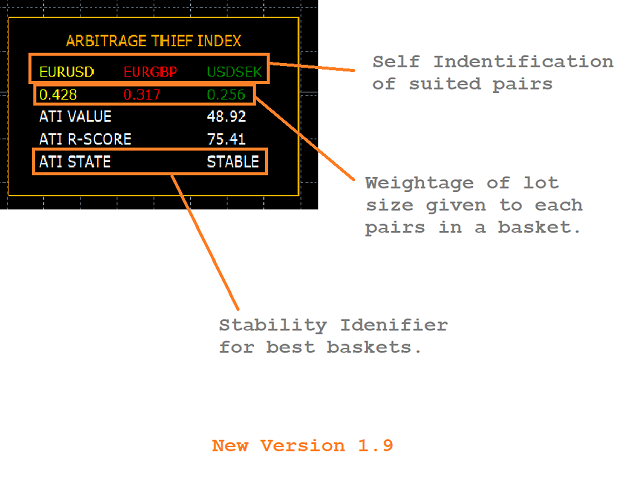
This indicator will help you to analyse best arbitrage options quickly with user friendly custom parameters.
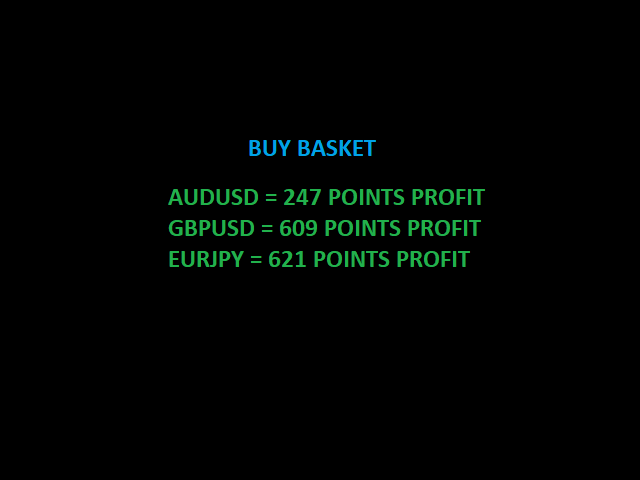
This indicator will monitor multiple currency correlated with our symbol basket to pull a perfect entry.
[CHECK OUT THE VIDEO DEMONSTRATION BELOW] - FOR SELECTING PERFECT BASKET OF CURRENCY SYMBOLS
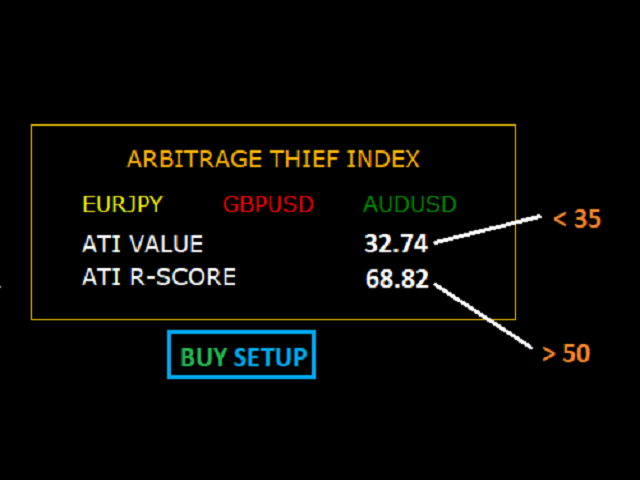
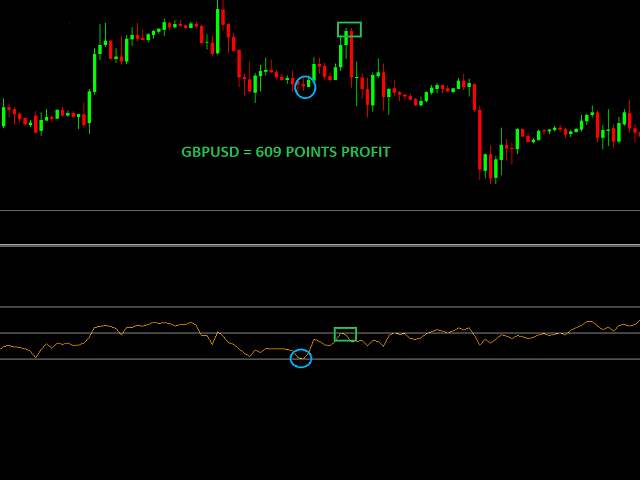
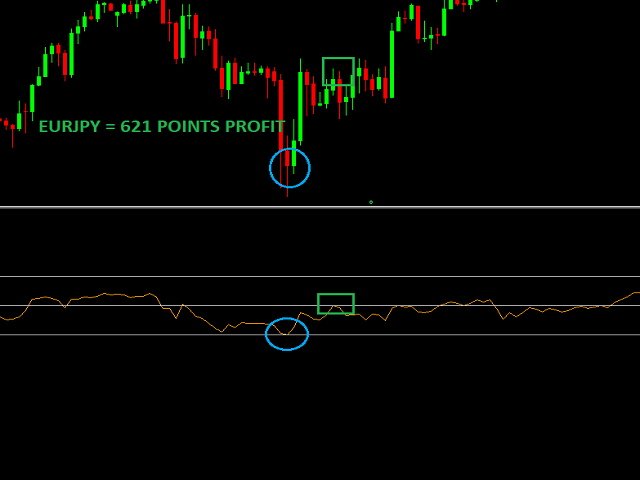
BUY Trade condition:
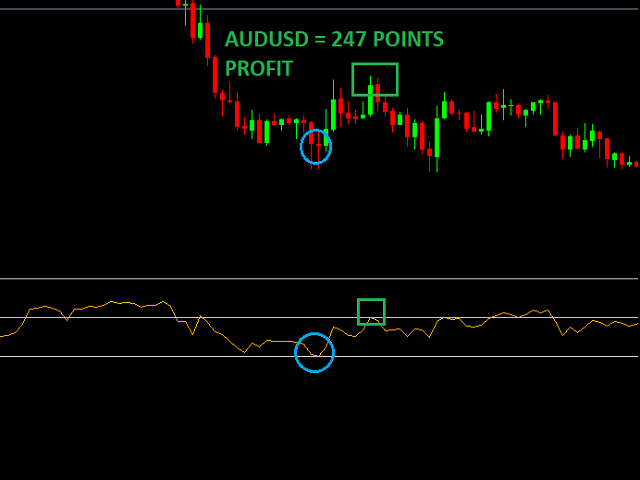
1.On default setting,You should buy all three currency pair when ATI moves below 35 Level & ATI R-SCORE greater than 50.
2.Close all trades when ATI touch 50 Level.
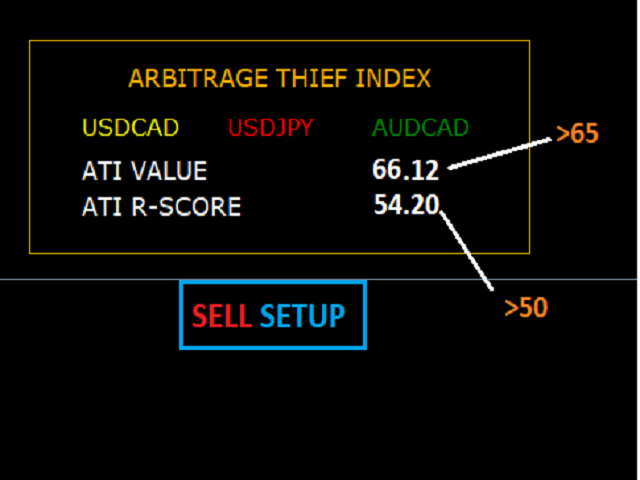
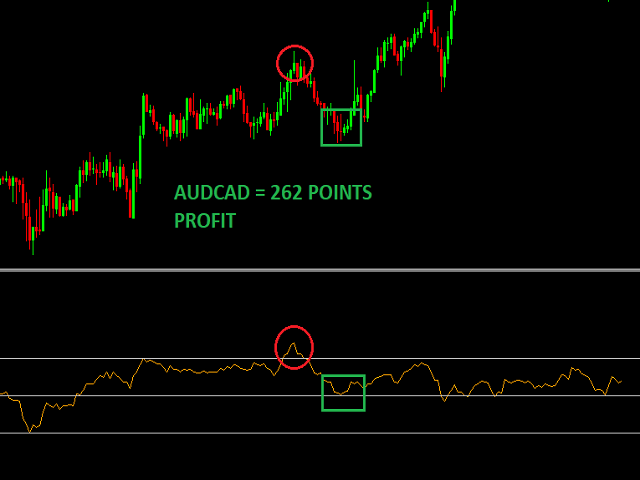
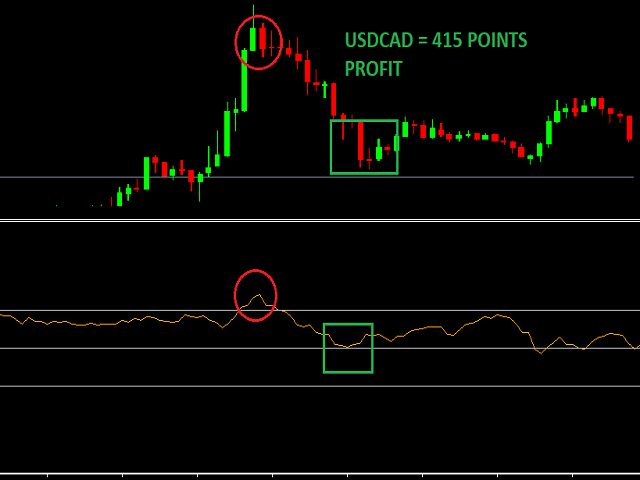
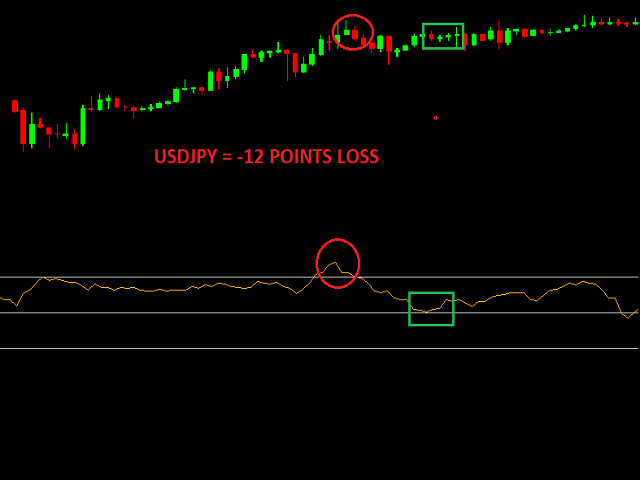
SELL Trade condition:
1.On default setting,You should sell all three currency pair when ATI moves above 65 Level & ATI R-SCORE greater than 50.
2.Close all trades when ATI touch 50 Level.
Features available:
Pop up Alert
Email Alert
Push notification
You can definitely combine other indicators with Arbitrage Thief Index to form your own trading strategy.
Avoid trading during high-volatility/news events.This Indicator is highly rewarding to master. Practice your strategy before going live.
Best wishes!


Excellent indicator, excellent support from author