• 概要
  • レビュー (14)
  • コメント (32)
  • 最新情報

Volume by Price MT4

5

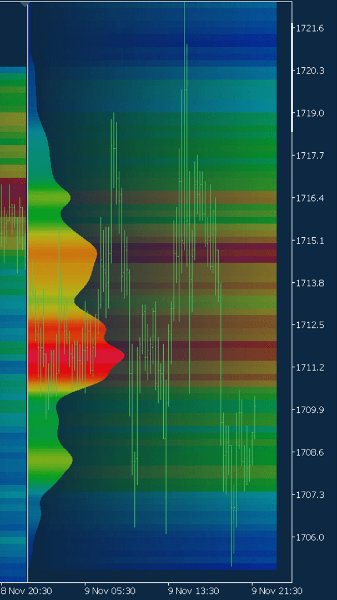
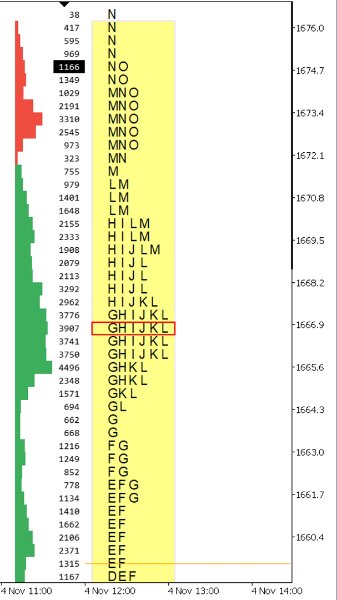
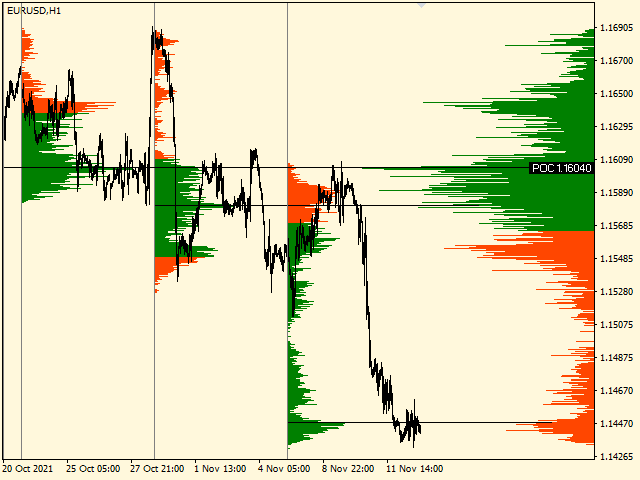
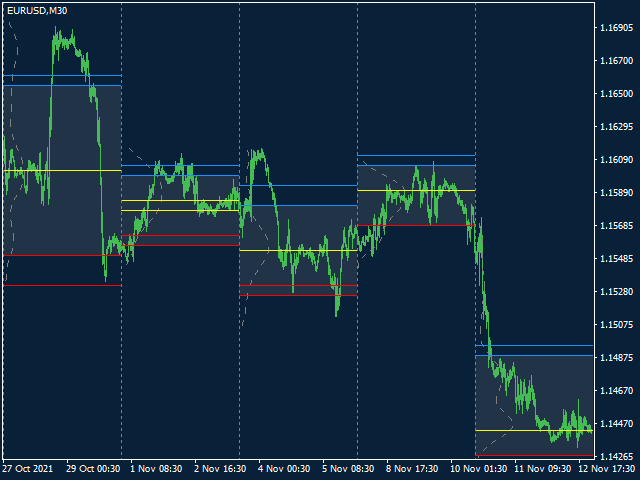
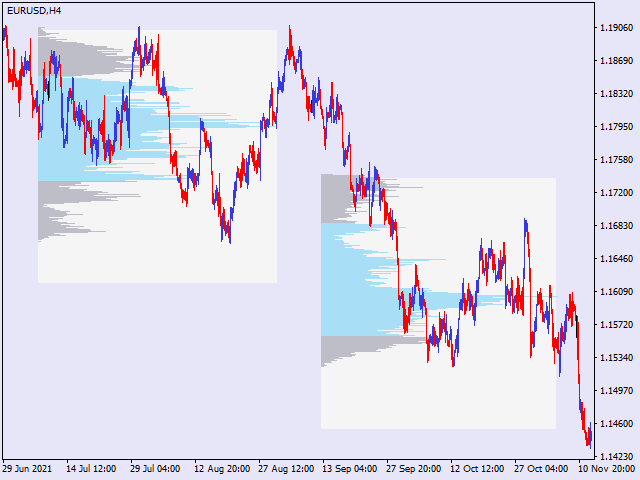
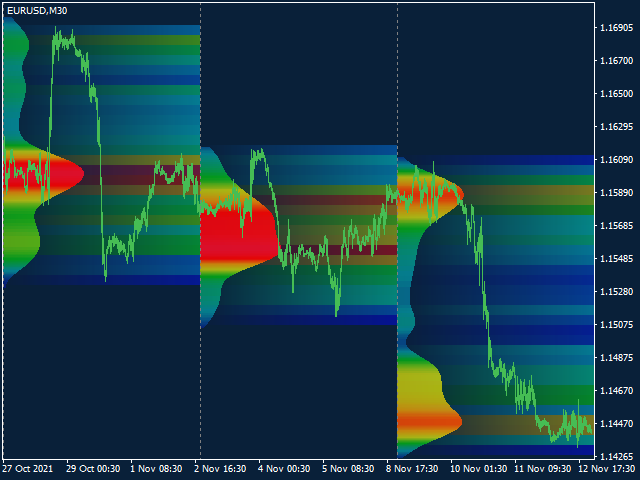
The Volume by Price Indicator for MetaTrader 4 features Volume Profile and Market Profile TPO (Time Price Opportunity). Get valuable insights out of currencies, equities and commodities data. Gain an edge trading financial markets.

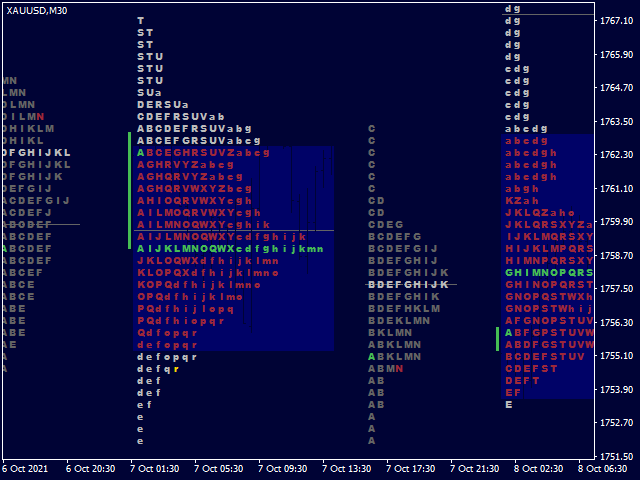
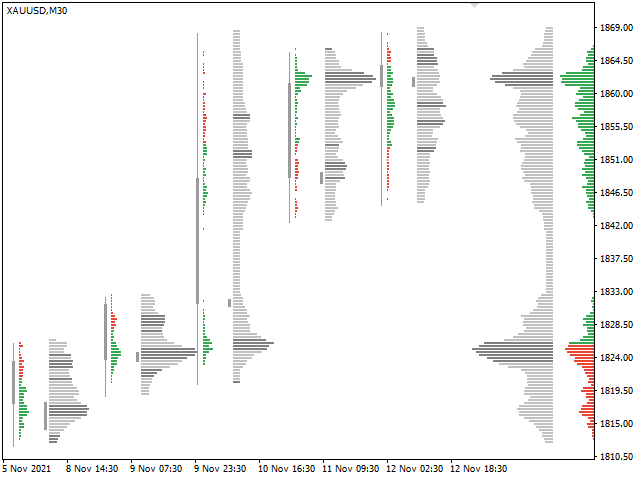
Volume and TPO histogram bar, line and metric charts. TPO letter and block marker charts including split structures. Positioning and styling options to suit the user's needs and context.

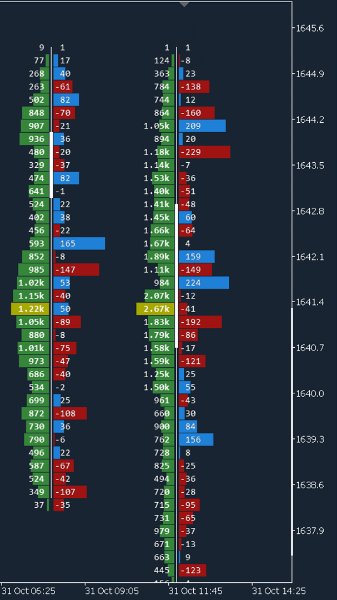
Volume Profile and Market Profile TPO Point of Control (VPOC and TPOC), Imbalance, Value Area (VA) and High and Low Volume Nodes (HVN and LVN). Visualization and evaluation by multiple methods and a wide range of user-definable variables. Includes Initial Balance (IB) and Volume Weighted Average Price (VWAP). Additional Volume Time Statistics to perform Volume Spread Analysis (VSA) and Volume Price Analysis (VPA). Order book Time and Sales (T&S) and Depth Of Market (DOM) MetaTrader 4 cross-platform terminal compatible MetaTrader 5 data connector extension for Order Flow and Footprint Analysis. Volume Profile Delta with classification by price action or order type.

A suite of technical analysis data visualization tools to display the complex relations between volume, price and time in various easy to interpret forms. Types of charts include change over time, part-to-whole, correlation and distribution. Data Source API by which users can have full control over the quality and type of data. Tick volume, trade volume or open interest. Data Environment API for programmatic access to dimensions and metrics for automated algorithmic trading strategies.

High-level chart setups with drag and drop support for the casual user, and further in-depth and segmented by using advanced user features.

For a quick start browse example compositions and download chart templates or set files. For details see documentation.


Also available Volume by Price MT5.

Free Demo: Distribution with chart timeframe period price data. Range of 200 bars. Up to 2 segments.

レビュー 14
Sara Sabaghi
21050
Sara Sabaghi 2023.02.11 11:09 
 

Great job. you did it well. to support and respect for nice and inspiring tools in this market

Felmer Magbanua Blanca
292
Felmer Magbanua Blanca 2022.09.12 20:58 
 

Indeed Institutional trades

barko9
155
barko9 2022.04.11 13:14 
 

perfect indicator for day trading and scalping first i rented it i liked it and now i bought it thanks brian

おすすめのプロダクト
A technical indicator that calculates its readings on trading volumes. In the form of a histogram, it shows the accumulation of the strength of the movement of the trading instrument. It has independent calculation systems for bullish and bearish directions. Works on any trading instruments and time frames. Can complement any trading system. The indicator does not redraw its values, the signals appear on the current candle. It is easy to use and does not load the chart, does not require additi
129 USD
Was: $249    Now: $149   Market Profile defines a number of day types that can help the trader to determine market behaviour. A key feature is the Value Area, representing the range of price action where 70% of trading took place. Understanding the Value Area can give traders valuable insight into market direction and establish the higher odds trade. It is an excellent addition to any system you may be using. Blahtech Limited presents their Market Profile indicator for the MetaTrader community.
149 USD
Was: $299    Now: $149   Supply Demand uses previous price action to identify potential imbalances between buyers and sellers. The key is to identify the better odds zones, not just the untouched ones. Blahtech Supply Demand indicator delivers functionality previously unavailable on any trading platform. This 4-in-1 indicator not only highlights the higher probability zones using a multi-criteria strength engine, but also combines it with multi-timeframe trend analysis, previously confirmed swin
149 USD
これは、キャンドルの終値を予測する指標です。 このインジケータは、主にD1チャートでの使用を目的としていますが. この指標は、従来の外国為替取引とバイナリオプション取引の両方に適しています。 インジケーターは、スタンドアロンのトレーディングシステムとして使用することも、既存のトレーディングシステムへの追加として機能させることもできます。 このインジケーターは、現在のキャンドルを分析し、キャンドル自体の内部の特定の強度係数と、前のキャンドルのパラメーターを計算します。 したがって、この指標は、市場の動きのさらなる方向性と現在のキャンドルの終値を予測します。 この方法のおかげで、この指標は、短期の日中取引だけでなく、中期および長期の取引にも適しています。 インジケーターを使用すると、市場の状況の分析中にインジケーターが生成する潜在的な信号の数を設定できます。 インジケーターの設定には、このための特別なパラメーターがあります。 また、インジケーターは、チャート上のメッセージの形式で、電子メールで、およびPUSH通知の形式で、新しい信号について通知することができます。 購入後は必ず私に書いて
65 USD
Descption: The Volume Profile displays detailed informations of historical trading activities at certain price levels (Market Profile). So you can locate the areas with the best prices in the market and get an advantage about other market participants. Support: Please do not hesitate to contact me via the MQL5 Platform. I am very grateful about any Bug report, so that i can constantly improve the indicator. I also appreciate any public review for this product.  Features: Customizable Volume
99 USD
BoxChart MT4
Evgeny Shevtsov
4.57 (7)
The market is unfair if only because 10% of participants manage 90% of funds. An ordinary trader has slim changes to stand against these "vultures". This problem can be solved. You just need to be among these 10%, learn to predict their intentions and move with them. Volume is the only preemptive factor that faultlessly works on any timeframe and symbol. First, the volume appears and is accumulated, and only then the price moves. The price moves from one volume to another. Areas of volume accumu
33 USD
インディケータは現在のクオートを作成し、これを過去のものと比較して、これに基づいて価格変動予測を行います。インジケータには、目的の日付にすばやく移動するためのテキスト フィールドがあります。 オプション: シンボル - インジケーターが表示するシンボルの選択; SymbolPeriod - 指標がデータを取る期間の選択; IndicatorColor - インジケータの色; HorisontalShift - 指定されたバー数だけインディケータによって描画されたクオートのシフト; Inverse - true は引用符を逆にします。false - 元のビュー。 ChartVerticalShiftStep - チャートを垂直方向にシフトします (キーボードの上下矢印)。 次は日付を入力できるテキストフィールドの設定で、「Enter」を押すとすぐにジャンプできます。
55 USD
The Chaikin Oscillator is a technical indicator developed by Marc Chaikin that combines price and volume data to measure the accumulation and distribution of a financial instrument. It aims to identify potential buying and selling opportunities in the market. The Chaikin Oscillator is calculated by subtracting a 10-day exponential moving average of the Accumulation Distribution Line (ADL) from a 3-day exponential moving average of the ADL. Here's how to use the Chaikin Oscillator indicator in tr
250 USD
この指標は、指定されたバー数の作業ヒストグラム上の最大および最小価格ボリューム(市場プロファイル)のレベルを検索します。 合成のプロフィール。 ヒストグラムの高さは完全に自動化されており、あらゆる計測器と時間枠に適応します。 著者のアルゴリズムが使用され、よく知られている類似体を繰り返さない。 二つのヒストグラムの高さは、ろうそくの平均高さにほぼ等しい。 スマートアラートは、ボリュームレベルに関する価格を通知するのに役立ちます。 コンセプトSmart Money Low Volume - Imbalance. は、良い市場の文脈を見つけ、市場の構造を決定し、バイナリオプションのフィルタとして使用されます。 それは価格のための磁石です。 High Volume - Liquidity. は、累積を終了するときのテストに使用されます。 入力パラメータ 基本 Bars Count - カウントして表示するバーの数 Signal Fractal = 5 (色信号のレベルのために)。 レベルは、次の条件の下で信号になります:それを超えない上部と下部に五つのヒストグラムがあります M
45 USD
This indicator uses past market cycles to predict future price movements. The predictions are drawn as vertical lines on the right side of the chart where the market has not advanced to yet. A prediction will many times result in the type of candle (ex. bull or bear) and/or a reversal point (ex. bottom or top) forming at this exact time. The lines are drawn well in advance which makes this a unique indicator. Benefits The indicator does not repaint, move, or delete lines! It also does not la
150 USD
この指標の独自性は、ボリュームアカウンティングアルゴリズムにあります。累積は、1日の始まりを参照せずに、選択した期間に直接発生します。最後のバーは計算から除外できます。そうすると、現在のデータが以前に形成された重要なレベル(ボリューム)に与える影響が少なくなります。 より正確な計算のために、M1グラフのデータがデフォルトで使用されます。価格ボリュームの分配のステップは規制されています。デフォルトでは、ディスプレイの右の境界線は、分析に使用されるデータの先頭に対応するバーに設定されていますが、必要に応じて、必要なバーに設定できます。表示されているボリュームバンドの長さ(右の境界線)は係数によって調整され、0(現在の)バーに左または右にシフトしたり、現在のバーを参照してミラーリングしたりすることもできます。 パラメーター: Accumulation period - ボリューム累積の計算期間 Number of excluded last bars - 計算から除外された最後のバーの数 Accumulation price step - 価格パラメータによるボリューム合計のステップ Gra
35 USD
VN Trade Panel II
Vyacheslav Nekipelov
4 (1)
The new version of the trading panel, which now has the ability to separately close Buy and Sell orders, display targets for all orders on the chart, as well as the ability to use the panel to trade with brokers working on the FIFO rule. Also, the new version adds option buttons for separate management of open orders. It has a convenient visualized interface and intuitive control without a lot of additional tabs to which traders have to be distracted and switch their attention. Thanks to this
35 USD
Accuracy of correct predictions 83%! This indicator was tested on the basis of real statistics for all market indicators according to indicators for 3 months of trading. 83% of correct trade forecasts for usd / jpy on the m30 time frame were received on our statistics! if you have any questions, please contact us in private messages or in discussions under this indicator and we will figure it out and help any questions will arise personal messages or in discussions under this indicator As soon
100 USD
Noize Absorption Index - is the manual trading system that measures the difference of pressure between bears forces and bulls forces. Green line - is a noize free index that showing curent situation. Zero value of index shows totally choppy/flat market.Values above zero level shows how powerfull bullish wave is and values below zero measures bearish forces.Up arrow appears on bearish market when it's ready to reverse, dn arrow appears on weak bullish market, as a result of reverse expectation. S
199 USD
Matrix is a Forex arrow indicator. Displays signals simply and clearly! The arrows show the direction of the transaction, and are colored accordingly, which can be seen in the screenshots. As you can see, trading with such an indicator is easy. I waited for an arrow to appear in the desired direction - I opened a deal. An arrow formed in the opposite direction - closed the deal. The indicator also displays the lines with the help of which the arrow signals are formed, taking into account the int
99 USD
TWO PAIRS SQUARE HEDGE METER INDICATOR Try this brilliant 2 pairs square indicator It draws a square wave of the relation between your two inputs symbols when square wave indicates -1 then it is very great opportunity to SELL pair1 and BUY Pair2 when square wave indicates +1 then it is very great opportunity to BUY pair1 and SELL Pair2 the inputs are : 2 pairs of symbols         then index value : i use 20 for M30 charts ( you can try other values : 40/50 for M15 , : 30 for M30 , : 10 for H1 ,
10 USD
The Th3Eng PipFinite indicator is based on a very excellent analysis of the right trend direction with perfect custom algorithms. It show the true direction and the best point to start trading. With StopLoss point and Three Take Profit points. Also it show the right pivot of the price and small points to order to replace the dynamic support and resistance channel, Which surrounds the price. And Finally it draws a very helpful Box on the left side on the chart includes (take profits and Stop loss
89 USD
This is a new strategy for SUPPLY DEMAND areas It is based on a calculation using the tick volume to detect the big price action in market for both bear /bull actions this smart volume action candles are used to determine the supply and demand areas prices in between main supply and demand lines indicate sideway market  up arrows will be shown when prices moves above the main supply and the secondary supply lines Down arrows will be shown when prices moves below the main demand and the secondary
30 USD
A "Volume Profile" is an advanced charting indicator that displays total volume traded at every price level over a user specified time period. The main components of the volume profile are POC ( Point Of Control - the price level, at which the maximum number of contracts were executed during a selected period), VAH ( Value Area High - the highest price in the Value Area) and VAL ( Value Area Low - the lowest price in the Value Area). When we settled on the original indicator, we spent a lot o
150 USD
This indicator displays the histogram and arrows on chart. When Simple The Best Pro are placed on a chart, they identify the trend.  The color of may be blue or red. The blue color stands for upside moves and the red color stands for downside trends. The indicator offers to set Stop Loss (SL) and  Take Profit (TP)  setting. The default value is ATR. Indicator has automatic optimization. The STB is a unique indicator that shows the tendency (button Bars) of a particular signals. The STB tells us
78 USD
Time Bubble ***Specialized for GBPJPY 1H time frame*** (tested for two years with success rates about 82%) Time Circle's smart algorithm detects the price circles with time . give strong signals at the right time as result of combine the price and time. our team spent months to develop this indicator specially for GBPJPY ..with high success rates about 82% win trades over two years .tested from December 2016 to November 2018. *** in last two years total signals 1012 with 829 Wins and
40 USD
The Magneto Volume Trigger indicator is designed for determining the volume confirmed by the candlestick pattern and predicting the trend tendency. Indicator setup and use The calculation of values is affected by two parameters - Period and Gate . The lower the value of Gate , the higher the sensitivity of the indicator. Period allows making a sample of data for the specified number of candles. The lower the value of Period , the more the indicator is adapted to the current market conditions.
79 USD
Divergence indicator, Oscillator divergence detection, Forex divergence scanner, Divergence trading tool, Hidden divergence finder, Bullish divergence signal, Bearish divergence alert, Oscillator convergence indicator, Divergence pattern recognition, Multi-oscillator divergence scanner, Divergence analysis tool, Momentum divergence detector, Price oscillator divergence, Technical divergence signals, Oscillator trend reversal, Divergence confirmation tool, Oscillator divergence strategy, Forex d
49 USD
[ MT5 Version ] Supply and Demand Multitimeframe Supply and Demand Multitimeframe is the first indicator in the market that combines multiple aspects like trading volume, price structure and momentum to identify Supply and Demand zones for every asset. The Supply and Demand indicator analyzes simultaneously up to 4 different TFs and represents their information in the current graph. Its interactive UI highlights everytime the price enters a Supply or Demand zone even if the zones are not visib
224 USD
PipFinite Exit EDGE
Karlo Wilson Vendiola
4.89 (158)
Did You Have A Profitable Trade But Suddenly Reversed? In a solid strategy, exiting a trade is equally important as entering. Exit EDGE helps maximize your current trade profit and avoid turning winning trades to losers. Never Miss An Exit Signal Again Monitor all pairs and timeframes in just 1 chart www.mql5.com/en/blogs/post/726558 How To Trade You can close your open trades as soon as you receive a signal Close your Buy orders if you receive an Exit Buy Signal. Close your Sell orde
88 USD
サポートと抵抗のレベルは、長い間、市場分析のための強力なツールとなっています。 強力なサポート指標は、現地価格の最小値に基づいてサポートレベルをプロットし、現地価格の最大値に基づいて抵抗レベルをプロットします。  私の他の開発はここで見ることができます これは、トレンドに応じて取引し、同時に統合またはトレンド反転のゾーンを決定し、ストップロスを設定し、サポートと抵抗レベルで利益を取ることがで 設定と個人的なボーナスを受け取るために購入後すぐに私に連絡してください!  受信パラメータ - インジケータは複雑な設定を必要とせず、主なパラメータはカラースケールの調整です。 サポートと抵抗のレベルは、長い間、市場分析のための強力なツールとなっています。 強力なサポート指標は、現地価格の最小値に基づいてサポートレベルをプロットし、現地価格の最大値に基づいて抵抗レベルをプロットします。  私の他の開発はここで見ることができます これは、トレンドに応じて取引し、同時に統合またはトレンド反転のゾーンを決定し、ストップロスを設定し、サポートと抵抗レベルで利益を取るこ
50 USD
Pico Trend   professional forex expert   (for EURUSD, GBPUSD, USDJPY, AUDUSD, USDCHF, EURGBP, EURJPY, NZDUSD, USDCAD, EURCHF, AUDJPY, CADJPY pairs)   alyzing the market using the Elliot Wave Index. Elliott wave theory is the interpretation of processes in financial markets through a system of visual models (waves) on price charts. The author of the theory, Ralph Elliott, identified eight variants of alternating waves (of which five are in the trend and three are against the trend). The moveme
1 333 USD
Fibonacci retracements is a popular instrument used by technical analysts to determine support and resistance areas. In technical analysis, this tool is created by taking two extreme points (usually a peak and a minimum) on the chart and dividing the vertical distance by the key Fibonacci coefficients equal to 23.6%, 38.2%, 50%, 61.8%, and 100%. Once these levels are defined, horizontal lines are then drawn and used to determine possible support and resistance levels. When using the Auto Fibonac
30 USD
Gioteen Volatility Index (GVI)   - your ultimate solution to overcoming market unpredictability and maximizing trading opportunities. This revolutionary indicator helps you in lowering your losing trades due to choppy market movements. The GVI is designed to measure market volatility, providing you with valuable insights to identify the most favorable trading prospects. Its intuitive interface consists of a dynamic red line representing the volatility index, accompanied by blue line that indicat
100 USD
このプロダクトを購入した人は以下も購入しています
このインジケータは、手動および自動的な方法でチャートに描かれたハーモニックパターンを検出します。ユーザーマニュアルは、このリンクから参照できます: あなたのレビューを追加し、入手するために私たちに連絡してください。 この製品をmt4で試すための無料版があります。 GartleyおよびNenstarパターンを検出するために使用できます。 https://www.mql5.com/en/market/product/30181 完全なMT4バージョンを購入するには、次の場所から購入できます。 https://www.mql5.com/en/market/product/15212 注 インジケータにはコントロールパネルがあり、すべての(チャート&時間枠)設定が保存されます。チャート上でスペースをより多く確保するために、最小化することができ、他の分析ツールで作業する場合は、すべてのインジケータデータを非表示にするために閉じるボタンを押すことができます。 このインジケータを使用して設定を変更し、移動平均やボリンジャーバンドなどのインジケータを追加すると、編集のテンプレートが自動的に保存され、必
1 250 USD
Ultimate Sniper Dashboard
Hispraise Chinedum Abraham
4.67 (24)
299ドルで割引中! 今後値上げの可能性あり! 下の説明を読んでください! 究極のスナイパーダッシュボードのための最高のエントリーシステム。究極のダイナミックレベル。(私の製品をチェックしてください) 究極のスナイパーダッシュボードはMT4多通貨テスト制限のため、ライブマーケットでのみ作動します。 究極のスナイパーダッシュボードをご紹介します。HA-Sniper、MA-Sniper、その他多くの特別なモードが含まれる最高の製品です。究極のスナイパーダッシュボードは絶対的な獣です! 初心者やエキスパートトレーダーにとって最高のソリューションです。もう二度と動きを見逃さない! シンプルさとピップを愛するトレーダーのために、特別な製品をご用意しました。シンプルでありながら、ダッシュボードは複数のカスタムアルゴリズムに基づき28の通貨ペアを監視し、すべての作業を行います。たった一つのチャートで、プロのように市場を読み解くことができます。もし、為替ペアが動き出したときに、その方向性を正確に特定することができれば、あなたの取引はどれほど改善されることでしょう。   当社のシ
349 USD
もちろんです。以下は、提供いただいたテキストの日本語への翻訳です: MT4用の天文学指標をご紹介します:究極の天体トレーディングコンパニオン トレーディング体験を天空の高みに高める準備はできていますか?私たちの革命的なMT4用の天文学指標をご紹介します。この革新的なツールは、複雑なアルゴリズムの力を借りて、類まれなる天文学的洞察と精密な計算を提供します。 あなたの指先で宇宙の情報を: 宝のような天文学的データが明らかになる包括的なパネルをご覧ください。惑星の地理的/太陽中心座標、太陽と地球の距離、星の大きさ、伸び、星座、黄道座標および赤道座標、さらには水平座標まで、それぞれが綿密に計算され美しく表示されています。指標によって生成される垂直線は時間値に対応し、トレーディングの旅に宇宙の視点を提供します。 惑星のラインと関係: グラフを飾る惑星のラインの魔法を体験し、スケールと角度をカスタマイズできます。直感的なコントロールパネルを介して各惑星のラインの表示を簡単に切り替えることができます。指定された時刻範囲内での合会、六分会、四分会、三分会、対会、逆行の指標で天体の関係の芸術を発見してく
1 250 USD
PTS - Precision Trading Systemsによるダイバージェンスバイファインダー Precision Divergence Finderは、市場の底を非常に正確に見つけることを目的としており、頻繁に成功しています。 テクニカル分析において、底を選ぶ技術は通常、トップを選ぶよりもはるかに簡単です。このアイテムは、まさにこのタスクのために設計されました。ブルシューダイバージェンスが識別された後、買い物をする前にトレンドが上向きに転換するのを待つのが賢明です。10本または20本のバーの高値を入力するか、移動平均15-30を上昇中に使用してトレンドの変化を特定できます。 この複雑なアルゴリズムは、リアルタイムのバーバーベースでアクティブなデマンドインデックスのダイバージェンスの数を検出し、カウントします。 モデルは、市場価格が新しい安値を付けており、デマンドインデックスが新しい安値を付けていないときに、ダイバージェンスが発生していると観察します。 このインジケーターは、2つの設定を使用します。 1. デマンドインデックス(DI)の長さは、インジケー
397 USD
SWING X Blackは、MetaTrader 4(MT4)インジケーターの画期的なツールです。バイナリーオプションと外国為替の両方の手動および自動取引に対応するように精巧に作られています。比類のない精度とさまざまな時間枠への適応性が、利益を最大化したいトレーダーにとって強力なツールとなっています。SWING X Blackは15分の時間枠に最適化されており、迅速な意思決定と迅速な取引実行に最適です。また、トレーダーはマーチンゲール戦略を後続の信号に使用することを選択できるため、金融市場のダイナミックな世界に参入する際のリスク管理が強化されます。 主な特長: バイナリーオプションと外国為替の互換性: SWING X Blackは、バイナリーオプションと外国為替取引のギャップを調和的に埋め、トレーダーが両方の市場でその強力な洞察を活用できる多様性を提供します。このクロス互換性により、トレーダーは自分の好みの取引スタイルに関係なく、情報に基づいた意思決定をすることができ、成功の可能性を高めることができます。 正確な信号生成: SWING X Blackの核となる強みは、その非の打ちどこ
420 USD
A. A2SR とは何ですか ?   * 先行テクニカル指標です (塗り直しなし、ラグなし)。   * Special event :  https://c.mql5.com/1/263/A2SR_Discount_35_percent_in_August_2023.png -- ガイダンス : -- https://www.mql5.com/en/blogs/post/734748/page4#comment_16532516 -- そして https://www.mql5.com/en/users/yohana/blog A2SR には、サポート (需要) とレジスタンス (供給) のレベルを決定する特別な手法があります。 ネットで見かける通常の方法とは異なり、A2SR は実際の SR レベルを決定する独自のコンセプトを持っています。 元の手法はインターネットから取得されたものではなく、インターネット上で公開されたこともありません。 A2SR は、取引スタイルに応じて SR レベルを自動選択します。 時間枠を変更しても、SR レベルはその位置にとどまります。 実際
276 USD
INTRODUCING WORLD'S FIRST MT4 & MT5  Gann Dynamic Square, Circle and Equilateral Triangle  To Analyze Market Geometric Relationship. Gann Dynamic Square  has some of the most impressive features you will ever find in Gann & Geometric Analysis world. The Gann Dynamic Square is a tool to draw offset Square,Equilateral Triangle & Circle.Most charting software or MT4/MT5 market indicators don't have these features. You will be able draw your Geometric shapes like a professional geometric analys
399 USD
Candle Power Pro
Thushara Dissanayake
4.33 (6)
Candle Power Pro インジケーターを使用して、実際のボリューム情報の力を解き放ちます。この動的ツールは、各ローソク足の実際の体積データを取得し、それを総体積のパーセンテージとして表示します。そうすることで、市場での買い手と売り手の間で進行中の争いを識別できるようになります。 Candle Power Pro は、買い手と売り手の争いを総取引高に対する割合として表示し、市場のダイナミクスに関する貴重な洞察を提供します。買い手と売り手のボリュームを分析することでブレイクアウトを簡単に確認でき、より正確なエントリーポイントとエグジットポイントを確保できます。さらに、買い手と売り手のボリュームを利用して傾向を確認することができ、取引戦略の信頼性が高まります。さらに、買い手と売り手の量の変化を分析することでトレンドの反転を特定できるため、市場の変化に先んじることができます。 このインジケーターは、取引体験を向上させるためのさまざまな機能を提供します。簡単に視覚化できるようにボリューム平均を線として描画したり、ボリュームのパーセンテージを他の 19 個のシンボルと比較してさらに分析し
450 USD
Roger MedcalfによるPTS Divergence Finder Sell Indicator - Precision Trading Systems。 このインジケーターは売りの指示のみを提供します。 まず第一に、なぜ私が多くの年にわたり購買シグナルのダイバージェンスファインダーを提供する一方で、売買ダイバージェンスのインジケーターを提供しなかったのか、何度も質問されました。 私は売買ダイバージェンスが買いダイバージェンスよりも信頼性が低いという答えをしましたが、それは今も真実です。 この問題を解決するいくつかの方法が見つかりましたが、これはピアプレッシャーに屈せず、または私が15年以上前に作成したこのインジケーターの修正によるものではなく、デフォルト設定をより厳格に変更することで実現しました。 PTS Divergence Finder Sell Indicatorはどのように動作しますか? PTS Divergence Finder Sell Indicatorは、トレードボリュームに基づくDemand Indexで発生したダイバージェンスの数を正確に測定します。MT4
397 USD
The universal indicator Diamond Grail which received such a name is not so simple! The indicator has been tested for over a year by our experts! One of the best arrow indicators that is perfect for binary options and forex trading, If you trade on binary options, the best ragtime for it is from 3 minutes to a maximum of 5 minutes An arrow appears on the previous candle. If you trade forex, then the opening time from candle to candle Forex result From 40 To 1324 pips! Profitability
800 USD
これはほぼ間違いなく、MetaTraderプラットフォームで見つけることができる最も完全な調和価格形成自動認識インジケーターです。 19種類のパターンを検出し、フィボナッチプロジェクションをあなたと同じように真剣に受け止め、潜在的逆転ゾーン(PRZ)を表示し、適切なストップロスとテイクプロフィットレベルを見つけます。 [ インストールガイド | 更新ガイド | トラブルシューティング | よくある質問 | すべての製品 ] 19の異なる調和価格形成を検出します プライマリ、派生および補完フィボナッチ投影(PRZ)をプロットします 過去の価格行動を評価し、過去のすべてのパターンを表示します この指標は、独自の品質とパフォーマンスを分析します 適切なストップロスとテイクプロフィットのレベルを表示します ブレイクアウトを使用して適切な取引を通知します すべてのパターン比をグラフにプロットします 電子メール/音声/視覚アラートを実装します スコット・M・カーニーの本に着想を得て、この指標は最も純粋で急を要するトレーダーのニーズを満たすように設計されています。ただし、トレードを
299 USD
Speed Trade
Dmitriy Kashevich
1 (1)
スピードトレード-右手にある素晴らしいツール! これにより、市場を反対側から見ることができます! あなたが見たことのないすべての隠された信号と衝動は、この製品によって示されます! すべての通貨ペアで取引できるようにする多通貨インジケーター。 この製品は、原材料と暗号通貨でもテストされています。 1〜5m以内の時間枠を使用することをお勧めします。これは、高速でスマートな取引です。 すべての通貨ペアに対して完全に構成されています。 赤い矢印のレートを下げる 緑の矢印レートアップ また、あなたの便宜のために、あなたがその信号を逃さないようにアラートがインストールされています! 設定では、アラートアラートと矢印の色を変更できます 友達との取引を楽しんでください!
750 USD
F-16 Plane Indicatorをご紹介します。これは、取引体験を革新するために設計された最先端のMT4ツールです。F-16戦闘機の無類のスピードと精度に触発され、このインジケーターは高度なアルゴリズムと最新技術を組み合わせ、金融市場で比類のないパフォーマンスを提供します。 F-16 Plane Indicatorを使用すると、リアルタイムの分析と高精度な取引シグナルの生成が可能で、競争相手を圧倒します。ダイナミックな機能により、さまざまな資産クラスで利益を見つけることができ、自信を持って的確な決定を行うことができます。 使いやすいインターフェースを備えたF-16 Plane Indicatorは、人気のあるMetaTrader 4プラットフォームとシームレスに統合され、スムーズで効率的な取引プロセスを実現します。初心者のトレーダーでも経験豊富なプロフェッショナルでも、このインジケーターは独自の取引スタイルと好みに合わせて簡単にカスタマイズすることができます。 F-16 Plane Indicatorのパワーを体感し、市場のトレンドを精密かつ敏捷にナビゲートします。高度なチャー
450 USD
**Binary Smart Systemのご紹介:究極のトレードパートナー** Binary Smart Systemは単なるインジケーターではありません。様々な市場で的確なシグナルを提供し、洗練されたアルゴリズムと豊富なテクニカルインジケーターの集合をベースにした、トレーダーを的確さとタイムリーなシグナルで装備するための厳選されたトレードツールです。 **インジケーターコンポーネント:** 1. **移動平均パーセンテージ(MAP):** このコンポーネントは複数の移動平均の加重平均を計算し、トレンドの特定の強力な基盤を形成します。MAPは市場の状況に動的に適応し、現在のトレンド方向に対する洞察を提供します。 2. **商品チャネル指数(CCI):** 平均価格からの偏差を分析することで、CCIは買われすぎと売られすぎの状態を評価します。Binary Smart SystemのCCI統合は、ポテンシャルな反転ポイントを特定する包括的なアプローチを保証します。 3. **移動平均収束拡散法(MACD):** シンプルなクロスオーバーを超えるMACDコンポーネント
450 USD
Hello Everyone! However, the difficult task here for traders is to understand and select the indicator or tool that can help them with their trading plan and benefit their trading style. Traders want a tool that requires minimal effort and provides as much support as it can. There are multiple reasons for which traders need an indicator. One such reason is to determine the buy-sell signals in the market. The   King Binary Forex Scalping Indicator   is a tool that can help traders get answ
500 USD
Binary Booster
Yaroslav Varankin
5 (1)
The indicator was created for binary options trading the tool showed itself well; it turned out to be of high quality, reliable and quite accurate; therefore, it can give out about 70-80% of correct signals, depending on the chart when receiving a blue cross signal, you can enter a trade, but this is a weak signal when a cross and an arrow appear together, this is considered a reliable buy signal when receiving a red cross signal, you can enter a trade, but this is a weak signal when a cross and
400 USD
移動平均通貨強さダッシュボードは、 複数のシンボルや時間枠にわたる通貨の勢いについての深い洞察を提供する強力かつ包括的な指標です。この強力なツールは、移動平均を利用して最新のクロスオーバー ポイントを特定し、現在の価格までの通貨の強さを効果的に追跡します。このダッシュボードは、直感的なデザインとユーザーフレンドリーなインターフェイスにより、情報に基づいた意思決定を求めるトレーダーに豊富な情報を提供します。 このダッシュボードの重要な機能の 1 つは、スキャナ モードで動作する機能であり、ユーザーは市場をスキャンして潜在的な機会を見つけることができます。このインジケーターの包括的なダッシュボードにはすべてのシグナルがボタンとして表示され、必要な情報に簡単にアクセスできます。ボタンをクリックするだけで、クロスオーバー ラインを含む新しいチャートが開き、シグナルがより詳細に表示されます。さらに、グループ モード機能を使用すると、シンボルをグループに分けて表示でき、通貨の関係を構造化して表示できます。 カスタマイズ可能なパラメータを備えた移動平均通貨強さダッシュボードは、個々の取引の
450 USD
DESCRIPTION The CHAOS INDICATOR has been developed to be used for the TRADING STRATEGY OF CHAOS, as described in the book. The book is in italian language only and can be obtained only on my website indicated below. DATAS COLLECTED AND SHOWN ON GRAPHS The CHAOS INDICATOR apply easily to any graph and any asset, and it is a TRADING FACILITATOR, as it identify immediately the following items on any graph: - The GP (= RIGHT PRICE) i.e. the price to which the asset should be attracted within 24
380 USD
この指標は、W.D。Gannが書いた「市場予測の数式」​​の記事に基づく市場分析手法であり、9の2乗と144の2乗に依存しています。 ユーザーマニュアル: Add Your review And contact us to get it MT5のフルバージョンは次の場所から購入できます。 https://www.mql5.com/en/market/product/28669 あなたは無料でMT4でテストすることができます: https://www.mql5.com/en/market/product/15320?source=Site +Profile+Seller#!tab=reviews この製品は、レベル/スター/グリッド/ガンファン/として9の正方形を描くことができます。 ガンスクエアも描画します:52/90/144。 チャート上で直接移動可能なフリーガンスターを描画します。 また、ガンダイヤモンドを描画します。 それはあなたがあなたのエントリーのために最高のロットを計算することができるようにするロット計算機を持っ
1 250 USD
Reminder: After purchasing the unlimited version of this indicator send me the proof and I will add you to my private group so that you join the community and continue to learn more about this tool and grow together with other traders. You will also learn the strategy that will change your trading story! Dear Traders I am so glad to introduce my forex trading product called "Day Traders Master Board". This tool is designed for serious traders of any trading strategy.  My goal is to help trader b
275 USD
Your success as a forex trader depends on being able to identify when a currency or currency pair is oversold or overbought. If it is strong or weak. It is this concept which lies at the heart of forex trading. Without the Quantum Currency Strength indicator, it is almost impossible. There are simply too many currencies and too many pairs to do this quickly and easily yourself. You need help! The Quantum Currency Strength indicator has been designed with one simple objective in mind. To give you
279 USD
Weis Wave with Alert
Trade The Volume Waves Single Member P.C.
4.79 (19)
Get 30% Discount until 30/9/20203 on Lifetime package 420$ from 599$. Rental/Lifetime Package Options and Privileges' * For optimum results the yearly or lifetime package is suggested due to live training and Discord  channel trading with the  creator! Rent Monthly Six Months   Yearly/Lifetime Weis Wave with Speed with Alert+Speed Index x x x Manual  x x x Quick Set up Video x x x Blog x x x Lifetime Updates x x x Setup and Training Material x x Free Rectangle Break Alert Tool      x Discord
420 USD
INTRODUCING WORLD'S FIRST MT4 & MT5 Dynamic Gann Box and Circle To Analyze Markets Geometric Relationship. Dynamic Gann Box has some of the most impressive features you will ever find in Gann & Geometric Analysis world. The Dynamic Gann Box is a Tool to Drawing offset angles,squares and circles.Mr. M.S jenkins followed  offset squaring methods.Their is 3 dividers -33.3,66.6 also known as WD.Gann 333,666 method,4 dividers 25%,50%,75% to find out Timing Reversal/turning Points and support/resis
299 USD
The Nihilist 5.0 Indicator includes Forexalien and Nihilist Easy Trend trading strategies and systems. It is composed of an MTF Dashboard where you can analyze the different input possibilities of each strategy at a glance. It has an alert system with different types of configurable filters. You can also configure which TF you want to be notified on your Metatrader 4 platform and Mobile application The indicator has the option to view how could be a TP and SL by using ATR or fixed points, even
299 USD
Szia! Egy indikátorral. Több idő gyertyájának kirajzoltatása egy charton. Különböző színek rendelhetők a long és short gyertyákhoz. Vonal vastagsága állítható. A gyertya kitöltése engedélyezhető. Hello! With an indicator. Drawing multiple time candles on a chart. Different colors can be ordered for long and short candles. Line thickness can be adjusted. Filling the candle can be allowed. Videó: https://www.youtube.com/watch?v=-9bequnAw-g&amp ;ab_channel=GyulaKlein
300 USD
UPDATE: Works EXTREMELY well for EURJPY! --> more than 66% win rate monthly Guarantee! I want to introduce you the next-gen unique adaptive Binary options Indicator. This will destroy EURUSD & EURJPY The Raven is so sharp and efficient that it will pick the tops and bottoms of ANY type of market. Can also be used as a Forex Scalper. The Raven signal is based on multiple confirmation analysis. Gets confirmation from the most consistent signals known to man; Ichimoku, SMA, Bollinger Bands; and als
350 USD
Robot Choppiness
Diego Mauricio Padilla Mendez
5 (1)
Choppines ロボットは MT4 インジケーター フォルダーにインジケーターとしてロードされます 5 分のローソク足時間枠を使用することをお勧めします。推奨されるロボットの有効期限は 5 分です。 ロボットは、MT2、MX2、PRICEPRO プラットフォームに信号を送信するように構成できます。信号を送信するには、使用するプラットフォームのコネクタ プログラムを使用する必要があります。 コネクタに取り付けるには、次の手順を実行します (MT2 プラットフォーム コネクタの構成を説明する画像が添付されています)。 1.- MT4 プラットフォームに任意の通貨ペアをロードします 2.- セイルを M5 のタイミングで配置します。 3.- ファイル Robot-Choppiness.ex4 をロードするか、画面上で開いている通貨ペアにドラッグします。 4.- MT2 コネクタ (MX2、または PRICEPRO、一度に 1 つずつ) を画面にロードし、ファイル名、シグナル名、買いバッファ (2)、売りバッファ (3)​​ を設定し、ロボットの有効期限 =
799 USD
Full Forex Market View Dashboard
Opengates Success International
5 (2)
FULL FOREX MARKET VIEWダッシュボードインジケーター これは、トレーダーが市場で何が起こっているかを完全に把握できるようにするために作成されたカスタム指標です。 リアルタイム データを使用して市場にアクセスし、取引を成功させるために必要なあらゆる情報を表示します。 インストール: このインジケーターをウィンドウ チャートに添付する前に、MT4 のマーケット ウォッチ パネルに移動し、不要な通貨ペアまたは取引しないすべての通貨ペアを非表示にして、残りをそこに残します。 その理由は、FFMV ダッシュボードが MT4 の気配値表示に表示されるすべての通貨ペアを表示するためです。 最大 30 通貨ペア以下を表示できます。 MT4 の気配値表示でそれ以上だと、FFMV ダッシュボードのフォントと画像がぼやけて変形します。 正しく表示されません。 使用法:      個人取引の場合      バスケット取引の場合 (方法についてはスクリーンショットを参照してください)      複数注文取引にも使用可能      独自の取引システムなどから
650 USD
Target Striking - One of the best binary options trading tools! It is set up so powerfully that you can trade not only on currency pairs, but also on raw gold oil! You can also try on cryptocurrency! Ideal for trading on currency pairs, the percentage of reliable transactions is more than + 75% The trading tool is already set for the best profit! Only Target Striking can unlock the potential of the trading market for you! With it, the signals are even and accurate without redrawing,
1 650 USD
Urgent reminder> Only 13 copies remaining for the price to double on all renting options. Get your copy Today! Introduction Dear Traders, I am always working to come up with tools that may help you to become a better trader and investor. Due to my experience in trading and market analysis and trading software design and development, I am glad to introduce to you my other tool called " Amazing Entries Indicator ". The Indicator is designed in a way that it combines different strategy to provide
545 USD
作者のその他のプロダクト
The Volume by Price Indicator for MetaTrader 5 features Volume Profile and Market Profile TPO (Time Price Opportunity). Get valuable insights out of currencies, equities and commodities data. Gain an edge trading financial markets. Volume and TPO histogram bar, line and metric charts. TPO letter and block marker charts including split structures. Positioning and styling options to suit the user's needs and context. Volume Profile and Market Profile TPO Point of Control (VPOC and TPOC), Imbalanc
259 USD
フィルタ:
Sara Sabaghi
21050
Sara Sabaghi 2023.02.11 11:09 
 

Great job. you did it well. to support and respect for nice and inspiring tools in this market

Felmer Magbanua Blanca
292
Felmer Magbanua Blanca 2022.09.12 20:58 
 

Indeed Institutional trades

barko9
155
barko9 2022.04.11 13:14 
 

perfect indicator for day trading and scalping first i rented it i liked it and now i bought it thanks brian

GTR.fxSEAN
19
GTR.fxSEAN 2022.02.21 04:31 
 

This is the real deal! This is a beautiful tool with extensive customizability. Definitely worth more than it costs!

Daniel Nunes Ferreira
497
Daniel Nunes Ferreira 2021.12.19 18:28 
 

great!!!!!!!! best in indicators!

YHW1022221880
170
YHW1022221880 2021.03.10 05:47 
 

great!!!!!!!! best in indicators!

Vidya-Trading
368
Vidya-Trading 2019.12.10 20:31 
 

Good price/value ratio, very useful once you are familiar with the numerous settings :-) really a very powerful and usefull tool! Nothing comparable on the market, at least not for this price...

James Wails
539
James Wails 2019.06.01 11:42 
 

Finally, this is how institutional investors have their software and gain their edge. I mainly trade cryptocurrencies Ethereum and Bitcoin, but also stocks and commodities. Volume by Price is a MUST HAVE if you want to see in advance where support and resistance areas are located.

Kingsley Aduaka
74
Kingsley Aduaka 2019.05.21 16:13 
 

The most extensive volume profiling is now on MetaTrader. No more TradingView for me. Volume Price Analysis at its best.

Allan Rupert
139
Allan Rupert 2019.05.17 00:23 
 

I have plotted FTSE/JSE index futures volume data in USDZAR chart with the custom volume function. Really awesome on MT4! Best of all, multiple contract months aggregated by highest activity. I also appreciate the added dimension of volume by time as bubble chart.

Félix Schneider
396
Félix Schneider 2019.05.02 12:50 
 

Ideal for analyzing stocks and forex with focus on market action specifically volume price and time price. I can compare stocks from my portfolio and plot my custom SDR basket currency index on a single chart. Any TPO profile is automatically adjusted for trading hours. Recommended. Versatile and detailed. More than fair price.

Shafique Haryouli
98
Shafique Haryouli 2019.04.29 15:20 
 

Has all functions I need for Volume Price Analysis.

Ngoc Nguyen
539
Ngoc Nguyen 2019.04.14 04:35 
 

Volume is said to be the most important aspect beside price. For me volume is imperative. More specific volume profiles. Even with tick volume they produce the best reports on consensuses of strength of support and resistance levels. Price declines along with volume and a reversal is prone to happen.

I have seen a fair share of volume profile setups and indicators over the years. This indicator is by far the most versatile available for purchase. Profiles are highly customizable. Using it is great, lots of parameters but still easy to use. The manual helped me get a quick start. Runs smooth without hiccups on my ultrabook. My compliments to the developer. Hands-down the best volume profile indicator.

Taishiro Takahashi
384
Taishiro Takahashi 2019.03.26 06:12 
 

Good indicator. Worth the buy, very comprehensive work.

レビューに返信
バージョン 8.502 2023.06.15
• Improved functions for 'Style Main Line'
バージョン 8.498 2023.06.13
• Improved functions for 'Style Panel'
バージョン 8.496 2023.06.12
• Improved functions for 'Style Main Line'
バージョン 8.316 2023.06.08
• Improved graphics
バージョン 8.314 2023.06.05
• Stability and performance improvements
バージョン 8.312 2023.06.01
• Accessibility improvements
バージョン 8.310 2023.06.01
• Performance improvements
バージョン 8.204 2023.05.24
• Improved functions for 'Object Position'
• Improved functions for 'Dataset Segment'
バージョン 8.198 2023.05.22
• Improved graphics
バージョン 8.102 2023.05.01
• Improved functions for 'Interface Data Environment'
バージョン 8.0 2023.05.01
• Improved defaults
バージョン 7.998 2023.05.01
• Improved graphics
バージョン 7.996 2023.05.01
• Accessibility improvements
バージョン 7.994 2023.04.28
• Accessibility improvements
バージョン 7.993 2023.04.28
• Support for new extensions and resources
• Accessibility improvements
バージョン 7.991 2023.04.04
• Improved graphics
バージョン 7.987 2023.04.01
• Improved graphics
バージョン 7.985 2023.03.29
• Improved graphics
バージョン 7.975 2023.03.27
• Stability and performance improvements
バージョン 7.973 2022.11.15
• Support for new extensions
バージョン 7.972 2022.11.15
• Accessibility improvements
バージョン 7.970 2022.11.13
• Stability and performance improvements
バージョン 7.968 2022.11.11
• Stability and performance improvements
バージョン 7.962 2022.11.07
• Stability and performance improvements
バージョン 7.946 2022.11.03
• Stability and performance improvements
バージョン 7.942 2022.10.28
• Improved presets for 'Panel'
バージョン 7.941 2022.10.28
• Support for new resources
バージョン 7.940 2022.10.28
• Improved functions for 'Interface Data Source'
バージョン 7.931 2022.10.26
• Support for new extensions
バージョン 7.927 2022.10.25
• Accessibility improvements
バージョン 7.926 2022.10.25
• Improved resources
バージョン 7.924 2022.10.24
• Stability and performance improvements
バージョン 7.920 2022.10.21
• Stability and performance improvements
バージョン 7.918 2022.10.19
• Improved functions for 'Interface Data Source'
バージョン 7.914 2022.10.17
• Improved functions for 'Style Main Histogram'
バージョン 7.912 2022.10.17
• Support for new resources
バージョン 7.910 2022.10.17
• Improved functions for 'Style Column'
バージョン 7.902 2022.10.17
• Improved functions for 'Object Position'
バージョン 7.896 2022.10.10
• Support for new extensions
バージョン 7.895 2022.10.10
• Stability and performance improvements
バージョン 7.893 2022.10.06
• Improved resources
バージョン 7.892 2022.10.06
• Improved graphics
バージョン 7.891 2022.10.02
• Support for new resources
バージョン 7.890 2022.10.02
• Improved functions for 'Dataset Segment'
• Improved functions for 'Interface On-Chart Controls'
バージョン 7.850 2022.09.26
• Improved functions for 'Dataset'
バージョン 7.810 2022.09.24
• Stability and performance improvements
バージョン 7.808 2022.09.23
• Improved resources
バージョン 7.807 2022.09.22
• Improved graphics
バージョン 7.805 2022.09.20
• Performance improvements
バージョン 7.802 2022.09.15
• Support for new extensions
バージョン 7.799 2022.09.13
• Support for new resources
バージョン 7.798 2022.09.12
• Improved functions for 'Dataset'
バージョン 7.795 2022.09.10
• Improved functions for 'Interface Data Source'
バージョン 7.793 2022.09.04
• Improved functions for 'Interface Data Environment'
バージョン 7.792 2022.09.04
• Improved graphics
バージョン 7.791 2022.09.04
• Support for new resources
バージョン 7.790 2022.09.03
• Stability and performance improvements
バージョン 7.786 2022.08.29
• Improved resources
バージョン 7.785 2022.08.29
• Accessibility improvements
バージョン 7.765 2022.08.10
• Improved functions for 'Dataset'
バージョン 7.764 2022.08.10
• Improved functions for 'Interface Data Environment'
バージョン 7.762 2022.08.08
• Support for new resources
バージョン 7.761 2022.08.07
• Improved graphics
バージョン 7.760 2022.08.07
• Support for new resources
バージョン 7.759 2022.08.07
• Stability and performance improvements
バージョン 7.756 2022.08.05
• Stability and performance improvements
バージョン 7.754 2022.07.31
• Accessibility improvements
バージョン 7.752 2022.07.29
• Improved presets for 'Column'
バージョン 7.750 2022.07.27
• Improved functions for 'Dataset'
バージョン 7.740 2022.07.25
• Stability and performance improvements
バージョン 7.739 2022.07.24
• Improved functions for 'Interface Data Environment'
• Improved presets for 'Panel'
バージョン 7.712 2022.07.11
• Support for new resources
バージョン 7.711 2022.07.10
• Performance improvements
バージョン 7.709 2022.07.06
• Improved functions for 'Dataset'
バージョン 7.654 2022.06.28
• Improved functions for 'Panel'
バージョン 7.653 2022.06.27
• Stability and performance improvements
バージョン 7.652 2022.06.27
• Stability and performance improvements
バージョン 7.651 2022.06.27
• Support for new resources
バージョン 7.650 2022.06.26
• Improved functions for 'Dataset Segment'
バージョン 7.601 2022.06.20
• Improved graphics
バージョン 7.600 2022.06.20
• Accessibility improvements
バージョン 7.590 2022.06.15
• Performance improvements
バージョン 7.560 2022.05.23
• Accessibility improvements
バージョン 7.550 2022.05.23
• Accessibility improvements
バージョン 7.540 2022.05.15
• Accessibility improvements
バージョン 7.530 2022.05.14
• Accessibility improvements
バージョン 7.520 2022.04.18
• New 'TPO' parameter for 'Evaluation Column'
• Improved functions for 'Interface Data Environment'
バージョン 7.509 2022.04.06
• Accessibility improvements
バージョン 7.508 2022.04.04
• Support for new resources
バージョン 7.507 2022.04.03
• Accessibility improvements
バージョン 7.506 2022.03.08
• Accessibility improvements
バージョン 7.504 2022.03.04
• Improved functions for 'Style Indication'
バージョン 7.502 2022.03.03
• Performance improvements
バージョン 7.501 2022.03.03
• Stability and performance improvements
バージョン 7.499 2022.03.02
• Improved functions for 'Text'
バージョン 7.498 2022.03.02
• New 'Size' parameters for 'Style Main' and 'Style Column'
バージョン 7.495 2022.03.01
• Improved presets for 'Column'
バージョン 7.490 2022.02.27
• New 'Volume' and 'Price Level' parameters for 'Evaluation'
• Improved functions for 'Style Main'
• Improved presets for 'Dataset'
バージョン 7.410 2022.02.25
• Improved functions for 'Style Column'
• Fix for multi timeframe data load issue on platform restart
バージョン 7.405 2022.02.22
• New 'Actual Price Level' preset for 'Panel'
バージョン 7.400 2022.02.22
• New 'Price Level Grid' parameter for 'Dataset'
バージョン 7.370 2022.01.06
• Support for new resources
• Improved graphics
バージョン 7.360 2021.12.11
• New 'Area' option for 'Indication Column'
• New 'Volume' parameter for 'Evaluation Column'
バージョン 7.350 2021.12.09
• Support for new resources
• Improved 'Market Profile (TPO) - Histogram' option for 'Main'
バージョン 7.340 2021.12.06
• New 'History' parameter for 'Dataset'
• New 'Padding' parameter for 'Style Column'
• Accessibility improvements
バージョン 7.310 2021.12.02
• Support for new resources
• Improved functions for 'Main'
バージョン 7.300 2021.11.30
• New 'Direction' parameter for 'Main'
• New 'Market Profile (TPO) - Histogram' option for 'Main'
• New 'Ray' and 'Color' parameters for 'Style Highlight Line' and 'Style Highlight Background Fill'
• New 'Line' options for 'Highlight Main'
• New 'Label' parameters for 'Style Highlight Line'
• Fix for templates issue
• New 'Anchor' parameter options for 'Panel'
• Improved defaults for 'Evaluation HVN/LVN'
バージョン 7.190 2021.11.24
• Stability and performance improvements
バージョン 7.103 2021.11.22
• Accessibility improvements
バージョン 7.0 2021.11.19
several improvements
バージョン 6.191 2021.07.06
fixed issue string value parameter (input as file)
バージョン 6.190 2021.07.05
feature update (data environment)
several improvements
reset parameter default values
バージョン 6.112 2021.06.27
several improvements
presets update
バージョン 6.110 2021.06.25
several improvements
バージョン 6.109 2021.06.24
several improvements
バージョン 6.108 2021.06.23
several improvements
バージョン 6.107 2021.06.21
several improvements
バージョン 6.105 2021.06.20
several improvements
バージョン 6.101 2021.06.17
several improvements
バージョン 6.1 2021.06.15
several improvements
バージョン 6.0 2021.06.12
feature upgrades
reorder parameters
バージョン 5.912 2021.03.12
extended drawing functions
performance improvements
バージョン 5.910 2021.03.08
extended data functions (time range method)
バージョン 5.909 2021.03.07
several improvements
extended data functions (market profile)
バージョン 5.900 2021.03.04
several improvements
extended data functions (price zone labels)
バージョン 5.897 2021.03.02
several improvements
extended data functions (volume time statistics)
improvements strategy tester / free demo
reset parameter default values
バージョン 5.895 2021.03.01
several improvements
presets update (example setting files)
バージョン 5.893 2021.03.01
extended data functions (time range method)
extended drawing functions (market profile - block marker)
reorder parameters
バージョン 5.845 2021.02.27
several improvements
user manual update
バージョン 5.843 2021.02.27
extended drawing functions (highlight option)
バージョン 5.842 2021.02.27
performance improvements
presets update (example setting files)
reset parameter default values
バージョン 5.839 2021.02.26
several improvements
バージョン 5.838 2021.02.26
extended data functions (session filter)
バージョン 5.833 2021.02.25
several improvements
extended drawing functions (update rates)
バージョン 5.830 2021.02.24
feature upgrade
extended data functions (volume time statistics - segment)
バージョン 5.821 2021.02.23
fixed issue drawing function (vp scale by chart)
バージョン 5.820 2021.02.23
extended drawing functions
improvements strategy tester / free demo
バージョン 5.810 2021.02.22
extended data functions (time statistics option)
バージョン 5.809 2021.02.22
several improvements
presets update (example setting files)
バージョン 5.807 2021.02.21
reset parameter default values
performance improvements
バージョン 5.806 2021.02.21
several improvements
バージョン 5.802 2021.02.19
several improvements
バージョン 5.800 2021.02.18
extended drawing functions
bug fixes and performance improvements
presets update (chart color schemes)
reset parameter default values
バージョン 5.652 2021.02.17
several improvements
バージョン 5.641 2021.02.14
extended data functions (market profile - dynamic)
presets update (built-in)
user manual update
バージョン 5.631 2021.02.12
several improvements
presets update (example setting files)
バージョン 5.622 2021.02.10
several improvements
バージョン 5.621 2021.02.10
several improvements
extended data functions (volume time statistics - segment)
バージョン 5.617 2021.02.08
several improvements
バージョン 5.614 2021.02.08
several improvements
presets update (setting files)
バージョン 5.611 2021.02.08
extended data functions (time range option)
バージョン 5.606 2021.02.06
several improvements
バージョン 5.604 2021.02.04
reset parameter default values
バージョン 5.603 2021.02.04
performance improvements
バージョン 5.601 2021.02.03
extended drawing functions (vwap)
バージョン 5.598 2021.02.03
several improvements
reset parameter default values
バージョン 5.596 2021.02.03
several improvements
バージョン 5.593 2021.02.01
several improvements
バージョン 5.590 2021.02.01
extended drawing functions (volume time statistics - mtf)
presets update (setting files)
バージョン 5.521 2021.01.28
performance improvements
バージョン 5.517 2021.01.28
several improvements
extended data functions (range bar)
バージョン 5.514 2021.01.28
several improvements
バージョン 5.510 2021.01.28
extended data functions (volume time statistics - mtf)
extended drawing functions (market profile)
バージョン 5.490 2021.01.27
extended data functions (market profile)
extended drawing functions (volume time statistics)
バージョン 5.460 2021.01.26
several improvements
バージョン 5.452 2021.01.25
several improvements
extended data functions (time range option)
バージョン 5.450 2021.01.25
performance improvements
extended data functions
バージョン 5.218 2021.01.24
several improvements
extended data functions (update rates)
user manual update
バージョン 5.208 2021.01.23
reset parameter default values
user manual update
presets update (setting files)
バージョン 5.207 2021.01.22
several improvements
presets update (setting files)
バージョン 5.206 2021.01.22
presets update (setting files)
バージョン 5.205 2021.01.22
reset parameter default values
extended drawing functions (line highlights)
バージョン 5.204 2021.01.21
extended drawing functions (mp marker block)
バージョン 5.203 2021.01.18
extended data functions (market profile - dynamic)
バージョン 5.202 2021.01.18
extended data functions (time range option)
バージョン 5.201 2021.01.17
presets update (built-in)
improvements strategy tester / free demo
バージョン 5.199 2021.01.16
user manual update
バージョン 5.198 2021.01.16
improvements strategy tester / free demo
バージョン 5.197 2021.01.16
several improvements
extended data functions (market profile)
バージョン 5.195 2021.01.15
several improvements
extended data functions (session filter)
バージョン 5.193 2021.01.13
several improvements
resources update
バージョン 5.192 2021.01.10
user manual update
presets update (setting files)
バージョン 5.191 2021.01.09
several improvements
user manual update
バージョン 5.190 2021.01.08
several improvements
reset parameter default values
presets update (setting files)
バージョン 5.163 2020.07.08
several improvements
reset parameter default values
バージョン 5.162 2020.07.07
several improvements
バージョン 5.161 2020.05.04
extended data functions
performance improvements
バージョン 5.159 2020.05.03
feature update
performance improvements
バージョン 5.152 2020.05.01
several improvements
バージョン 5.150 2020.05.01
feature upgrade
extended data functions (highlight method)
presets update (setting files)
バージョン 5.140 2020.04.30
feature update
バージョン 5.137 2020.04.29
extended data functions (time range segmentation method)
バージョン 5.135 2020.04.28
extended data functions (time range update rate)
performance improvements
バージョン 5.134 2020.04.27
performance improvements
バージョン 5.133 2020.04.27
several improvements
バージョン 5.132 2020.04.21
several improvements
バージョン 5.131 2020.04.20
several improvements
バージョン 5.130 2020.04.20
extended drawing functions (mp marker block size scale non-uniform)
reset parameter default values
presets update (setting files)
バージョン 5.120 2020.04.18
feature upgrade
extended data functions (time range segmentation method)
reset parameter default values
presets update (setting files)
バージョン 5.118 2020.04.14
extended data functions (time range segmentation method)
presets update (setting files)
バージョン 5.116 2020.04.13
several improvements
presets update (setting files)
バージョン 5.115 2020.04.13
extended data functions (time range option)
バージョン 5.113 2020.04.10
extended data functions (time range options and update rate)
reset parameter default values
presets update (setting files)
バージョン 5.112 2020.04.04
presets update
バージョン 5.110 2020.04.03
extended drawing functions
reset parameter default values
バージョン 5.109 2020.04.02
feature update
reset parameter default values
presets update (setting files)
バージョン 5.108 2020.03.31
performance improvements
reset parameter default values
バージョン 5.107 2020.03.30
feature update
バージョン 5.106 2020.03.29
extended data functions
バージョン 5.105 2020.03.27
presets update
chart script update
バージョン 5.104 2020.03.27
several improvements
バージョン 5.103 2020.03.25
feature upgrade
reset parameter default values
presets update
バージョン 5.99 2020.03.16
several improvements
バージョン 5.98 2020.03.15
extended data functions
extended drawing functions
バージョン 5.97 2020.03.14
presets update (built-in)
バージョン 5.96 2020.03.13
several improvements
バージョン 5.95 2020.03.12
several improvements
バージョン 5.94 2020.02.17
several improvements
バージョン 5.93 2020.02.10
extended data functions
performance improvements
バージョン 5.91 2020.02.09
extended data functions
バージョン 5.90 2020.02.09
several improvements
reset parameter default values
presets update
バージョン 5.89 2020.02.08
several improvements
バージョン 5.88 2020.02.05
performance improvements
バージョン 5.87 2020.02.05
presets update (built-in)
バージョン 5.86 2020.02.05
several improvements
バージョン 5.85 2020.02.05
several improvements
reset parameter default values
presets update
バージョン 5.84 2020.02.04
several improvements
バージョン 5.83 2020.02.04
extended data functions
バージョン 5.82 2020.02.04
several improvements
バージョン 5.81 2020.02.03
feature update
extended data functions
バージョン 5.78 2020.02.01
feature update
extended data functions
extended drawing functions
reset parameter default values
presets update
バージョン 5.76 2020.01.31
several improvements
reset parameter default values
バージョン 5.75 2020.01.30
reset parameter default values
バージョン 5.74 2020.01.30
feature updates
extended data functions
extended drawing functions
reset parameter default values
presets update
バージョン 5.65 2020.01.22
feature upgrade
extended drawing functions
presets update
バージョン 5.62 2020.01.21
performance improvements
presets update
バージョン 5.61 2020.01.21
performance improvements
presets update
バージョン 5.60 2020.01.21
feature updates
extended drawing functions
reset parameter default values
presets update
バージョン 5.57 2020.01.19
several improvements
バージョン 5.56 2020.01.19
feature update
extended drawing functions
バージョン 5.54 2020.01.19
performance improvements
バージョン 5.53 2020.01.18
feature upgrade
バージョン 5.52 2020.01.18
performance improvements
バージョン 5.49 2020.01.17
several improvements
バージョン 5.48 2020.01.17
feature updates
extended drawing functions
extended data functions
performance improvements
reset parameter default values
バージョン 5.45 2020.01.16
performance improvements
バージョン 5.40 2020.01.15
feature update
extended drawing functions
reset parameter default values
presets update
バージョン 5.38 2020.01.14
feature update
extended data functions
reset parameter default values
バージョン 5.37 2020.01.13
performance improvements
バージョン 5.36 2020.01.13
feature update
バージョン 5.35 2020.01.12
several improvements
reset parameter default values
バージョン 5.34 2020.01.11
several improvements
バージョン 5.33 2020.01.10
feature upgrade
extended data functions
extended drawing functions
reset parameter default values
presets update
バージョン 5.27 2020.01.08
feature upgrade
extended data functions
extended drawing functions
reset parameter default values
presets update
バージョン 5.24 2020.01.06
feature upgrade
extended data functions
extended drawing functions
reset parameter default values
presets update
バージョン 5.22 2020.01.05
performance improvements
バージョン 5.21 2020.01.04
feature upgrade
extended drawing functions
バージョン 5.20 2020.01.04
several improvements
バージョン 5.19 2020.01.03
several improvements
reset parameter default values
presets update
バージョン 5.18 2020.01.02
several improvements
バージョン 5.17 2020.01.02
reset parameter default values
バージョン 5.16 2020.01.02
feature upgrade
extended data functions
extended drawing functions
バージョン 5.15 2019.12.30
feature upgrade
バージョン 5.14 2019.12.28
performance improvements
バージョン 5.13 2019.12.27
several improvements
バージョン 5.12 2019.12.27
feature updates
extended data functions
several improvements
reset parameter default values
バージョン 5.10 2019.12.24
explicitly set encoding for string conversion operations
バージョン 5.8 2019.12.24
feature update
reset parameter default values
バージョン 5.7 2019.12.22
feature upgrade
parameters update
バージョン 5.6 2019.12.21
feature upgrade
several improvements
reset parameter default values
presets update
バージョン 5.5 2019.12.20
extended drawing functions
reset parameter default values
バージョン 5.4 2019.12.20
extended drawing functions
バージョン 5.3 2019.08.01
feature update
extended data functions
バージョン 5.1 2019.07.20
feature update
バージョン 5.0 2019.07.19
final checks
バージョン 4.102 2019.07.11
feature update
バージョン 4.101 2019.07.09
feature update
バージョン 4.99 2019.07.08
several improvements
バージョン 4.98 2019.07.07
feature upgrade
various feature updates
extended drawing and data functions
reset parameter default values
バージョン 4.96 2019.06.20
several improvements
バージョン 4.95 2019.06.20
several improvements
バージョン 4.93 2019.06.14
feature update
バージョン 4.92 2019.06.14
several improvements
バージョン 4.90 2019.06.13
reset parameter default values
バージョン 4.89 2019.06.13
feature upgrades
バージョン 4.78 2019.06.09
various feature updates
reset parameter default values
バージョン 4.74 2019.06.07
extended drawing functions
バージョン 4.71 2019.06.06
extended drawing functions
performance improvements
バージョン 4.70 2019.06.05
feature update
バージョン 4.69 2019.06.05
several improvements
バージョン 4.67 2019.06.04
performance improvements
バージョン 4.66 2019.06.04
feature update
several improvements
バージョン 4.63 2019.06.02
several improvements
バージョン 4.62 2019.06.02
extended drawing functions
バージョン 4.61 2019.06.02
extended drawing functions
performance improvements
バージョン 4.58 2019.05.31
several improvements
reset parameter default values
バージョン 4.57 2019.05.31
feature upgrade
extended drawing functions
バージョン 4.45 2019.05.30
feature update
several improvements
バージョン 4.41 2019.05.27
various feature updates and upgrades
extended drawing and data functions
performance improvements
reset parameter default values
バージョン 4.1 2019.05.22
extended data functions
バージョン 4.0 2019.05.21
various feature updates
extended drawing functions
reset parameter default values
バージョン 3.106 2019.05.21
several improvements
バージョン 3.105 2019.05.20
several improvements
バージョン 3.104 2019.05.19
feature upgrade
various feature updates
reset parameter default values
バージョン 3.98 2019.05.17
feature upgrade
バージョン 3.97 2019.05.16
several improvements
updated various parameter defaults
バージョン 3.96 2019.05.16
performance improvements
extended drawing functions
バージョン 3.95 2019.05.15
feature upgrade
バージョン 3.93 2019.05.15
various feature updates
reset parameter default values
バージョン 3.91 2019.05.14
several improvements
バージョン 3.89 2019.05.13
various feature updates
reset parameter default values
バージョン 3.87 2019.05.13
updated various parameter defaults
バージョン 3.86 2019.05.13
feature upgrade
various feature updates
reset parameter default values
バージョン 3.61 2019.05.10
several improvements
バージョン 3.59 2019.05.06
various feature updates
reset parameter default values
バージョン 3.57 2019.05.02
several improvements
バージョン 3.56 2019.04.29
various feature updates
バージョン 3.54 2019.04.29
several improvements
バージョン 3.53 2019.04.29
feature upgrade
バージョン 3.51 2019.04.26
feature upgrade
バージョン 3.48 2019.04.26
various feature updates
バージョン 3.44 2019.04.24
performance improvements
バージョン 3.43 2019.04.24
several improvements
reset parameter default values
バージョン 3.42 2019.04.23
feature upgrade
バージョン 3.36 2019.04.21
feature upgrade
バージョン 3.33 2019.04.20
performance improvements
バージョン 3.32 2019.04.20
several improvements
reset parameter default values
バージョン 3.31 2019.04.20
feature upgrade
バージョン 3.29 2019.04.19
feature upgrade
バージョン 3.28 2019.04.18
various feature updates
バージョン 3.27 2019.04.17
extended drawing functions
バージョン 3.26 2019.04.17
performance improvements
バージョン 3.25 2019.04.16
performance improvements
バージョン 3.24 2019.04.16
several improvements
バージョン 3.23 2019.04.16
various feature updates
バージョン 3.22 2019.04.15
performance improvements
バージョン 3.21 2019.04.15
feature upgrade
バージョン 3.17 2019.04.14
several improvements
バージョン 3.16 2019.04.14
various feature updates
reset parameter default values
バージョン 3.15 2019.04.13
several improvements
バージョン 3.13 2019.04.13
performance improvements
バージョン 3.11 2019.04.12
feature upgrade
various feature updates
バージョン 3.7 2019.04.10
several improvements
バージョン 3.5 2019.04.08
various feature upgrades
バージョン 3.1 2019.04.05
changed various parameter defaults
バージョン 3.0 2019.04.05
various feature upgrades
performance improvements
バージョン 2.49 2019.04.04
various feature updates
バージョン 2.44 2019.04.03
feature upgrade
バージョン 2.41 2019.04.03
feature upgrade
バージョン 2.39 2019.04.01
feature upgrade
バージョン 2.37 2019.04.01
several improvements
バージョン 2.36 2019.04.01
various feature updates
バージョン 2.34 2019.03.30
several improvements
バージョン 2.33 2019.03.29
various feature updates
バージョン 2.32 2019.03.28
several improvements
バージョン 2.31 2019.03.26
feature upgrade
バージョン 2.30 2019.03.26
several improvements
バージョン 2.26 2019.03.22
various feature upgrades
バージョン 2.24 2019.03.20
extended data functions
バージョン 2.22 2019.03.20
extended drawing functions
バージョン 2.21 2019.03.19
performance improvements
バージョン 2.20 2019.03.19
various feature upgrades
バージョン 2.18 2019.03.18
changed parameter 'Buffer Limit' default to max
バージョン 2.17 2019.03.18
several improvements
バージョン 2.16 2019.03.18
several improvements
バージョン 2.15 2019.03.18
various feature upgrades
バージョン 2.2 2019.02.26
extended drawing functions
バージョン 2.1 2019.02.24
added input parameter "Draw Height Subtract"
added input parameter "Draw Anchor, Time"
バージョン 2.0 2019.02.22
performance improvements
extended drawing functions
バージョン 1.9 2019.02.22
performance improvements
extended drawing functions
added input parameter "Border Merge"
バージョン 1.8 2019.02.21
fixed incorrect link properties
バージョン 1.7 2019.02.20
added new feature "Snap Time"
バージョン 1.5 2019.02.18
improvements strategy tester
various feature updates
バージョン 1.3 2019.02.15
stability and performance improvements
fixed issue strategy tester
バージョン 1.2 2019.02.12
updated description and link properties
バージョン 1.1 2019.02.11
stability and performance improvements
fixed issue initial drawing