Line of Loss Percent for Controlling Risk MT5
- インディケータ
- shi hong he
- バージョン: 1.2
- アクティベーション: 5
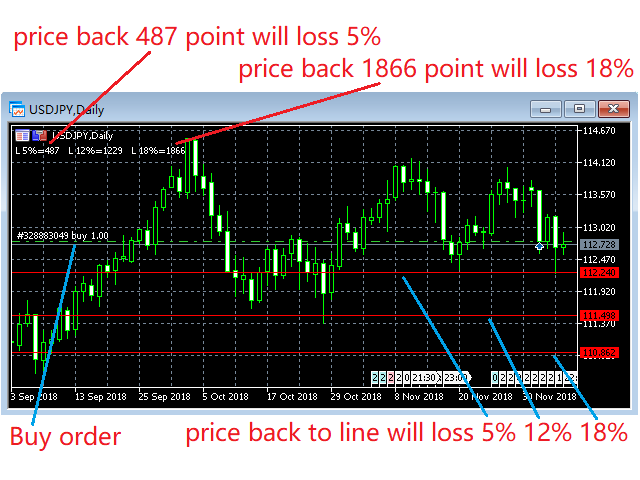
This positions risk visualization indicators, indicators allow you to clearly know price go back will be generated how much account Loss Percent.
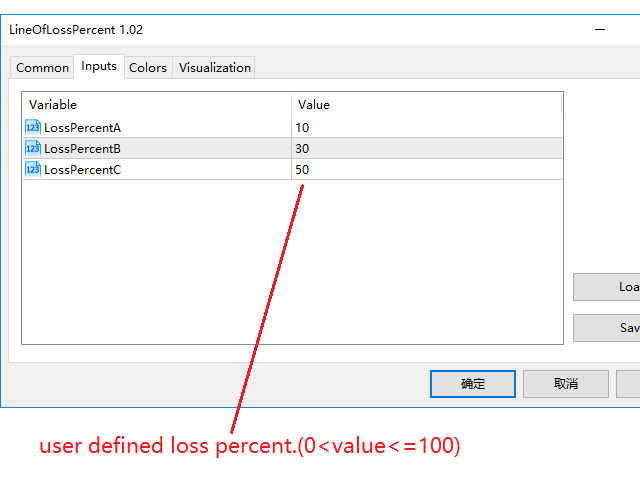
This is very useful indicator for Controlling Risk when account is open positions, attach this indicator to the chart of the open positions, this indicator will draw three Lines, the three Line of Loss Percent default value is 10% 30% 50% user can define their own Loss Percent value. Loss Percent corresponding Back Point will show in the upper left corner.
Line of Loss Percent can give you clearly know what price is account loss percent, can give you better control account positions, it allows you to know the risks of the open positions.
For example to buy type positions , when you judgment that the market price will not be lower than a Certain Price, then the Line of Loss 10% Price is below this certain price, you can continue to open buy type positions. as long as the Market Price is higher than the Loss 10% Price, the account will be loss less than 10%.
For example to sell type positions, when you judgment that the Market Price will not be higher than a Certain Price, then the Line of Loss 12% Price is above this certain price, you can continue to open sell type positions. as long as the Market Price is lower than the Loss 12% Price, the account will be loss less than 12%.