Free Automatic Fibonacci MT5
- インディケータ
- Tonny Obare
- バージョン: 1.20
- アップデート済み: 9 3月 2021
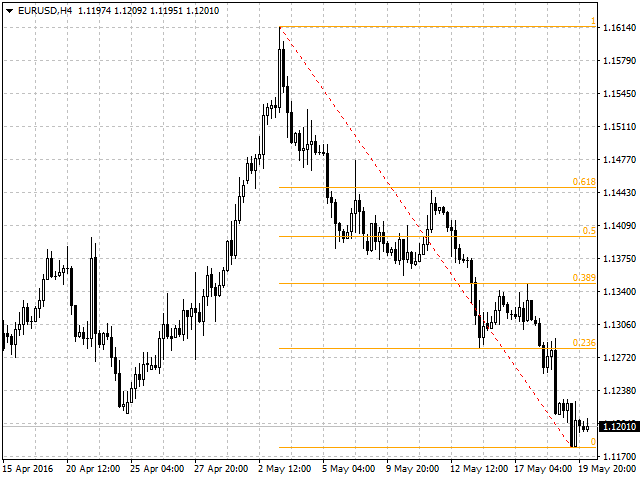
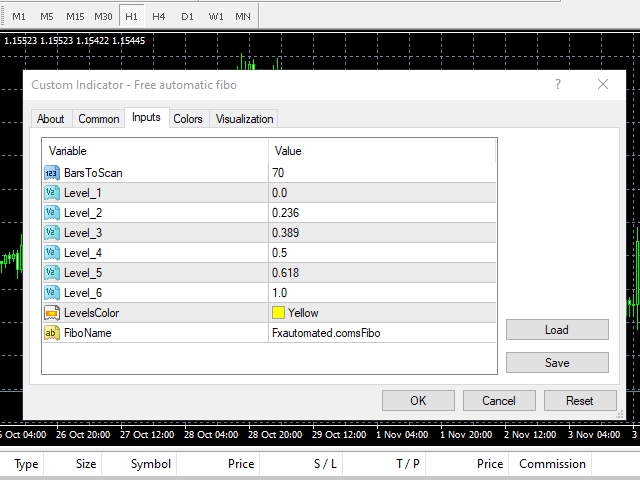
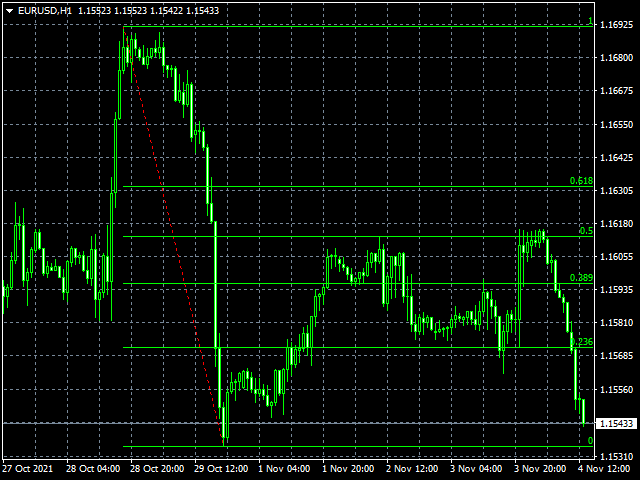
Free automatic Fibonacci is an indicator that automatically plots a Fibonacci retracement based on the number of bars you select on the BarsToScan setting in the indicator. The Fibonacci is automatically updated in real time as new highest and lowest values appears amongst the selected bars. You can select which level values to be displayed in the indicator settings. You can also select the color of the levels thus enabling the trader to be able to attach the indicator several times with different settings and colors. The settings are explained below:
- BarsToScan - Set number of bars for the indicator to check for values
- Level_1 - First level of the Fibonacci
- Level_2 - Second level of the Fibonacci
- Level_3 - Third level of the Fibonacci
- Level_4 - Fourth level of the Fibonacci
- Level_5 - Fifth level of the Fibonacci
- Level_6 - Sixth level of the Fibonacci
- LevelsColor - Setting to customize the color of the Fibonacci levels
- FiboName - Setting for the name of the Fibonacci. If you attach several times then each Fibonacci should have a different name.


.