Gekko Moving Averages Plus
- インディケータ
- Rodrigo Galeote
- バージョン: 1.11
- アップデート済み: 17 2月 2023
- アクティベーション: 5
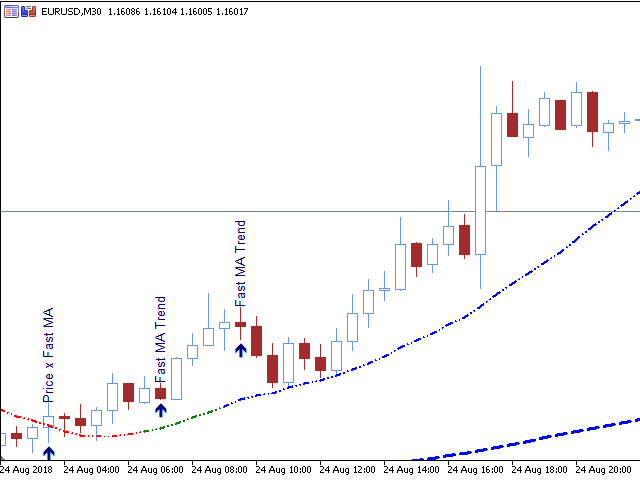
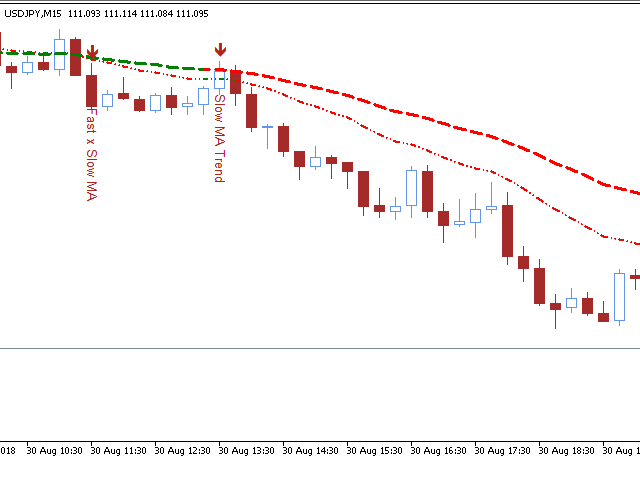
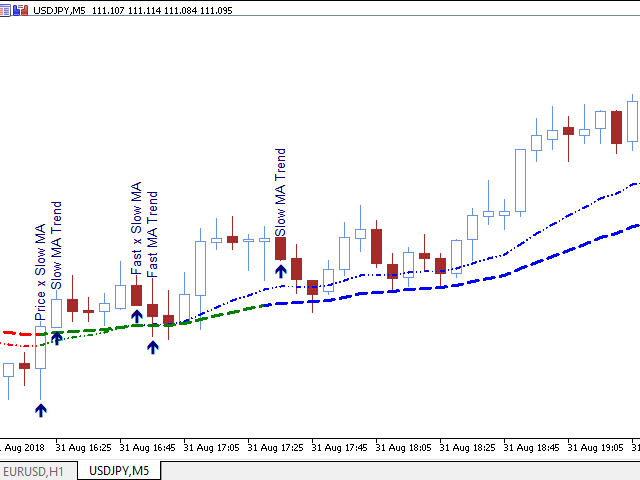
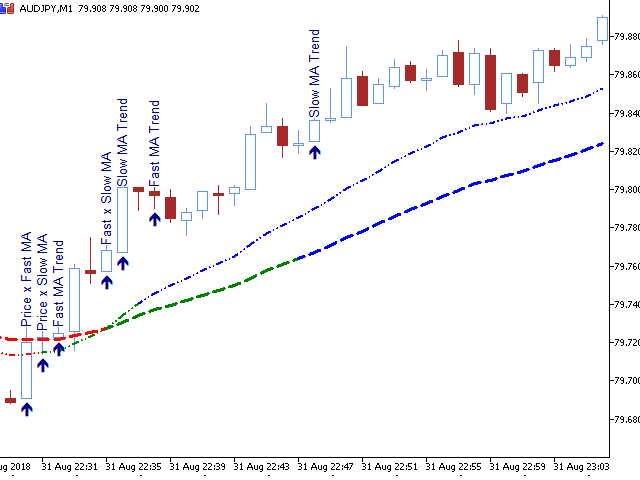
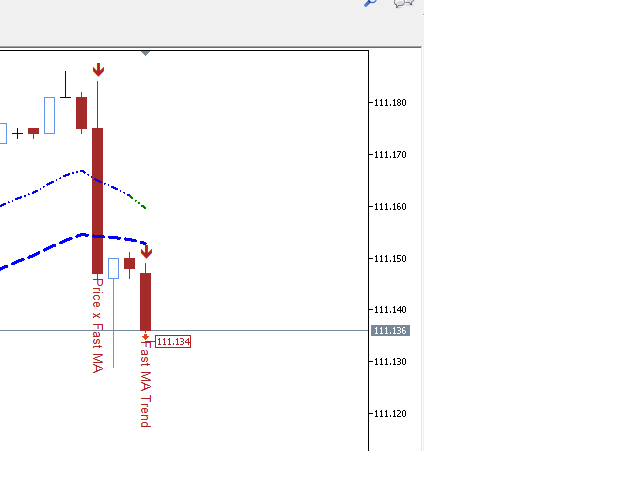
his is Gekko's Moving Averages indicator. It extends the use of the famous moving averages and calculates strong entry and exit signals using Price versus a Fast Moving Average versus a Slow Moving Average. You can set it up in many different ways, eg: price crossing, moving averages crossing, moving averages trend, among others.
Inputs
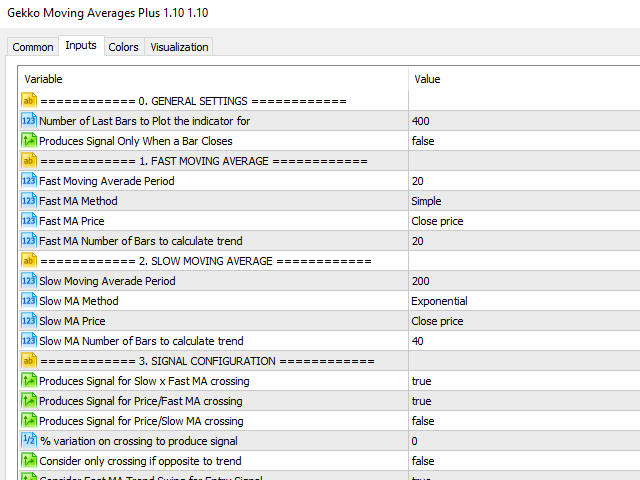
- Number of Bars to Plot Indicator: number of historical bars to plot the indicator, keep it low for better performance;
- FAST Moving Average Details: settings for the FAST Moving Average such as: period, method (simple, exponential, etc.), price (close, high, low, etc.) and number of barsto calculate MA trend;
- SLOW Moving Average Details: settings for the SLOW Moving Average such as: period, method (simple, exponential, etc.), price (close, high, low, etc.) and number of barsto calculate MA trend;
- Signal Configuration: settings for how signal will be produced, eg: Slow x Fast moving averages crossing, price x moving average, when moving average switches trend;
- Produces Signal Only When a Bar Closes: wait for a bar to close to produce a signal (more accurate, by delayed entry) or produces signal online (could trigger false signals);
- Visualization: settings for showing multicolored moving averages to indicate trend changes, texts on bars to show signal description and price tag for online signal.
- Plays a sound when there is a swing: set it as true and it will play a sound on the MetaTrader terminal every time there is a new signal produced indicating entry or exit points.
- Write Logs On Terminal Window: set it as true if you want the indicator to write logs on the terminal's Experts tab every time a new signal is produced indicating entry or exit points
- Send Mobile Push Notifications: set it as true if you desire to receive push notifications on the MetaTrader app on your mobile when a new signal is produced indicating entry or exit points
- Send E-Mail Alerts: set it as true if you desire to receive e-mail alerts at the e-mail address configured on the terminal when a new signal is produced indicating entry or exit points
Good trades!
Donate part of your profit to good causes and humanitarian entities of your choice. "Money only comes if there's a purpose for you to earn it".