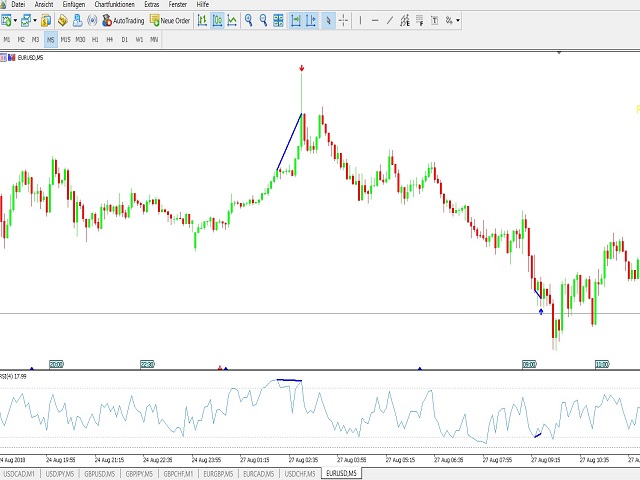
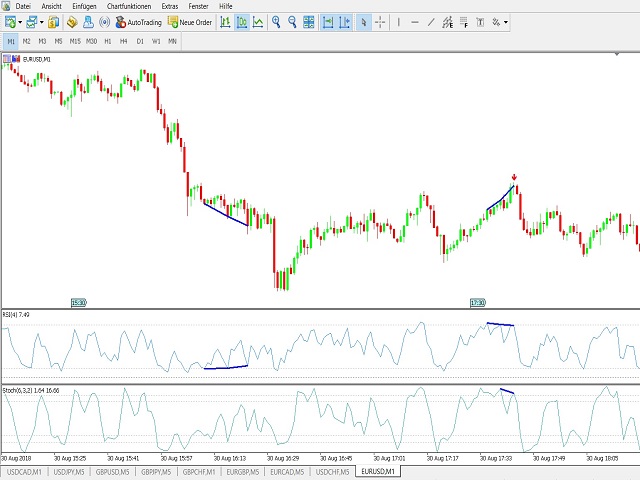
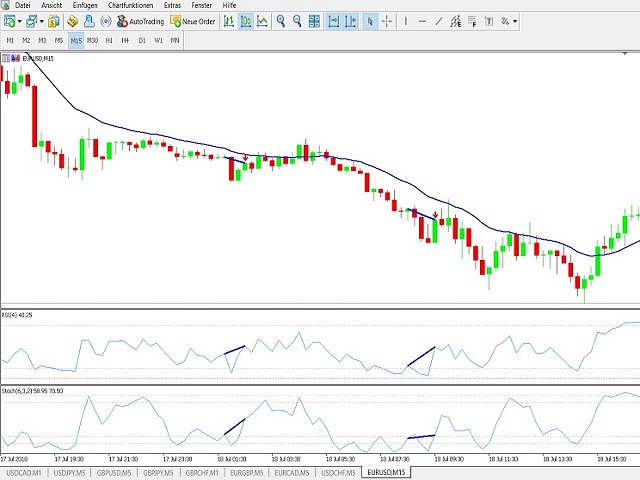
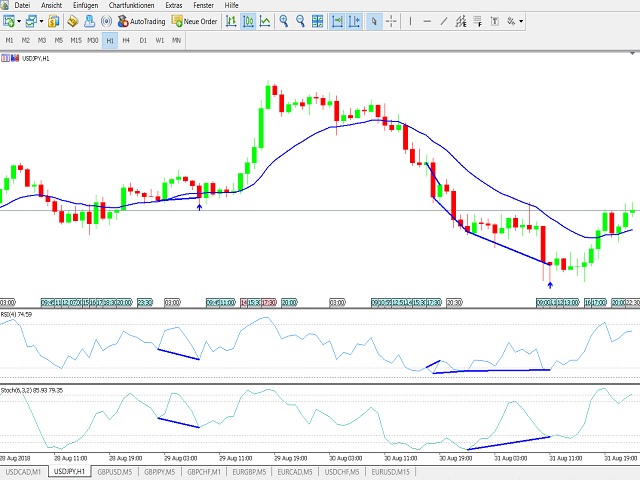
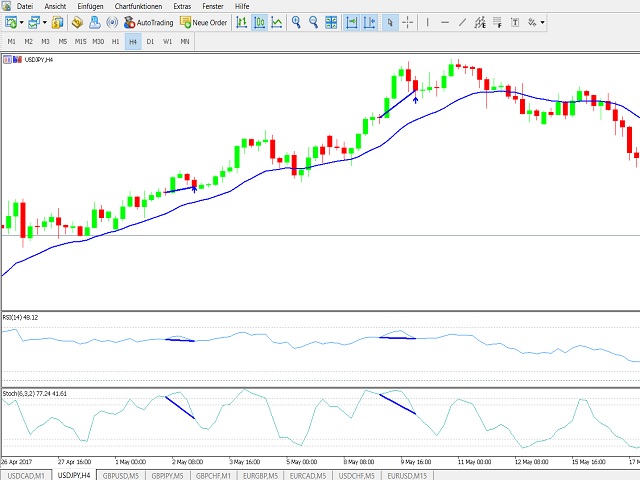
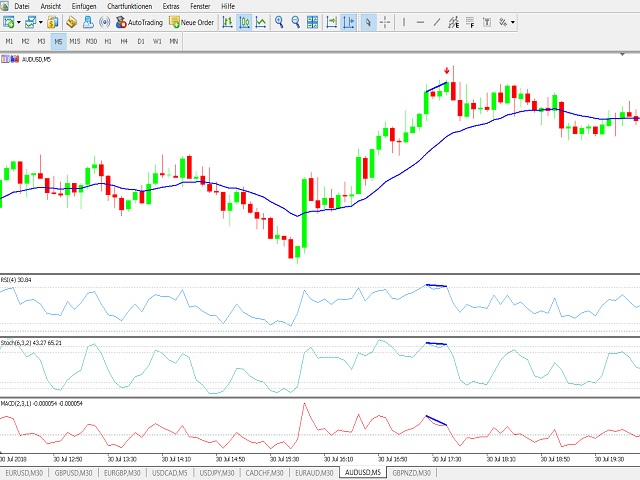
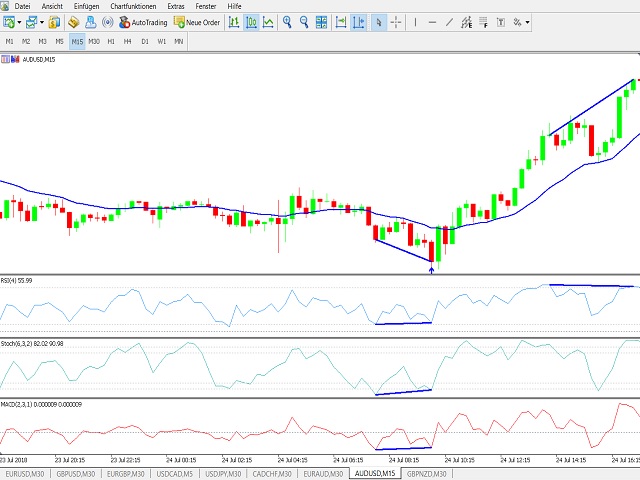
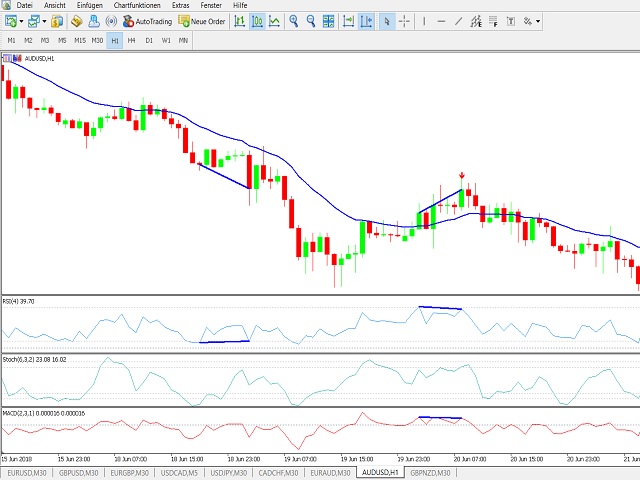
The indicator identifies divergences between chart and RSI, with the possibility of confirmation by stochastics or MACD. A divergence line with an arrow appears on the chart when divergence is detected after the current candle has expired. There are various filter parameters that increase the accuracy of the signals. To identify a divergence, point A must be set in the RSI, then point B Value must be edited, which sets the difference between point A and point B. The indicator can be used for timeframe M1 to H4. In addition, a confirmation time can be activated, in which it is checked after divergence whether the price is going in the right direction.
Key Features
- reglural and hidden divergences
- high accuracy when using the filters
- lines with arrows and alarm
- Filter stochastic and MACD or stochastic + MACD
- Email messages
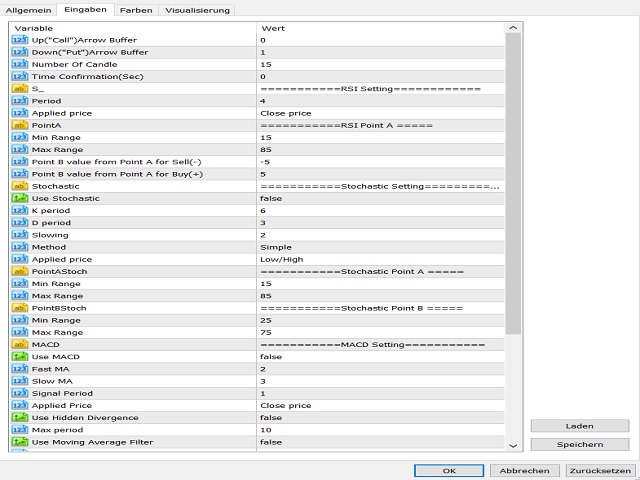
Parameter settings
- Number of Candle
- Time Confirmation (sec)
- RSI Settings: - Period, Applied price
- Point A - MIN range, MAX range
- Point B value from Point A for Sell (-)
- Point B value from Point A for Buy (+)
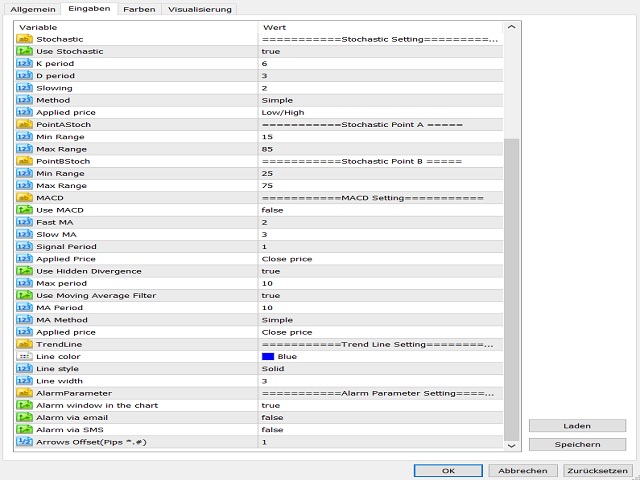
- Stochastics: - K Period, D Period, Slowing, Method, Applied price
- Point A - MIN Rnage, MAX Range - Point B - MIN Range, MAX Range
- MACD - Fast MA, Slow MA, Singanl Period, Applied price
- Hidden Divergence - MAX Period, Filter MA - MA Period, MA Method, Applied price
- general parameters - Line, Color,