• 概要
  • レビュー (1)
  • コメント (5)
  • 最新情報

Stochastics crossover scanner

5

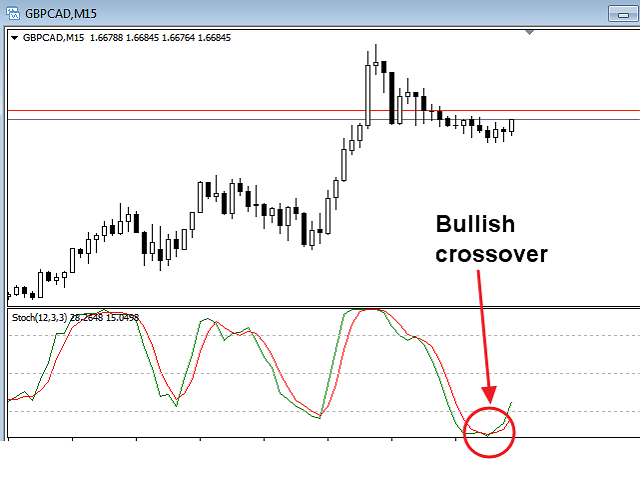
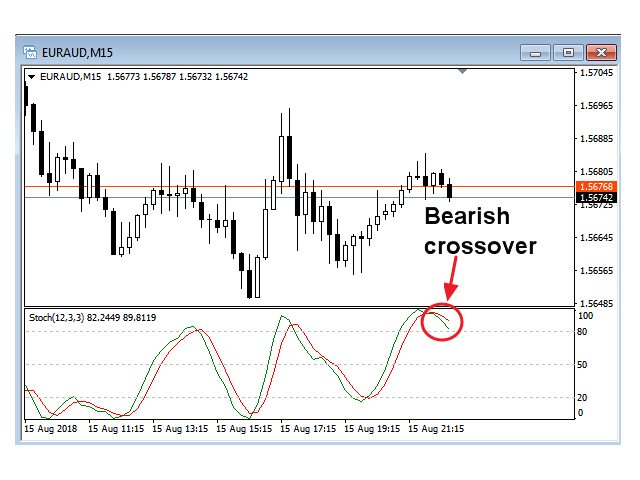
This multi time frame and multi symbol indicator identifies when the stochastics signal line (D) crosses the stochastics main line (K) as well as options to scan for main line and signal line level crossovers. As a bonus it can also scan for Bollinger bands and RSI overbought/oversold crosses. Combined with your own rules and techniques, this indicator will allow you to create (or enhance) your own powerful system.

Features
  • Can monitor all symbols visible in your Market Watch window at the same time. Apply the indicator to just one chart and instantly monitor the entire market.
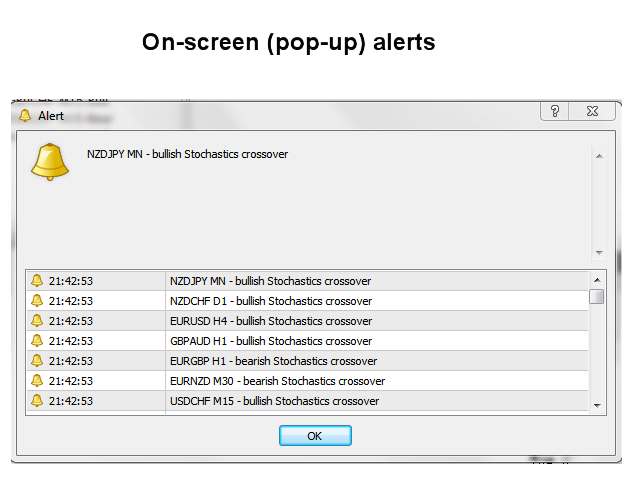
  • Can monitor every time frame, from M1 to MN, and sends you a real-time alert when a crossover has been identified. All Metatrader native alert types are supported.
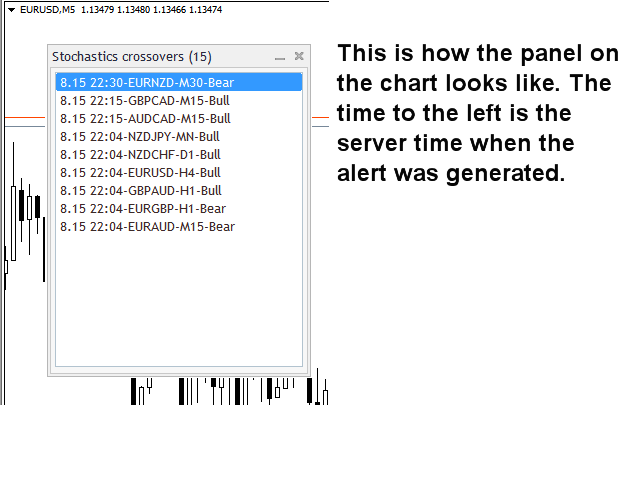
  • The indicator includes an interactive panel. Please see separate screenshot for explanation.
  • The indicator can write the signals to a file which can be used by an Expert Advisor for auto trading.
Input parameters

The description and explanation of the input parameters can be found here.

Important

Please note that due to the multifunctionality neither buy and sell advice nor lines and arrows will be drawn on the chart where the indicator has been installed. Instead the objects will be drawn on the chart which opens up when clicking on a signal in the on chart panel.

It is highly advisable to put the indicator on a clean (empty) chart without any other indicators or Expert Advisors on it which could interfere with the scanner.


レビュー 1
seamo99
157
seamo99 2018.09.13 13:41 
 

Hi Jan, Thankyou for this, its working really well, does exactly as it says on the tin{;

Cheers

おすすめのプロダクト
TrendPlus
Sivakumar Subbaiya
4.21 (14)
Trend Plus   Trendplus  Indicator   Time Frame: Suitable for any time frame.  Purpose: Trend Prediction. Blue and red candle indicate the buy and sell call respectively. Buy: When the blue candle is formed buy call is initiated. close the buy trades when the next red candle will formed.   Sell: When the Red candle is formed Sell call is initiated. close the Sell trades when the next blue candle will formed.   Happy trade!!
FREE
OrderBlock TS Roman
Vladislav Vlastovskii
4 (7)
Индикатор строит блоки заказов (БЗ) по торговой системе (ТС) Романа. Поиск блоков осуществляется одновременно на двух таймфремах: текущем и старшем (определяемым в настройках). Для оптимизации и игнорирования устаревших блоков в настройках задается ограничение количества дней в пределах которых осуществляется поиск блоков. Блоки строятся по правилам ТС состоящем из трех шагов: какую свечу вынесли (что?); какой свечой вынесли (чем?); правило отрисовки (как?).
FREE
MegaTrends
Sivakumar Subbaiya
1 (1)
Megatrends  Indicator   Time Frame: Suitable for any time frame.  Purpose: Trend Prediction. Blue and red color indicate the buy and sell call respectively. Buy: When the blue line is originating it is opened buy call. Sell: When the Red line is origination it is opened sell call Happy trade!! this indicator is suitable for all time frame, but our recommended time frame to use 1hour and 4 hours, suitable for any chart.
FREE
This indicator shows the latest untouched support and resistance as horizontal lines. The indicator can show support/resistance from higher timeframes. With this indicator you can e.g. easily see the support/resistance of the timeframes H4, D1 and W1 on a H1 chart, which can be a big advantage while time your entry on H1. This is the FREE version of the indicator: Support Resistance Multi Time Frame The free version works only on EURUSD and GBPUSD! Parameters referenceTF: the timeframe from wh
FREE
Owl smart levels
Sergey Ermolov
4.63 (54)
MT5版  |   FAQ Owl Smart Levels Indicator   は、 Bill Williams   の高度なフラクタル、市場の正しい波構造を構築する Valable ZigZag、エントリの正確なレベルをマークする Fibonacci レベルなどの一般的な市場分析ツールを含む 1 つのインジケーター内の完全な取引システムです。 利益を得るために市場と場所に。 戦略の詳細な説明 インジケータを操作するための指示 顧問-取引助手 プライベートユーザーチャット ->購入後に私に書いて、私はプライベートチャットにあなたを追加し、あなたはそこにすべてのボーナスをダウンロードすることができます 力はシンプルさにあります! Owl Smart Levels   取引システムは非常に使いやすいので、専門家にも、市場を勉強し始めて自分で取引戦略を選択し始めたばかりの人にも適しています。 戦略と指標に秘密の数式や計算方法が隠されているわけではなく、すべての戦略指標は公開されています。 Owl Smart Levels を使用すると、取引を開始するためのシグナルをすばやく確認し、
[ZhiBiCCI]インディケータは全てのサイクル使用に適しており、そして全ての市場品種にも適しています。 [ZhiBiCCI]緑色の実線は強気の発散の逆転です。緑色の点線は古典的な強気の発散です。 [ZhiBiCCI]赤への実線は逆弱気の発散である。赤い点線は古典的な弱気の発散です。 [ZhiBiCCI]はパラメータ(アラート、メール送信、通知送信)で設定でき、(true)に設定するとインスタント信号をアラームウィンドウに送信し、Eメール、インスタントメッセージを送信できます。 パラメータ設定の説明 [displayAlert]:これはアラームスイッチで、trueに設定され、矢印が表示されればプロンプトに自動的に警告され、falseに設定されれば警告されません。 [sendmail_NO_OFF]:これはメールを送信するためのスイッチで、trueに設定します。矢印が表示されていればMT4で設定したメールボックスにメールを送信し、falseに設定されていればメールを送信しません。 [sendnotification_NO_OFF]:これはインスタントメッセー
The indicator displays the data of the Stochastic oscillator from a higher timeframe on the chart. The main and signal lines are displayed in a separate window. The stepped response is not smoothed. The indicator is useful for practicing "manual" forex trading strategies, which use the data from several screens with different timeframes of a single symbol. The indicator uses the settings that are identical to the standard ones, and a drop-down list for selecting the timeframe. Indicator Parame
The indicator detects and displays Shark harmonic pattern (see the screenshot). The pattern is plotted by the extreme values of the ZigZag indicator (included in the resources, no need to install). After detecting the pattern, the indicator notifies of that by a pop-up window, a mobile notification and an email. The indicator highlights the process of the pattern formation and not just the complete pattern. In the former case, it is displayed in the contour triangles. After the pattern is comple
Free automatic Fibonacci is an indicator that automatically plots a Fibonacci retracement based on the number of bars you select on the BarsToScan setting in the indicator. The Fibonacci is automatically updated in real time as new highest and lowest values appears amongst the selected bars. You can select which level values to be displayed in the indicator settings. You can also select the color of the levels thus enabling the trader to be able to attach the indicator several times with differe
FREE
The indicator shows the potential trend direction by cyclical-wave dependence. Thus, all the rays of the intersection will be optimal rays, in the direction of which the price is expected to move, taking into account the indicator period. Rays can be used as a direction for potential market movement. But we must not forget that the approach must be comprehensive, the indicator signals require additional information to enter the market.
The indicator detects and displays 3 Drives harmonic pattern (see the screenshot). The pattern is plotted by the extreme values of the ZigZag indicator (included in the resources, no need to install). After detecting the pattern, the indicator notifies of that by a pop-up window, a mobile notification and an email. The indicator highlights the process of the pattern formation and not just the complete pattern. In the former case, it is displayed in the contour triangles. After the pattern is com
これは、価格ラベル付きのAdvanced ZigZagDynamic および/または ExtendedFractals インジケーターの極値に基づくサポートおよびレジスタンスレベルのMTFインジケーターです(無効にすることができます)。 MTFモードでは、より高いTFを選択できます。デフォルトでは、レベルはZigZagインジケータードットに基づいて生成されます。フラクタルインジケータードットは、ZigZagと一緒に、またはその代わりに使用することもできます。使用を簡素化し、CPU時間を節約するために、計算はバーの開口部ごとに1回実行されます。 パラメーター: ForcedTF-レベル計算のチャート時間枠(現在の時間枠と等しいか、それを超える場合があります) MinPipsLevelWidth-ポイント単位の最小レベル幅(非常にタイトなレベルに使用) Use ZigZag Extremums points -ZigZagピークを使用してサポート/抵抗レベルを計算することを有効/無効にします Fixed pips range -ジグザグインジケーターを計算するための最小値と最大値の間の距離
VR Cub
Vladimir Pastushak
VR Cub は、質の高いエントリーポイントを獲得するためのインジケーターです。このインジケーターは、数学的計算を容易にし、ポジションへのエントリーポイントの検索を簡素化するために開発されました。このインジケーターが作成されたトレーディング戦略は、長年にわたってその有効性が証明されてきました。取引戦略のシンプルさはその大きな利点であり、初心者のトレーダーでもうまく取引することができます。 VR Cub はポジション開始ポイントとテイクプロフィットとストップロスのターゲットレベルを計算し、効率と使いやすさを大幅に向上させます。取引の簡単なルールを理解するには、以下の戦略を使用した取引のスクリーンショットを見てください。 設定、設定ファイル、デモ版、説明書、問題解決方法は、以下から入手できます。 [ブログ] レビューを読んだり書いたりすることができます。 [リンク] のバージョン [MetaTrader 5] エントリーポイントの計算ルール ポジションをオープンする エントリーポイントを計算するには、VR Cub ツールを最後の高値から最後の安値までストレッチする必要があります。
The indicator displays signals according to the strategy of Bill Williams on the chart. Demo version of the indicator has the same features as the paid, except that it can work only on a demo account . Signal "First Wise Man" is formed when there is a divergent bar with angulation.  Bullish divergent bar - with lower minimum and closing price in the upper half. Bearish divergent bar - higher maximum and the closing price at the bottom half. Angulation is formed when all three lines of Alligat
FREE
Title : UT_Bot - ATR-Based Trading Indicator Introduction : Discover the power of "UT_Bot," the ultimate trading indicator that leverages the Average True Range (ATR) to provide unparalleled accuracy in your trading decisions. If you're seeking a more reliable alternative to the Super Trend indicator, look no further. UT_Bot is your key to precision trading. Key Features : ATR-Powered Precision: UT_Bot uses the ATR to deliver accurate signals that adapt to market volatility. Enhanced Trend Detec
A simple but effective helper that will allow you to track both global and local market trends. The indicator combines the work of two oscillators: Stochastic and RSI. Both indicators can be set to any timeframe. Advantages of Use Multitimeframe - you can adjust both indicators to the desired timeframes. To obtain the entry points, you can use the Elder's triple screen system. Highly customizable - you can configure not only the parameters of the indicators, but also their appearance (color an
FREE
Are you tired of drawing trendlines every time you're analyzing charts? Or perhaps you would like more consistency in your technical analysis. Then this is for you. This indicator will draw trend lines automatically when dropped on a chart. How it works Works similar to standard deviation channel found on mt4 and mt5. It has 2 parameters: 1. Starting Bar 2. Number of bars for calculation The   starting bar   is the bar which drawing of the trend lines will begin, while the   number of bars for c
FREE
The indicator allows you to trade binary options. The recommended time frame is М1 and the expiration time is 1,2,3 minutes. The indicator suitable for auto and manual trading. A possible signal is specified as a arrows above/under a candle. You should wait until the candle closes! Arrows are not re-painted Trade sessions: TOKYO section (Half-end) Currency pairs: USD/JPY Working time frame: M1 Expiration time: 1,2,3 minutes. The indicator also shows good results when using the martingale strateg
FREE
PZ Penta O MT4
PZ TRADING SLU
2.25 (4)
The Penta-O is a 6-point retracement harmonacci pattern which usually precedes big market movements. Penta-O patterns can expand and repaint quite a bit. To make things easier this indicator implements a twist: it waits for a donchian breakout in the right direction before signaling the trade. The end result is an otherwise repainting indicator with a very reliable trading signal. The donchian breakout period is entered as an input. [ Installation Guide | Update Guide | Troubleshooting | FAQ | A
FREE
Power Renko is an indicator which plots Renko bricks underneath the chart using a histogram. You can select the brick size and the timeframe of the Renko bricks as well as whether or not to use the close price or the high/low price of the candles. Renko bricks are based on price alone, not time, therefor the Renko bricks will not be aligned with the chart's time. They are extremely useful for trend trading and many different strategies can be formed from them. Buffers are provided allowing you t
Trend arrow Indicator is an arrow Indicator used as an assistant tool for your trading strategy. The indicator analyzes the standard deviation of bar close for a given period and generates a buy or sell signals if the deviation increases. It good to combo with Martingale EA to follow Trend and Sellect Buy Only/Sell Only for EA work Semi-Automatic. You can use this  Indicator with any EAs in my Products.
FREE
Noize Absorption Index - is the manual trading system that measures the difference of pressure between bears forces and bulls forces. Green line - is a noize free index that showing curent situation. Zero value of index shows totally choppy/flat market.Values above zero level shows how powerfull bullish wave is and values below zero measures bearish forces.Up arrow appears on bearish market when it's ready to reverse, dn arrow appears on weak bullish market, as a result of reverse expectation. S
FREE FOR A LIMITED TIME ONLY!!! The Ultimate Indicator For Trading Trend This indicator clearly shows you the strength of the market in one direction or the other, which means that you can trade knowing you are either with or against the market. When used in conjunction with the +3R principles you are sure to have some serious results. The +3R Principles Routine - This is when you trade and how often  Rules - This is the rule you follow  Risk:Reward - This is the percentage amount of your accoun
FREE
Advanced Trend Regime
Shellard Securities (Pty) Ltd
The indicator has been designed to function on any time-frame and any pair.   This regime filter will help the trader better evaluate whether the current market is trending, and in which direction. It quickly reacts to changes in market dynamics using a series of advanced calculations. The user is able to select whether the calculation remains standard, or if a further filter constraint is added to the calculation.   A Yellow moving average of the signal has been included for the trader to smoot
MT4用外国為替インジケーター「サポートレジスタンスレベル」 インジケーター「サポートレジスタンスレベル」はトレードに非常に役立つ補助インジケーターです 「サポート」と「レジスタンス」は価格によって考慮されるチャート上の重要なゾーンです サポートレベルとは、価格が定期的に下落を止めて反発するレベルです。 レジスタンスレベルとは、通常、価格の上昇が止まり、再び下落する地点です。 インジケーター「サポート抵抗レベル」は、最近のレベルを示します。 抵抗レベル - 赤い線。 サポートレベル - 青い線 計算に使用するバーの数、線の種類、色は設定で調整できます インジケーター「サポートレジスタンスレベル」は、価格アクションパターンによるテイクプロフィットターゲット、価格反転、再テストを計画するのに最適です。 // さらに優れたエキスパートアドバイザーとインジケーターはここから入手できます: https://www.mql5.com/en/users/def1380/seller // また、収益性が高く、安定していて信頼できるシグナル https://www.mql5.com/en/s
MTF Kijun
Kristmundur Roman Zakharii
4 (1)
The indicator plots higher timeframe Kijun-sen (of Ichimoku ) on lower timeframes. To change timeframes, in the timeframe field enter the number: M1    PERIOD_M1 1 1 minute. M5    PERIOD_M5 5 5 minutes. M15  PERIOD_M15 15 15 minutes. M30  PERIOD_M30 30 30 minutes. H1    PERIOD_H1 60 1 hour. H4    PERIOD_H4 240 4 hour. D1    PERIOD_D1 1440 Daily. W1   PERIOD_W1 10080 Weekly. MN1  PERIOD_MN1 43200 Monthly. By default, the Kijun is shifted 3 periods forward but if you wish to have it exactly
トレンドキャッチャー: アラートインジケーター付きのトレンドキャッチャーストラテジーは、市場トレンドやポテンシャルなエントリーポイントやエグジットポイントを特定するのに役立つ多目的な技術分析ツールです。動的なトレンドキャッチャーストラテジーを備えており、市場状況に適応してトレンドの方向を明確に視覚化します。トレーダーは、自身の好みやリスク許容度に合わせてパラメーターをカスタマイズできます。このインジケーターはトレンドの識別を支援し、ポテンシャルなリバーサルをシグナルし、トレイリングストップのメカニズムとして機能し、市場への迅速な対応のためのリアルタイムアラートを提供します。 特徴: - トレンドの識別:上昇トレンドと下降トレンドをシグナルします。 - トレンドのリバーサル:ローソク足の色が上昇から下降に変わった場合やその逆の場合に、ポテンシャルなリバーサルを警告します。 - リアルタイムアラート:新しいトレンドの識別に対するアラートを生成します。 推奨事項: - 通貨ペア:EURUSD、AUDUSD、XAUUSDなど... - タイムフレーム:H1。 - アカウン
FREE
Support and Resistance Channels
Hossam Mohamed Abdelsalam Ahmed Abdelsalam
Support and Resistance technical indicator for mt4 that identifies the Strong support and resistance levels based on  Zigzag indicator with full control of Zigzag indicator setting , selectable Timeframes  as well as  SRL lines formats . Inputs: - Time frame. ----------------- Zigzag setting: ------------------ - Depth. - Deviation. - Backstep. -------------------- Peaks and valleys setting: - Min peaks gap in Points. // to be considered as a new level. - Peak sensitivity. // min no. of peaks
Indikator zur klaren Anzeige im Metatrader Dieser Indikator wurde von mir Entwickelt damit die Anzeige der relevanten Parameter klar und deutlich im Chart auf einen Blick zu sehen ist.  Er dient zur Information und ist ohne Gewähr.  Folgende Parameter werden angezeigt: -   Der  Aktuelle Kurs - Das Aktuelle Handelspaar - Die Restzeit zur nächsten Kerzenbildung / Zum Abschluss der Aktuellen Kerze - Die Kontonummer des Handelskontos - Die Frei Verfügbare Margin - Die Margin auf 1 Lot - Der Akt
FREE
''Trendlines'' is an Indicator, that every Trader need and shows Trendline and  Support and resistance levels in all  Timeframe's. Also In 1-hour, 4-hour and daily time frames and Current timeframes, support, and resistance levels are specified and trend lines are drawn so that the trader can see all levels on a chart.   In   Properties   it is possible to turn off unnecessary Lines.  In ' Tendency indicator '' , as full package of Predictions that every Trader need, there  is also the Predic
このプロダクトを購入した人は以下も購入しています
Gann Made Easy は、ミスター・ギャンの理論を使用した取引の最良の原則に基づいた、プロフェッショナルで使いやすい外国為替取引システムです。 W・D・ガン。このインジケーターは、ストップロスとテイクプロフィットレベルを含む正確な買いと売りのシグナルを提供します。 PUSH通知を利用して外出先でも取引可能です。 購入後はご連絡ください!私の取引のヒントと素晴らしいボーナスインジケーターを無料で共有します! おそらく、ギャンの取引手法についてはすでに何度も聞いたことがあるでしょう。通常、ギャンの理論は初心者のトレーダーだけでなく、すでにある程度の取引経験がある人にとっても非常に複雑なものです。なぜなら、ギャンの取引手法は理論的にはそれほど簡単に適用できるものではないからです。私はその知識を磨き、最良の原則を私の外国為替インジケーターに組み込むために数年を費やしました。 このインジケーターは非常に簡単に適用できます。必要なのは、それをチャートに添付し、簡単な取引推奨事項に従うだけです。このインジケーターは常に市場分析の仕事を行い、取引の機会を探します。適切なエントリーポイントを検出
まず第一に、この取引インジケーターは再描画されず、再描画されず、遅延しないことを強調する価値があります。これにより、手動取引とロボット取引の両方に理想的なものになります。 アトミックアナリストは、価格の強さとモメンタムを利用して市場でより良いエッジを見つけるためのPA価格アクションインジケーターです。ノイズや誤ったシグナルを除去し、取引ポテンシャルを高めるための高度なフィルターを備えています。複雑なインジケーターの複数のレイヤーを使用して、アトミックアナリストはチャートをスキャンし、複雑な数学的計算をシンプルなシグナルと色に変換します。これにより、どのような初心者トレーダーでも理解して使用し、一貫した取引の決定を行うことができます。 「アトミックアナリスト」は、新規および経験豊富なトレーダー向けにカスタマイズされた包括的な取引ソリューションです。プレミアムインジケーターとトップノッチの機能を1つの取引戦略に組み合わせ、すべてのタイプのトレーダーにとって汎用性のある選択肢にします。 デイリートレーディングとスキャルピング戦略:高速で正確なデイトレーディングおよび短期トレード
現在26%オフ 初心者やエキスパートトレーダーに最適なソリューション! このインジケーターは、独自の機能と新しい計算式を取り入れた、ユニークで高品質、かつ手頃な価格のトレーディングツールです。たった1枚のチャートで28の為替ペアの通貨強度を読み取ることができます。新しいトレンドやスキャルピングチャンスの引き金となるポイントを正確に特定することができるので、あなたのトレードがどのように改善されるか想像してみてください。 ユーザーマニュアルはこちら  https://www.mql5.com/en/blogs/post/697384 これが最初の1本、オリジナルだ! 価値のないクローンを買わないでください。 特別な サブウィンドウの矢印で強い通貨の勢いを表示 GAPがあなたのトレードを導く! 基準通貨や気配値が売られすぎ・買われすぎのゾーン(外相フィボナッチレベル)にあるとき、個別チャートのメインウィンドウに警告表示。 通貨がレンジの外側から反落した場合、プルバック/リバーサルのアラート。 クロスパターンの特別なアラート 複数の時間枠を選択可能で、トレンドを素早く
Scalper Vault は、スキャルピングを成功させるために必要なすべてを提供するプロフェッショナルなスキャルピング システムです。このインジケーターは、外国為替およびバイナリー オプションのトレーダーが使用できる完全な取引システムです。推奨される時間枠は M5 です。 システムは、トレンドの方向に正確な矢印シグナルを提供します。また、トップとボトムのシグナルとギャン マーケット レベルも提供します。 インジケーターは、プッシュ通知を含むすべてのタイプのアラートを提供します。 インジケータの購入後にご連絡ください。私の個人的な取引の推奨事項と素晴らしいボーナス指標を無料で共有します! 幸せで有益な取引をお祈りします!
Trend Screener
STE S.S.COMPANY
4.83 (86)
トレンドインジケーター、1つのツールに組み込まれたすべての重要なトレンド機能を備えたトレンドトレーディングとフィルタリングのための画期的なユニークなソリューション! これは、すべてのシンボル/商品(外国為替、商品、暗号通貨、インデックス、株式)で使用できる100%再描画されていないマルチタイムフレームおよびマルチ通貨インジケーターです。 トレンドスクリーナーは、チャート内のドットで矢印トレンドシグナルを提供するインジケーターに続く効率的なインジケーターです。 トレンド分析インジケーターで使用できる機能: 1.トレンドスキャナー。 2.最大利益分析を備えたトレンドライン。 3.トレンド通貨強度メーター。 4.アラート付きのトレンド反転ドット。 5.アラート付きの強いトレンドドット。 6.トレンド矢印 毎日の分析例、毎日のシグナルパフォーマンス...など、トレンドスクリーナーインジケーターを使用して、ここで見つけることができます: ここをクリックしてください 期間限定オファー:トレンドスクリーナーインジケーターは、50ドルと生涯でのみご利用いただけます。 (元の価格125 $) MQ
TPSpro TRENDPRO  - is a trend indicator that automatically analyzes the market and provides information about the trend and each of its changes, as well as giving signals for entering trades without redrawing! The indicator uses each candle, analyzing them separately. referring to different impulses - up or down impulse. Exact entry points into transactions for currencies, crypto, metals, stocks, indices!  -  Version MT5               DETAILED DESCRIPTION        /       TRADING SETUPS           
ご紹介   クォンタム トレンド スナイパー インジケーターは 、トレンド反転を特定して取引する方法を変革する画期的な MQL5 インジケーターです。 13年以上の取引経験を持つ経験豊富なトレーダーのチームによって開発されました。     クォンタムトレンドスナイパーインジケーター   は、非常に高い精度でトレンドの反転を識別する革新的な方法で、あなたのトレーディングの旅を新たな高みに押し上げるように設計されています。 ***Quantum Trend Sniper Indicatorを購入すると、Quantum Breakout Indicatorを無料で入手できます!*** クォンタム ブレイクアウト インジケーターは、トレンドの反転を特定するとアラートを発し、矢印を示し、3 つのテイクプロフィットレベルを提案します。 初心者トレーダーにもプロのトレーダーにも適しています。 量子EAチャネル:       ここをクリック MT5のバージョン:       ここをクリック 推奨事項: 期間: すべての時間枠。最良の結果を得るには、
まず第一に、この取引ツールはノンリペイント、ノンリドロー、ノンラグの指標であり、プロの取引に理想的ですことを強調する価値があります。 スマートプライスアクションコンセプトインジケーターは、新米から経験豊富なトレーダーまで、非常 に強力なツールです。Inner Circle Trader AnalysisやSmart Money Concepts Trading Strategiesなど、20以上の有用な指標を1つに組み合わせています。このインジケーターはスマートマネーコンセプトに焦点を当て、大手機関の取引方法を提供し、彼らの動きを予測するのに役立ちます。 特に、流動性分析に優れており、機関がどのように取引しているかを理解しやすくしています。市場のトレンドを予測し、価格の動きを慎重に分析するのに優れています。機関の戦略とトレードを合わせることで、市場の動向についてより正確な予測ができます。このインジケーターは多目的であり、市場構造を分析し、重要な注文ブロックを特定し、さまざまなパターンを認識するのに優れています。 このインジケーターはBOSやCHoCHなどのパターンの識
ブレーカートレーダーになり、価格が反転すると市場構造からの利益が変化します。 注文ブロックブレーカーインジケーターは、トレンドまたは価格の動きが枯渇に近づいており、逆転の準備ができていることを識別します。通常、反転または大規模なプルバックが発生しようとしているときに発生する市場構造の変化について警告します。 この指標は、ブレイクアウトと価格の勢いを識別する独自の計算を使用します。使い果たされる可能性のあるポイントの近くで新しい高値が形成されるたびに、インディケーターはその高値の作成を担当する最後の注文ブロックを描きます。次に、移動する価格とともに注文ブロックを追跡します。その後、価格が反対方向にシフトし、その注文ブロックを突破すると、新しい市場構造を作成し、トレンドまたは大きな後退の可能性のある反転の開始を警告します。 注文ブロックは、高値/安値が作成される前の最後の反対色のろうそくであり、価格がこれらの重要な領域を下抜けすると、トレンドの短期的ま​​たは長期的な反転の兆候です。 特徴 重要な枯渇点での市場構造の変化を警告します 価格が使い果たされるレベルに近づくと、
SALE NOW! Limited Time Offer! An exclusive indicator that utilizes an innovative algorithm to swiftly and accurately determine the market trend. The indicator automatically calculates opening, closing, and profit levels, providing detailed trading statistics. With these features, you can choose the most appropriate trading instrument for the current market conditions. Additionally, you can easily integrate your own arrow indicators into Scalper Inside Pro to quickly evaluate their statistics and
Advanced Supply Demand
Bernhard Schweigert
4.92 (310)
現在33%オフ 初心者にもエキスパートトレーダーにも最適なソリューション このインジケーターは独自の機能と新しい公式を多数内蔵しており、ユニークで高品質かつ手頃な取引ツールです。このアップデートでは、2つの時間枠ゾーンを表示できるようになります。より長いTFだけでなく、チャートTFとより長いTF(ネストゾーンを表示)の両方を表示できます。すべてのSupply Demandトレーダーの皆さんのお気に召すはずです。:) 重要情報の公開 Advanced Supply Demandの可能性を最大化するには、 https://www.mql5.com/ja/blogs/post/720245 にアクセスしてください。   エントリーまたはターゲットの正確なトリガーポイントを正確に特定できれば取引がどのように改善されるか想像してみてください。新しい基盤となるアルゴリズムに基づいて構築されているため、買い手と売り手の間の潜在的な不均衡をさらに簡単に特定できます。これは、最も強い需要と供給のゾーンと、過去のパフォーマンス(古いゾーンを表示)がグラフィカルに表現されるためです。これらの機能は、最適
A key element in trading is zones or levels from which decisions to buy or sell a trading instrument are made. Despite attempts by major players to conceal their presence in the market, they inevitably leave traces. Our task was to learn how to identify these traces and interpret them correctly. Reversal First Impulse levels (RFI)   -  Version MT5                INSTRUCTIONS                 RUS                 ENG                                       R ecommended to use with an indicator   -  
カスタムMT4インジケーターで外国為替取引を成功させるための秘密を発見してください! 外国為替市場で成功を達成し、リスクを最小限に抑えながら一貫して利益を得る方法を疑問に思ったことはありますか? これがあなたが探している答えです! 取引へのアプローチに革命をもたらす独自のMT4インジケーターを導入できるようにします。 ユニークな汎用性 私たちのインジケータは、RenkoとRangeBarのろうそくのフォーメーションを好むユーザー向けに特別に設計されています。 これらのチャートタイプは多くの経験豊富なトレーダーに好まれていることを理解しています。そのため、私たちのインジケーターはそれらとシームレスに統合され、比類のない市場分析を提供します。 クリアトレンドシグナル 複雑な分析を忘れてください! 私たちのインジケーターは、鮮やかな色と明確なドット構造を利用して、市場の動向を明確に示しています。 赤と青の点は、価格の動きの方向性について疑いの余地がなく、取引の迅速な意思決定を可能にします。 HH/HL HL/LL戦略とのアライメント HH/HLおよびHL/LL構
TrendMaestro
Stefano Frisetti
5 (2)
note: this indicator is for METATRADER4, if you want the version for METATRADER5 this is the link: TRENDMAESTRO recognizes a new TREND in the bud, he never makes mistakes. The certainty of identifying a new TREND is priceless. DESCRIPTION TRENDMAESTRO identifies a new TREND in the bud, this indicator examines the volatility, volumes and momentum to identify the moment in which there is an explosion of one or more of these data and therefore the moment in which prices have strong probability of f
現在20%OFF! 初心者やエキスパートトレーダーのためのベストソリューション! このダッシュボードソフトウェアは、28の通貨ペアで動作しています。それは私達の主要な指標(高度な通貨の強さ28と高度な通貨インパルス)の2に基づいています。それは全体の外国為替市場の大きい概観を与えます。それは、すべての(9)時間枠で28の外国為替ペアのための高度な通貨の強さの値、通貨の動きの速度と信号を示しています。チャート上で1つのインディケータを使用して市場全体を観察し、トレンドやスキャルピングの機会をピンポイントで見つけることができたら、あなたのトレードがどのように改善されるか想像してみてください。 このインディケータには、強い通貨と弱い通貨の識別、潜在的な取引の識別と確認がより簡単になるような機能が搭載されています。このインディケータは、通貨の強さや弱さが増加しているか減少しているか、また、すべての時間枠でどのように機能しているかをグラフィカルに表示します。 新機能として、現在の市場環境の変化に適応するダイナミックなマーケットフィボナッチレベルが追加され、すでに当社のAdvan
驚異的なFXインジケーター「Miraculous」をご紹介します。完璧な結果を得るための1時間足を含むすべてのタイムフレームで効果的に機能する、最強の強力な特殊MT4フォレックスインジケーターです。 すべてのタイムフレームで優れた結果を提供する最高のFXインジケーターを探し続けるのに疲れましたか?これ以上探す必要はありません!「Miraculous」フォレックスインジケーターをご紹介します。このインジケーターは、トレーディングの経験を変革し、収益を新たなレベルに引き上げるために設計されました。 先進のテクノロジーと長年にわたる緻密な開発に基づいて構築された「Miraculous」フォレックスインジケーターは、FX市場における力と正確さの頂点となります。この素晴らしいツールは、すべてのレベルのトレーダーのニーズを満たすように設計されており、一貫した収益性を追求する上で比類のない優位性を提供します。 「Miraculous」フォレックスインジケーターの他との違いは、その非常に適応性にあります。デイトレーダー、スウィングトレーダーであろうと、長期ポジションを好む方であろうと、このインジケータ
複数通貨と複数フレームの売買に関するアラート。 自動トレーリングストップとリスク報酬で利益を獲得! インジケーターが市場をスキャンして分析するため、何もする必要はありません。 1 つのチャートですべての通貨を取引しましょう!   購入後、コメントを残して私に連絡してください。トレードアシスタントEAをお送りします。 このインジケーターはいくつかのオシレーターと付属のフィルターを使用して、最良の確認されたエントリーポイントを見つけますので、それについて心配する必要はありません。 警告が表示され、監視することを選択したすべての時間枠と通貨のボタンが描画されます。 ボタンを押すだけでチャートに移動し、取引を開始できます。 このインジケーターは、すべての基本通貨と市場監視通貨の強さパネルも描画します (設定で調整可能)。これにより、すべてのペアの通貨と選択されたより高い時間枠が表示されます。 インジケーターウィンドウ: チャート通貨のトレンドフィルターとマルチタイムフレームトレンドパネルを備えた特別なMACDヒストグラム! すべての通貨と時間枠の取引アラートを提供し、
これはMT4のインジケーターで、再描画なしで取引に参入するための正確なシグナルを提供します。 外国為替、暗号通貨、金属、株式、インデックスなど、あらゆる金融資産に適用できます。かなり正確な見積もりを提供し、取引を開始して終了するのに最適な時期を教えてくれます。1つのシグナルを処理しただけでインジケーターの元が取れた例の 動画 (6:22)をご覧ください。Entry PointsPro インジケーターの助けを借りたほとんどのトレーダーの最初の1週間の結果が改善しています。 Telegramグループ に登録してください。Entry Points Proインジケーターのメリットは次の通りです。 再描画のないエントリーシグナル 再描画されるインジケーターでは一度表示されたシグナルが削除されて大きな金銭的損失につながることがありますが、これと異なり、表示されて確認されたシグナルは消えることがありません。 エラーなしの取引開始 インジケーターアルゴリズムによって取引を開始する(資産を売買する)理想的な瞬間を見つけることができます。それを使用するすべてのトレーダーの成功率が向上します。
This indicator is unstoppable when combined with our other indicator called Katana. After purchase, send us a message and you could get Katana for FREE as a BONUS After purchase, send us a private message for your instructions.  MT5 version: click here 40 copies available at $55. There are 3 copies left before the next price of $105. Don't miss this great deal!  The Trend Forecasting indicator is a very unique & easy tool that is able to make prediction about future price movement
ご紹介     Quantum Breakout PRO は 、ブレイクアウト ゾーンの取引方法を変革する画期的な MQL5 インジケーターです。 13年以上の取引経験を持つ経験豊富なトレーダーのチームによって開発された Quantum Breakout PROは 、革新的でダイナミックなブレイクアウトゾーン戦略により、あなたの取引の旅を新たな高みに押し上げるように設計されています。 クォンタム ブレイクアウト インジケーターは、5 つの利益ターゲット ゾーンを備えたブレイクアウト ゾーン上のシグナル矢印と、ブレイクアウト ボックスに基づいたストップロスの提案を提供します。 初心者トレーダーにもプロのトレーダーにも適しています。 量子EAチャネル:       ここをクリック MT5バージョン:   ここをクリック 重要!購入後、インストールマニュアルを受け取るためにプライベートメッセージを送ってください。 推奨事項: 時間枠: M15 通貨ペア: GBPJPY、EURJPY、USDJPY、NZDUSD、XAUUSD アカウントの種類: ECN、Raw、また
PRO Renko Systemは、特別にRENKOチャートを取引するために設計された高精度の取引システムです。 これは、様々な取引商品に適用することができる普遍的なシステムです。 システムは効果的に正確な逆転信号へのアクセスを与えるいわゆる市場の騒音を中和する。 表示器は非常に使いやすく、信号の生成に責任がある1つの変数だけがあります。 あなたは簡単にお好みの任意の取引ツールとレンコバーのサイズにツールを適応させることができます。 私はいつもあなたが私のソフトウェアで収益性の高い取引を支援するために余分なサポートを提供する準備ができています! 私はあなたに幸せで収益性の高い取引をしたいです! ご購入後にご連絡ください! 私はあなたに私のレンコチャートジェネレータを送信します。 私はまた、私の個人的な推奨事項やシステムの他のモジュールを無料で共有します!
mql5と Telegramの モーニング・ブリーフィングで、詳細とスクリーンショットを含む毎日のマーケット・アップデートをご覧 ください! FX Power MT4 NGは 、長年の人気を誇る通貨強度計FX Powerの次世代モデルです。 この次世代ストレングスメーターは何を提供するのでしょうか?初代FXパワーの魅力すべて プラス GOLD/XAUの強さ分析 より正確な計算結果 個別に設定可能な分析期間 カスタマイズ可能な計算上限値により、さらに優れたパフォーマンスを実現 もっと見たい人のための特別なマルチインスタンス設定 すべてのチャートでお好みの色を無限に設定可能 数え切れないほどの通知オプションにより、重要なことを見逃すことはありません。 Windows 11とmacOSのスタイルで角を丸くした新しいデザイン 魔法のように動くインジケーターパネル FXパワーの主な機能 すべての主要通貨の強さの完全な履歴 すべての時間枠における通貨の強さの履歴 すべてのブローカーとチャートで同一の計算結果 100%信頼できるリアルタイム計算 -> リペイントなし ドロップダウン・リストから
Break & Retest is unstoppable when combined with our other divergence indicator. After purchase, send us a message and you could get this  2nd indicator  for  FREE  as a  BONUS! ‍You can visually backtest Break & Retest to see how it behaved in the past!    Manual guide:   Click here $59  for the first 25 copies ( 7  left)! Next price is $120 .  After many months of hard work and dedication, we are extremely proud to present you our  Break and Retest price action indicator crea
現在31%オフ! 初心者やエキスパートトレーダーに最適なソリューション! このインジケータは、独自の機能と秘密の数式を組み込んだ、ユニークで高品質かつ手頃な価格のトレーディングツールです。たった1枚のチャートで28の通貨ペアのアラートを表示します。新しいトレンドやスキャルピングチャンスの引き金となるポイントを正確に把握することができるので、あなたのトレードがどのように改善されるか想像してみてください! 新しい基本的なアルゴリズムに基づいて構築されているため、潜在的な取引の特定と確認がより簡単になります。これは、通貨の強さや弱さが加速しているかどうかをグラフィカルに表示し、その加速のスピードを測定するためです。加速すると物事は明らかに速く進みますが、これはFX市場でも同じです。つまり、反対方向に加速している通貨をペアにすれば、利益を生む可能性のある取引を特定することができるのです。 通貨の勢いを示す縦の線と矢印は、あなたの取引の指針となるでしょう。 ダイナミックマーケットフィボナッチ23レベルはアラートトリガーとして使用され、市場の動きに適応します。もしインパルスが黄色
TrendDecoder Premium
Christophe, Pa Trouillas
5 (3)
レンジと次の動きを特定    |  トレンドの最も早いシグナルと強さを得る   |  反転の前に明確な出口を得る   |  価格がテストするフィボ・レベルを見つける。 非リペイント、非遅延インディケータ - マニュアルおよび自動売買に最適 - すべての資産、すべての時間単位に対応 期間限定キャンペーン   >> 50%OFF 購入後、 推奨セッティングについては、このチャンネルで私に連絡してください。 MT5 バージョン: ここをクリック BladeSCALPER   と   PowerZONES   を使った完全な方法を入手する どのようなものですか? TrendDECODERは、トレンド監視をシンプルかつ簡単にするための複数のイノベーションを集約したものです。 Projective TrendLine (投影トレンドライン) - 今後のトレンドのスピードリファレンス。 RealTime TrendLine vs. Projective TrendLine (リアルタイムトレンドライン vs. Projective TrendLine) - 市場が同じ方
ADR反転インジケーターは、通常の1日の平均レンジに関連して価格が現在取引されている場所を一目で示します。価格が選択した平均範囲とレベルを超えると、ポップアップ、電子メール、またはプッシュを介して即座にアラートを受け取るため、プルバックと逆転にすばやくジャンプできます。インディケータは、チャート上に1日の平均レンジの極値で水平線を描画し、それらを超える価格の数学的確率が付加されているレベルを超える延長も描画します。詳細については、以下をご覧ください... インジケーターとモニターを補完するADRアラートダッシュボードここでも利用可能なすべてのペア:https:// www.mql5.com/en/market/product/62756 MT5バージョンはこちらからも入手できます:https:// www.mql5.com/en/market/product/64477/ 通常の1日平均レンジ(ADR)内で価格が取引され、これらのレベルを上回っている時間の約60%は、通常、その後の引き戻し(利益確定)の動きを伴う急激な価格の動きの指標です。毎日の範囲の上部または下部からの
通貨強さウィザードは、取引を成功させるためのオールインワン ソリューションを提供する非常に強力な指標です。このインジケーターは、複数の時間枠のすべての通貨のデータを使用して、このまたはその外国為替ペアのパワーを計算します。このデータは、使いやすい通貨インデックスと通貨パワーラインの形式で表され、特定の通貨のパワーを確認するために使用できます。 必要なのは、取引したいチャートにインジケーターを接続することだけです。インジケーターは、取引する通貨の実際の強さを示します。このインジケーターは、トレンドに合わせて取引するときに有利に利用できる売買高の圧力の極値も示します。このインジケーターには、フィボナッチに基づく可能なターゲットも表示されます。 このインジケーターは、PUSH 通知を含むあらゆるタイプのアラートを提供します。 購入後ご連絡下さい。私の取引のヒントをあなたと共有し、素晴らしいボーナスインジケーターを無料で提供します! 幸せで有益な取引をお祈りします。
このインジケータは、手動および自動的な方法でチャートに描かれたハーモニックパターンを検出します。ユーザーマニュアルは、このリンクから参照できます: あなたのレビューを追加し、入手するために私たちに連絡してください。 この製品をmt4で試すための無料版があります。 GartleyおよびNenstarパターンを検出するために使用できます。 https://www.mql5.com/en/market/product/30181 完全なMT4バージョンを購入するには、次の場所から購入できます。 https://www.mql5.com/en/market/product/15212 注 インジケータにはコントロールパネルがあり、すべての(チャート&時間枠)設定が保存されます。チャート上でスペースをより多く確保するために、最小化することができ、他の分析ツールで作業する場合は、すべてのインジケータデータを非表示にするために閉じるボタンを押すことができます。 このインジケータを使用して設定を変更し、移動平均やボリンジャーバンドなどのインジケータを追加すると、編集のテンプレートが自動的に保存され、必
FX Volume
Daniel Stein
4.6 (35)
mql5と Telegramの モーニング・ブリーフィングで、詳細とスクリーンショットを含む毎日のマーケット・アップデートをご覧 ください! FX Volumeは、ブローカーの視点から市場のセンチメントをリアルに洞察する、最初で唯一の出来高インジケーターです。 ブローカーのような機関投資家が外国為替市場でどのようなポジションをとっているか、COTレポートよりもはるかに速く、素晴らしい洞察を提供します。 この情報をチャート上で直接見ることは、あなたの取引にとって真のゲームチェンジャーであり、画期的なソリューションです。 以下のようなユニークなマーケットデータ洞察から利益を得てください。 比率は 、通貨のロングポジションとショートポジションの比率をパーセントで表示します。 比率の変化は 、選択した期間内のロング比率とその変化率を表示します。 Volumes Totalは 、通貨の取引量(ロングとショート)の合計をロット単位で表示します。 Volumes Long :全通貨のロングポジションの取引量を表示します。 Volumes(ショート )は、全通貨のショートポジションの取引量を表示
まず最初に、このトレーディングシステムがリペイントされず、再描画されず、遅延しないことを強調する価値があります。これにより、プロのトレーディングに最適な状態になります。 「スマートサポートアンドレジスタンストレーディングシステム」は、新規および経験豊富なトレーダー向けにカスタマイズされた高度なインジケーターです。この包括的なシステムは、7以上の戦略、10のインジケーター、およびデイトレード戦略、スイングトレード戦略、サポートおよびレジスタンス戦略、ローソク足パターン戦略、VWAP戦略、マルチタイムフレームトレンド戦略など、さまざまなトレーディングアプローチを組み合わせています。これは、矢印信号、エントリーポイント、出口ポイント、トレードアラート、より高い時間枠のトレンド分析、リアルタイムのトレードモニタリング、そして洞察力のあるトレンドとボリュームキャンドルの着色を提供します。自動的なサポートとレジスタンスの検出により、さまざまな市況下でトレーダーが的確な決定を下すのを支援する多面的なインジケーターとなっています。 スマートサポートアンドレジスタンストレーディングシステムは、
作者のその他のプロダクト
を読むことをお勧めします     製品のブログ (マニュアル) 最初から最後まで     EA が提供するものは最初から明らかです。 このエキスパートアドバイザー (EA) の主な戦略は、3 つの移動平均 (MA) が連続して整列し、互いに一定の距離にある場合に取引を行うことです (たとえば、一部の機関投資家が使用するあまり知られていない戦略に使用できます)。 、これには D1 時間枠の MA 10、20、および 30 が含まれます)。 EA は、H1 以降の時間枠で最適に機能します。トリプル MA 戦略 (使用される MA: に関係なく) は、長期的な戦略と見なす必要があります。悪い月が続くかもしれません。したがって、この EA は、頻繁な取引と短期的な一定の利益を求めるトレーダー向けではありません。デフォルト設定は EURUSD H1 用に最適化されています (2015.01.01 から 2022.12.29 までのバックテスト、224 回の取引、つまり週平均 0.52 回の取引)。   ここで 信号を監視します (D1 時間枠に異なる設定を使用)。 また、2 MA:s の通常の
このマルチタイムフレームとマルチシンボルインジケーターは、次の5つのクロスを識別できます。 動きの速い平均が動きの遅い平均線と交差するとき。 価格が単一の移動平均に達したとき(上/下で閉じているか、ちょうど跳ね返った)。 三重移動平均フォーメーションが出現したとき(3つのMAすべてが連続して整列) MACDメインラインがシグナルラインと交差するとき。 信号線がMACDzero(0)線と交差するとき。 このインジケーターを独自のルールや手法と組み合わせると、独自の強力なシステムを作成(または強化)できます。 特徴 マーケットウォッチウィンドウに表示されている選択したシンボルを同時に監視できます。インジケーターを1つのチャートに適用し、市場全体を即座に監視します。 M1からMNまでのすべての時間枠を監視でき、クロスオーバーが識別されたときにリアルタイムのアラートを送信します。すべてのアラートタイプがサポートされています。 追加のトレンドフィルターとしてRSIを使用できます。 インジケータには、インタラクティブパネルが含まれています。アイテムをクリックすると、問題のシンボルと時間枠で新しいチ
I recommend you to read the   product's blog  (manual) from start to end so that it is clear from the beginning what the indicactor offers. This multi time frame and multi symbol indicator identifies double or triple top/bottom formations or a following neckline breakout (confirmed top/bottom). It offers filters for RSI overbought/oversold, candle patterns (pin bar, engulfing, tweezer, morning/evening star, three line strike) and divergences (MACD, OsMA, Awesome (AO), RSI, CCI, Stochastic) whic
I recommend you to read the   product's blog  (manual) from start to end so that it is clear from the beginning what the indicactor offers. This multi time frame and multi symbol divergence dashboard indicator sends an alert when one or two different divergences have been identified. It can be used with all time frames from M1 to MN. It is possible to enable moving average or RSI trend filter to filter out only the strongest setups. Combined with your own rules and techniques, this indicator wi
The indicator identifies when a divergence occurs between price and an indicator or oscillator. It identifies both regular and hidden divergences. Combined with your own rules and techniques, this indicator will allow you to create (or enhance) your own powerful system. Features Can detect divergences for the following oscillators/indicators:   MACD, OsMA, Stochastics, RSI, CCI, RVI, Awesome, ADX, ATR, OBV, Composite index, MFI and Momentum. Only one oscillator/indicator can be selected. Draws
FREE
I recommend you to read the   product's blog  (manual) from start to end so that it is clear from the beginning what the indicactor offers. This multi time frame and multi symbol divergence dashboard indicator sends an alert when one or two different divergences have been identified. It can be used with all time frames from M1 to MN. Maximum 9 time frames can be shown in the dashboard at the same time. It is possible to enable moving average, RSI or Bollinger bands trend filter to filter out on
この需給ゾーンインジケーターはチャート上にゾーンを描画し、価格がゾーンに到達またはゾーンを超えたときにアラートを送信します。ゾーンの代わりに、通常のダブルトップ/ボトムについてアラートを受け取るために使用することもできます。 RSI、ADX、ボリューム、および発散フィルターを使用して、最も強力なセットアップのみをフィルターで除外することができます。独自のルールとテクニックを組み合わせることで、このインジケーターを使用して、独自の強力なシステムを作成(または強化)できます。この指標は、需要と供給にすでに精通している経験豊富なトレーダー向けであり、取引を終了または開始することを決定する際にどのように使用できるかを示しています。 特徴 次の分岐がサポートされています。       MACD、OsMA、RSI、CCI、確率論的および素晴らしい。 ゾーンには3色があります(入力で調整可能)。テストされていないゾーンの場合は暗い色、テストされたゾーンの場合は中程度、壊れたゾーンの場合は明るい色。 ゾーンの外側の境界線の価格とゾーンテストの量は、各ゾーンで書き込まれます。 インディケータは、エキ
I recommend you to read the   product's blog  (manual) from start to end so that it is clear from the beginning what the indicactor offers. This multi time frame and multi symbol trend indicator sends an alert when a strong trend or trend reversal has been identified. It can do so by selecting to build up the dashboard using Moving average (single or double (both MA:s aligned and price above/below both)), RSI, Bollinger bands, ADX, Composite index (Constance M. Brown), Awesome (Bill Williams), 
This multi time frame and multi symbol indicator scans for pin bars. Combined with your own rules and techniques, this indicator will allow you to create (or enhance) your own powerful system. Features Can monitor all symbols visible in your Market Watch window at the same time. Apply the indicator to just one chart and instantly monitor the entire market. Can monitors every time frame, from M1 to MN, and sends you a real-time alert when a pin bar is identified. All Metatrader native alert types
I  recommend you to read the   product's blog  (manual) from start to end so that it is clear from the beginning what the indicator offers. This multi time frame and multi symbol indicator identifies double top/bottom, head & shoulders, pennant/triangle and flag patterns. It is also possible to setup alerts only when a neckline/triangle/flagpole breakout has occured (neckline breakout = confirmed signal for top/bottoms and head & shoulders).  The indicator can also be used in single chart mode.
Please if possible consider the  paid version  which I will continue to develop (there will be no future updates for this free version). This Expert Advisor identifies when a divergence occurs between price and an oscillator/indicator. It identifies both regular/classical (trend reversal) and hidden (trend continuation) divergences. It has RSI, bollinger, stochastics, moving average and ADX filter options which makes it possible to filter out only the strongest setups. The default settings ar
FREE
強気と弱気のスリーラインストライクフォーメーションを見つけることに加えて、このマルチシンボルとマルチタイムフレームインジケーターは、次のローソク足パターンをスキャンすることもできます(パターンの説明についてはスクリーンショットを参照してください)。 3人の白人兵士(逆転>継続パターン) 3つの黒いカラス(反転>継続パターン) インジケーター設定の厳密なオプションが有効になっている場合、フォーメーションはより高い時間枠ではあまり頻繁に表示されません。しかし、そうする場合、それは非常に確率の高い設定です。 Thomas Bulkowski(国際的に有名な作家であり、ローソク足パターンの第一人者)によると、3ラインストライクはローソク足パターンの中で最高の全体的なパフォーマンスランクを持っています。このインジケーターを独自のルールや手法と組み合わせると、独自の強力なシステムを作成(または強化)できます。 特徴 マーケットウォッチウィンドウに表示されているすべてのシンボルを同時に監視できます。インジケーターを1つのチャートに適用し、市場全体を即座に監視します。 M1からMNまでのすべての時間枠
This indicator can send alerts when a Heiken Ashi Smoothed color change occurs. Combined with your own rules and techniques, this indicator will allow you to create (or enhance) your own powerful system. Features Can send all types of alerts. Option to delay the alert one or more bars in order to confirm the color (trend) change. Input parameters Candle shift for alert: Default is 1. Setting it to 0 will alert you on color change on the current candle. This should be regarded as a pending (uncon
FREE
This cost averaging Expert advisor (EA) places additional trades in the same direction as the original (manually opened) order when the price goes against you. It can be used as a grid system or as pure martingale system (exponential increasing of lot size) or smoothed martingale (for instance linear increasing of the lot size). Due to the risk involved, this EA is more suitable for intermediate to advanced traders who are well aware of how to handle risk management and trading an already profit
This indicator can send alerts when a Heiken Ashi Smoothed color change occurs. Combined with your own rules and techniques, this indicator will allow you to create (or enhance) your own powerful system. Features Can send all types of alerts. Option to delay the alert one bar in order to confirm the color (trend) change. Input parameters Wait for candle close: 'true' or 'false'. Setting it to 'true' will delay the alert to the opening of the bar following the bar where the color change occurred.
FREE
EA が何を提供するのかを最初から明確にするために、   製品のブログ (マニュアル) を最初から最後まで読むことをお勧めします。 このエキスパートアドバイザーは、価格とオシレーター/インジケーターの間に乖離が発生する時期を特定します。これは、通常/古典的な (トレンド反転) ダイバージェンスと隠れた (トレンド継続) ダイバージェンスの両方を識別します。需要/供給ゾーン、RSI、ボリンジャー、ストキャスティクス、移動平均 (通常の MA およびハル MA)、ADX、およびボリューム フィルター オプションがあり、最も強力なセットアップのみを除外することができます。デフォルト設定は EURUSD H1 に最適化されています (以下のスクリーンショットを参照してください)。 EA には、1 つのチャートから複数のシンボルを取引する可能性があります。このオプションは 4 つの異なる方法で使用できます。 [気配値表示] ウィンドウに表示されているすべてのシンボル 入力パラメータで指定される記号 ダイアログボックスで選択したプリセットファイルのシンボル 事前定義されたフォルダー内のプリセッ
The indicator identifies when a divergence occurs between price and an indicator or oscillator. It identifies bullish and bearish hidden or regular (classical) divergences. Combined with your own rules and techniques, this indicator will allow you to create (or enhance) your own powerful system. Features Can detect divergences for the following indicators/oscillators: MACD, OsMA (Moving average of Oscillator), Stochastics, RSI, CCI, RVI, Awesome (AO), ADX, ATR, OBV, MFI, Momentum and   Composi
FREE
このマルチタイムフレームとマルチシンボルインジケーターは、ダブルトップ/ボトム、ヘッド&ショルダー、ペナント/トライアングル、フラグパターンを識別します。ネックライン/トライアングル/旗竿のブレイクアウトが発生した場合にのみアラートを設定することもできます(ネックラインブレイクアウト=上下および頭と肩の確認された信号)。     インジケーターはシングルチャートモードでも使用できます。このオプションの詳細については、製品の     ブログ 。独自のルールとテクニックを組み合わせることで、このインジケーターを使用して、独自の強力なシステムを作成(または強化)できます。 特徴 マーケットウォッチウィンドウに表示されているすべてのシンボルを同時に監視できます。インジケーターを1つのチャートに適用し、市場全体を即座に監視します。 M1からMNまでのすべての時間枠を監視でき、パターンが識別されたとき、またはブレイクアウト時にリアルタイムのアラートを送信します。すべてのMetatraderネイティブアラートタイプがサポートされています。 RSIをトレンドフィルターとして使用して、潜在的な反転を
I recommend you to read the   product's blog  (manual) from start to end so that it is clear from the beginning what the indicactor offers. This multi time frame and multi symbol indicator identifies double or triple top/bottom formations or a following neckline breakout (confirmed top/bottom). It offers RSI, pin bar, engulfing, tweezer, morning/evening star filters as well divergence filter options which makes it possible to filter out only the strongest setups. The indicator can also be used
This indicator recognizes a special type of Inside Bar formation which is formed by a big Master candle followed by 4 smaller candles (please see the strategy explanation below). Features Plots buy/sell stop lines on the chart as well as well as take profit and stop loss levels. The TP/SL levels are based on the Average True Range (ATR) indicator. Object colors are changeable. Sends you a real-time alert when a Master candle formation is identified - sound / popup / email / push notification. On
I recommend you to read the   product's blog  (manual) from start to end so that it is clear from the beginning what the indicactor offers. This multi time frame and multi symbol supply and demand zone dashboard indicator sends alerts when the price has reached a supply/demand zone. It is also possible to use it to be alerted about regular double tops/bottoms instead of zones. It can be used with all time frames from M1 to MN. It is possible to use RSI, divergence (MACD, OsMA, RSI or Awesome) a
I recommend you to read the  product's blog  (manual) from start to end so that it is clear from the beginning what the indicator offers. This multi time frame and multi symbol supply and demand zone dashboard indicator sends alerts when the price has reached a supply/demand zone. It is also possible to use it to be alerted about regular double tops/bottoms instead of zones. It can be used with all time frames from M1 to MN. Maximum 9 time frames can be shown in the dashboard at the same time. 
インディケータは、価格とオシレーター/インディケーターの間に発散が発生したときを識別します。これは、通常の分岐と隠れた分岐の両方を識別します。最強のセットアップのみをフィルターで除外できるRSIフィルターオプションがあります。インディケータは、巻き込みフォーメーション、ドンチアンチャネルブレイクアウト、または移動平均を超える価格を待つオプションも提供します (スクリーンショット#3を参照)     貿易機会を知らせる前に発散を確認する。独自のルールとテクニックを組み合わせることで、このインジケーターを使用して、独自の強力なシステムを作成(または強化)できます。 特徴 の終わりに     製品のブログ   インジケーターからトレードシグナルを取得するためにiCustom()関数を使用しているサンプルエキスパートアドバイザー(EA)のソースコードをダウンロードすることができます。 EAは完全に機能しますが、主な目的は、コードを使用して、独自に開発したEAに貼り付けることです。 限られた時間で   ただし、プログラミングサポートを提供することはできません。 謝罪いたします 次のオシレータ
I recommend you to read the   product's blog  (manual) from start to end so that it is clear from the beginning what the indicactor offers. This multi time frame and multi symbol indicator can identify the following 5 crosses: when a fast moving average crosses a slow moving average line. when price has reached a single moving average (closed above/below or just bounced). when a triple moving average formation has appeared (all 3 MA:s in consecutive alignment). when the MACD main line crosses t
可能であれば購入をご検討ください   私が開発を続ける MT5 バージョン (この MT4 バージョンの今後の更新はありません)。こちらもお読みになることをお勧めします     製品のブログ (マニュアル) を最初から最後まで参照して、EA が提供するものを最初から明確にします。 このエキスパートアドバイザー (EA) の主な戦略は、3 つの移動平均 (MA) が連続して整列し、互いに一定の距離にある場合に取引を行うことです (たとえば、一部の機関投資家が使用するあまり知られていない戦略に使用できます)。 、これには D1 時間枠の MA 10、20、および 30 が含まれます)。 EA は、H1 以降の時間枠で最適に機能します。トリプル MA 戦略 (使用される MA: に関係なく) は、長期的な戦略と見なす必要があります。悪い月が続くかもしれません。したがって、この EA は、頻繁な取引と短期的な一定の利益を求めるトレーダー向けではありません。デフォルト設定は EURUSD H1 用に最適化されています (2015.01.01 から 2022.03.31 までのバックテスト、22
このマルチタイムフレームとマルチシンボルインジケーターは、ピンバー、朝/夕方の星、巻き込み、ピンセット、スリーラインストライク、インサイドバー、ペナントとトライアングルをスキャンします。 インジケーターはシングルチャートモードでも使用できます。このオプションの詳細については、製品の     ブログ 。     独自のルールとテクニックを組み合わせることで、このインジケーターを使用して、独自の強力なシステムを作成(または強化)できます。 特徴 マーケットウォッチウィンドウに表示されているすべてのシンボルを同時に監視できます。インジケーターを1つのチャートに適用し、市場全体を即座に監視します。 M1からMNまでのすべての時間枠を監視し、パターンが識別されるとリアルタイムのアラート(ポップアップ、プッシュ、またはメール)を送信します。 RSIとボリンジャーバンドをピンバー、朝/夕方の星 、巻き込み、ピンセットの形成の フィルターとして使用して、潜在的な逆転を適切に特定できます。 主要なトレンドフィルターとして移動平均を使用し、ボラティリティフィルターとしてADXを使用できます。 インジケー
このマルチタイムフレームとマルチシンボルインジケーターは、ピンバー、朝/夕方の星、巻き込み、ピンセット、3つのラインストライク、内側のバー、ペナントと三角形をスキャンします。インジケーターはシングルチャートモードでも使用できます。このオプションの詳細については、製品の     ブログ 。独自のルールとテクニックを組み合わせることで、このインジケーターを使用して、独自の強力なシステムを作成(または強化)できます。 特徴 マーケットウォッチウィンドウに表示されているすべてのシンボルを同時に監視できます。インジケーターを1つのチャートに適用し、市場全体を即座に監視します。 M1からMNまでのすべての時間枠を監視し、パターンが識別されるとリアルタイムのアラート(ポップアップ、プッシュ、またはメール)を送信します。 潜在的な逆転を適切に特定するために、ピンバー、朝/夕方の星、巻き込み、ピンセットの形成のフィルターとしてRSIとボリンジャーバンドを使用できます。 主要なトレンドフィルターとして移動平均を使用し 、ボラティリティフィルターとしてADXを使用できます。 インジケーターにはインタラクテ
This multi indicator/oscillator (hereafter indicator), multi time frame and multi symbol indicator identifies when a divergence occurs between price and one, two or three indicators. It identifies both regular/classical (trend reversal) and hidden (trend continuation) divergences. It has RSI and MA trend filter options which makes it possible to filter out only the strongest setups. Combined with your own rules and techniques, this indicator will allow you to create (or enhance) your own powerfu
This multi time frame and multi symbol indicator identifies fractals patterns. As a bonus it can also scan for Parabolic SAR (pSAR) trend changes. Combined with your own rules and techniques, this indicator will allow you to create (or enhance) your own powerful system. Features Can monitor all symbols visible in your Market Watch window at the same time. Apply the indicator to just one chart and instantly monitor the entire market. Can monitor every time frame, from M1 to MN, and sends you a
フィルタ:
seamo99
157
seamo99 2018.09.13 13:41 
 

Hi Jan, Thankyou for this, its working really well, does exactly as it says on the tin{;

Cheers

レビューに返信
バージョン 1.6 2024.04.04
*** IMPORTANT - please always make a backup of the existing indicator (the .ex4 file) before you make an update ***

Change log:
- new additional input for symbols
- added an option to write the signals as global variables which can be used by an Expert Advisor
- added the possibility to set the colors, item height and font size in the panel
バージョン 1.5 2022.08.10
*** IMPORTANT - please always make a backup of the existing indicator (the .ex4 file) before you make an update ***

- added the possibility to scan for K (main line) and D (signal line) level crossovers
バージョン 1.4 2021.06.14
- added an arrow to the chart which can be opened from the panel. This arrow will point out the cross and the trade direction.
バージョン 1.3 2021.01.29
- corrected an issue with information written to the .csv file
バージョン 1.2 2020.09.28
- added a possibility to enable scanning for Bollinger bands and/or RSI overbought/oversold crosses
- added the possibility to enable a moving average trend filter
バージョン 1.1 2020.09.16
- added the possibility to write the signals in the panel to a file. Could for instance be used by an Expert Advisor for automatical trading. For instance this product: https://www.mql5.com/en/market/product/43512
- added an option to scan symbols visible in the Market Watch window instead of using the internal parameter for symbols
- added a Smiley in the upper right corner of the chart which is indicating that the indicator is up and running properly
- added the possibility to set a custom alert text for alerts (not in the panel). The custom text will be added to the end of the regular alert text
- added the possibility to set a custom panel title