Custom Pivots
- インディケータ
- Tsvetan Tsvetanov
- バージョン: 1.1
- アップデート済み: 14 11月 2017
- アクティベーション: 8
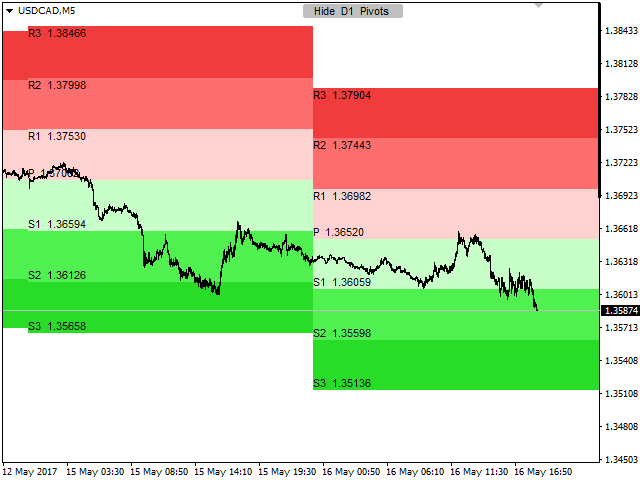
Pivots Points are significant levels traders can use to determine directional movement, support and resistance. Pivot Points use the prior period's high, low and close to formulate future support and resistance. In this regard, Pivot Points are predictive and leading indicators.
Pivot Points were originally used by floor traders to set key levels. Floor traders are the original day traders. They deal in a very fast moving environment with a short-term focus. At the beginning of the trading day, floor traders would look at the previous day's high, low and close to calculate a Pivot Point for the current trading day. With this Pivot Point as the base, further calculations were used to set support 1, support 2, resistance 1 and resistance 2. These levels would then be used to assist their trading throughout the day.
Pivot Points are one of the simplest and oldest tools for technical analysis. Today traders from all over the world successfully incorporate Pivot Points in their strategies. However, this popular professional tool is not included by default in MetaTrader 4. That's why I decided to create good and affordable Pivot Points indicator for MetaTrader 4. This indicator offers wide range of options for personal customization.
Main features
- Multiple types of calculation for the levels.
- Automatic vertical scaling of the chart with adjustable scaling ratio.
- Adjustable time frames.
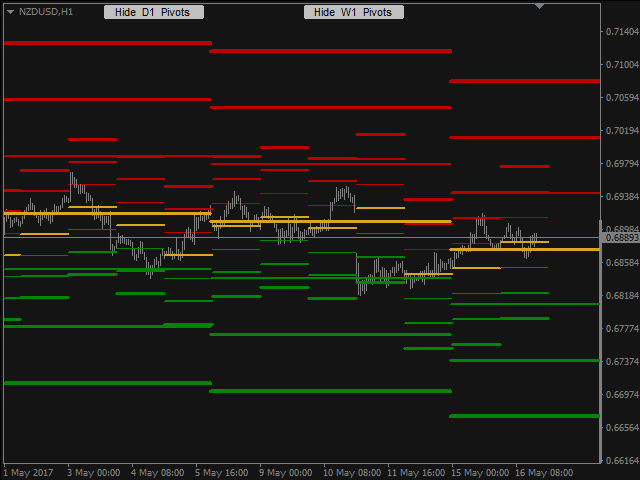
- Ability to use multiple instances with different settings on the same chart.
- Extensive options for visual customization.
- Push notifications.
- Quick button to temporarily hide or show the indicator.
- The indicator works in the strategy tester.
In short, this is one of the best Pivot Points indicators available for MetaTrader 4. Simple professional tool which deserves to be in your toolbox.
Indicator settings
- Push_Notifications - enable/disable.
- Magic_ID - if you want to display 2 or more indicator instances on the same chart you have to set different id for each instance.
- Hide_by_Default - hide or show the indicator by default.
- Button_X, Button_Y - position of the button.
- Button_Color.
- Button_Text_Color.
- Chart_Auto_Scale - enables/disables the automatic vertical chart scale.
- Chart_Auto_Scale_Multiplier - ratio for the vertical chart scale.
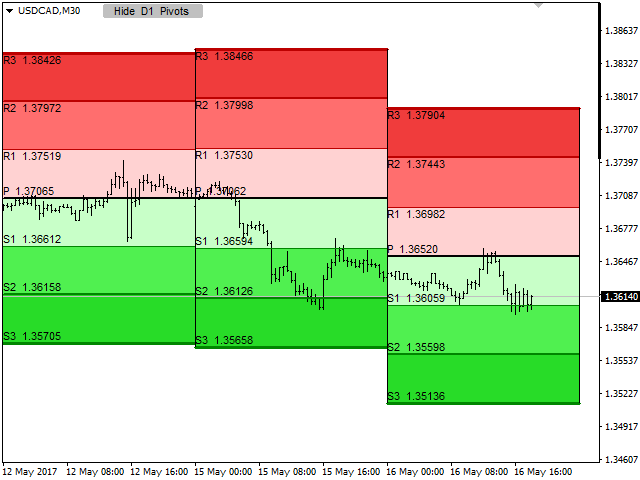
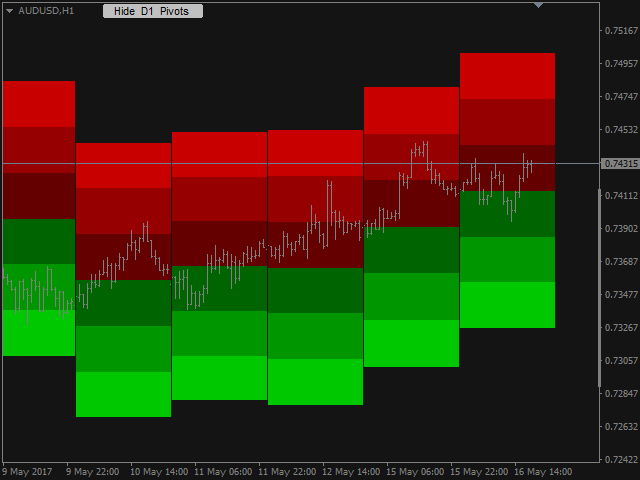
- Number_of_Periods - number of periods on which to draw pivot points. 1 means only the current period.
- Time_Frame - time frame for the calculation of the indicator. You can set any time frame from M5 to Monthly.
- Type - Select the type of calculation for the levels.
- Standard - the classic formula.
- Fibonacci - Fibonacci formula.
- ATR - the Average True Range (20) is used for the calculation of the levels. For example R1=P+ATR*0.5; R2=P+ATR*1; R3=P+ATR*1.5;
- Fixed - you can set fixed distances for the levels. The values are in points!
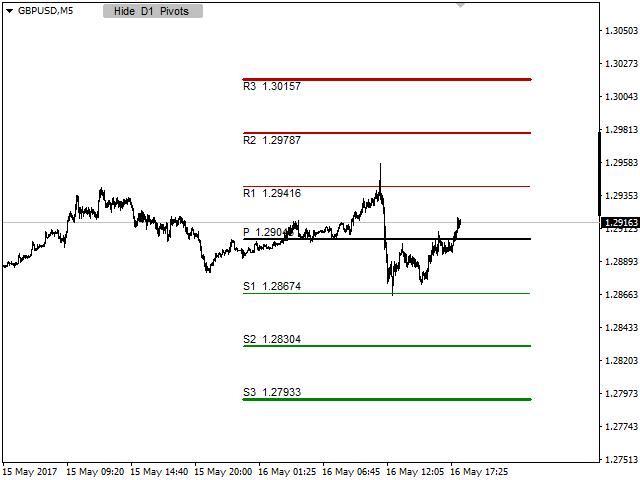
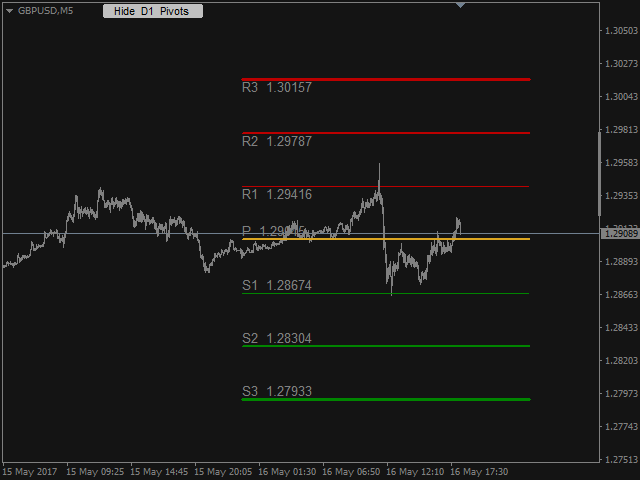
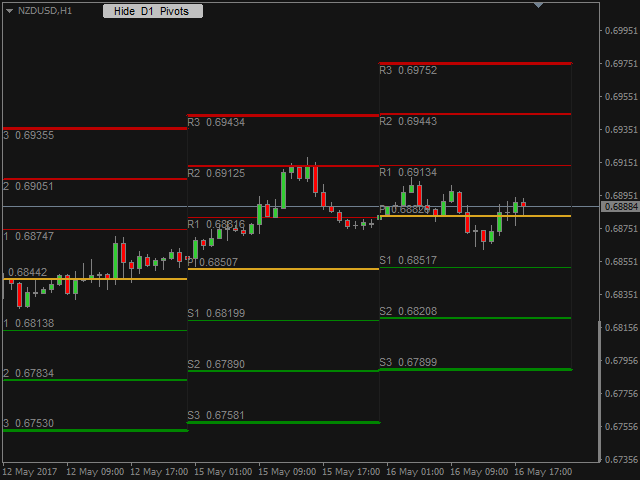
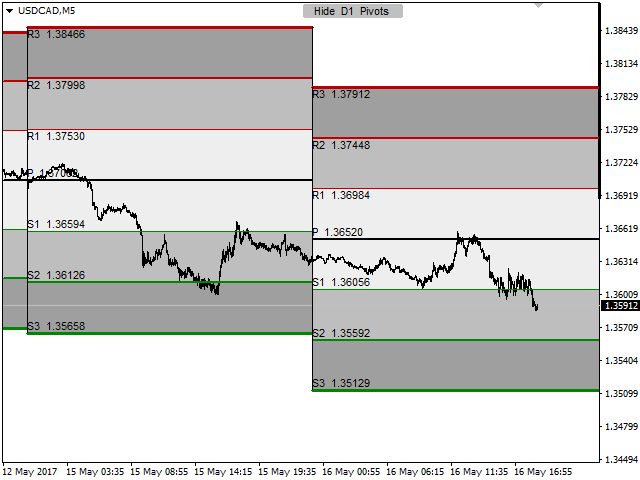
- Show_Pivot_Levels - enables/disables the horizontal levels.
- Colors of the levels.
- Width of the levels.
- Show_Period_Separators - enables/disables the vertical separators.
- Color of the separators.
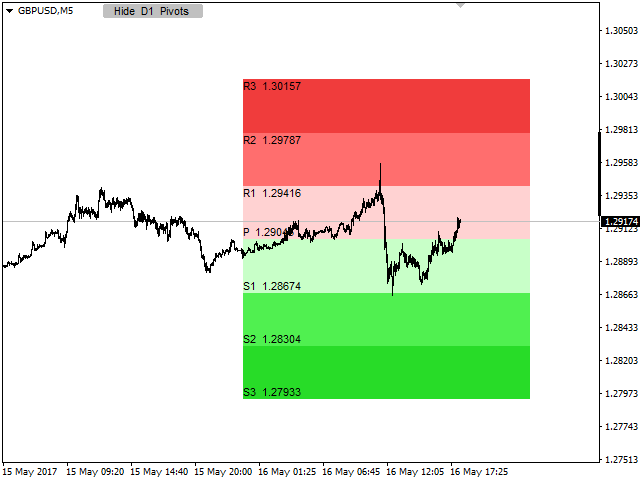
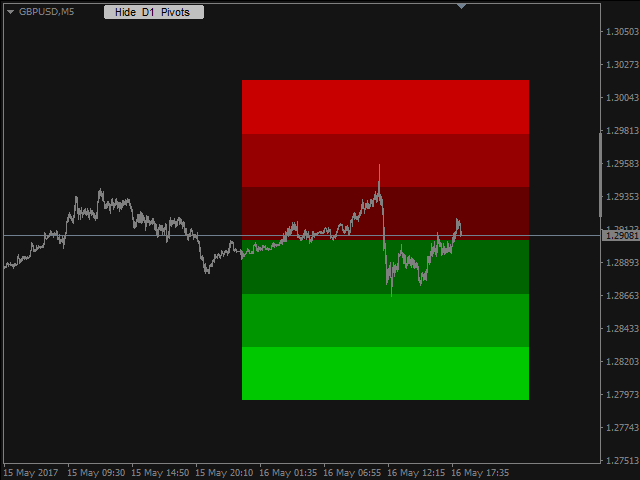
- Show_Color_Shades - enables/disables the shaded areas between the levels.
- Colors of the shades.
- Show_Text_Info - enables/disables the text.
- Font.
- Font_Size.
- Font_Color.


Amazing indicator. Better than any pivot indicators out there. I love that you can use intraday with it. I wish it would alert you when specific levels were hit.