OHLC Indicator by PipTick MT4
- インディケータ
- Michal Jurnik
- バージョン: 1.3
- アップデート済み: 1 12月 2021
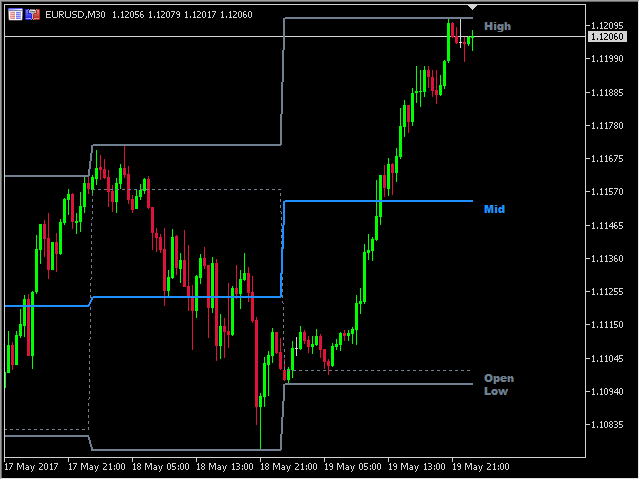
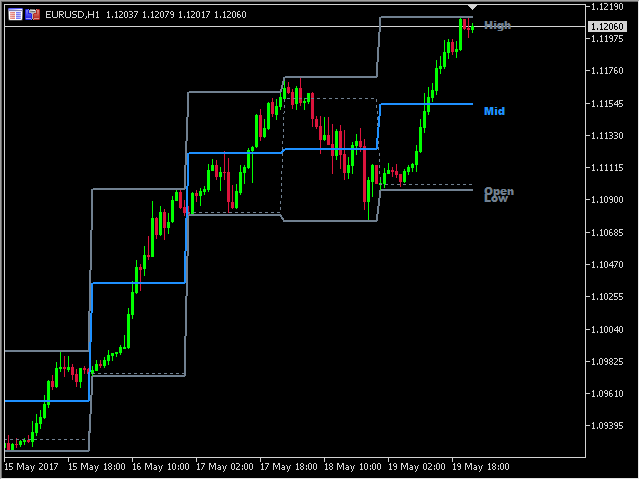
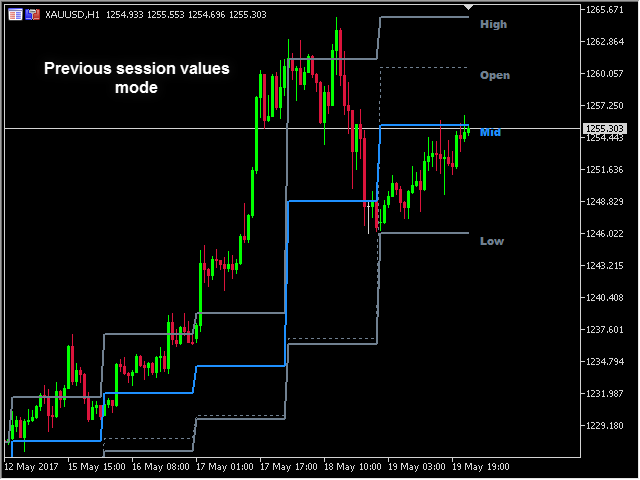
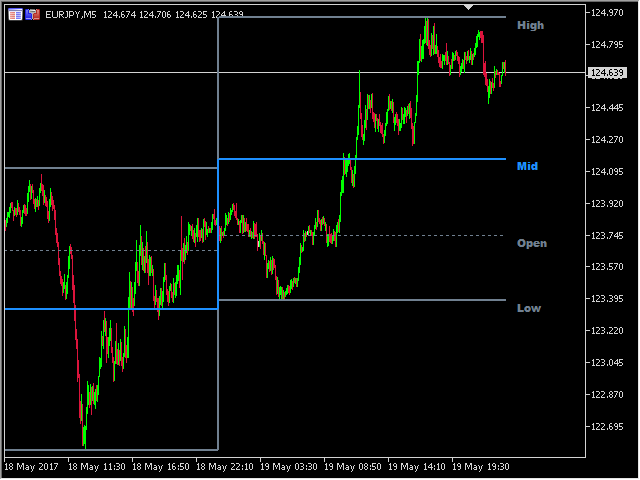
The OHLC indicator shows the current and historical values of High, Low, Open, Close and Mid for a specific time period. It can plot the current values or the values from the previous session. The indicator's range can be calculated from a daily, weekly, monthly, or user-specified session.
Levels
- High of the current or previous session.
- Low of the current or previous session.
- Open of current or previous session.
- Close of the current or previous session.
- Midpoint of the current or previous session.
Recommendations
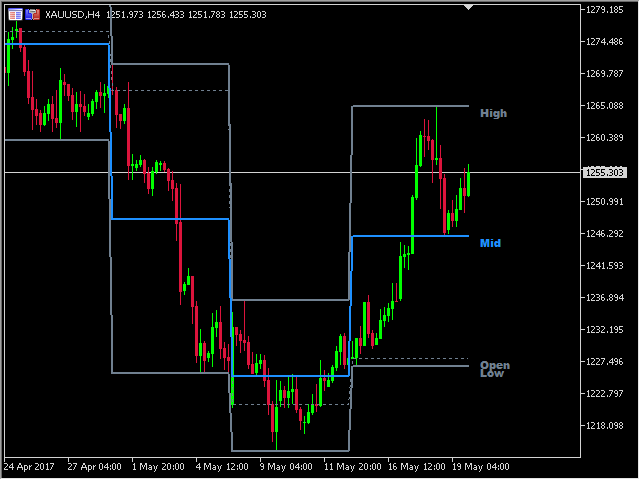
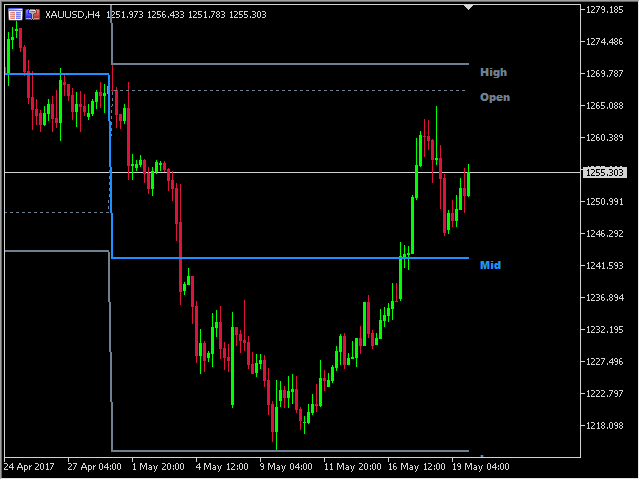
- Using previous session values of High, Low, Close and Mid is beneficial for support and resistance levels. It tends to work very well.
Main features
- The indicator shows the actual levels of High, Low, Open, Close and mid.
- Current or previous session values.
- Alert notifications for indicator lines.
- Custom session time.
- Works on every timeframe (M1, M5, M15, M30, H1, H4, D1, W1, MN).
- The indicator is non-repainting.
- Ready for backtesting.
- Customizable parameters (Colors, Line thickness, Visibility...).
- High-speed calculation.
- Available for MT4 and MT5.
Please visit the OHLC indicator product page for the input and output parameters settings.


Really good auto adjusting OHLC indicator, showing traders whether the markets are working the high or low of the previous day. Recommended as very helpful.