Candle Timer MT5 Indicator by PipTick
- ユーティリティ
- Michal Jurnik
- バージョン: 1.3
- アップデート済み: 11 10月 2023
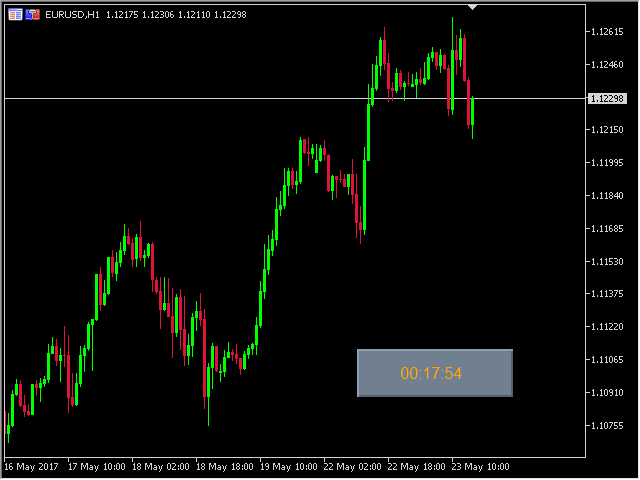
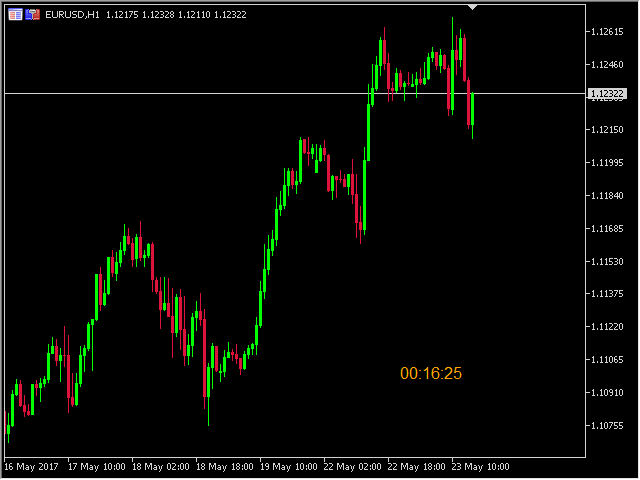
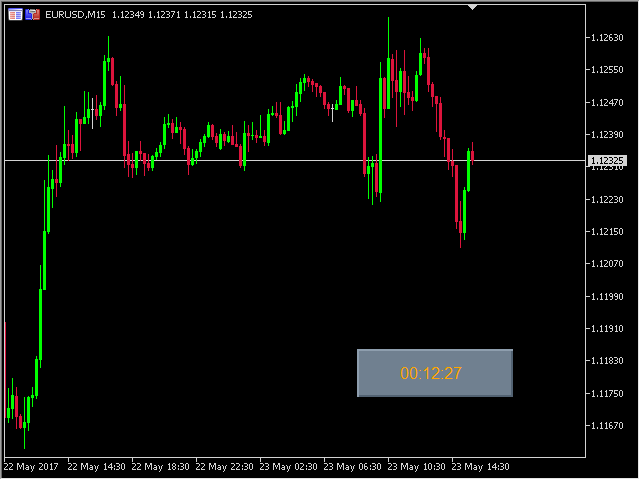
The Candle Timer indicator displays an advanced bar countdown timer on a chart. This study indicates the remaining time for the last candle in the chart.
Main features
- The indicator shows the remaining time for the last bar in the chart.
- Alert notifications for new bar.
- Works on every timeframe (M1, M5, M15, M30, H1, H4, D1, W1, MN).
- Customizable parameters (Colors, Text size, Visibility...).
- Ideal tool for all kinds of trading (Scalpers, intraday traders...).
- Very fast calculation.
- Available for MT4 and MT5.
Please visit the Candle Timer indicator product page for the input and output parameters settings.


great