Phoenix Volatility Clock
- インディケータ
-
Ali Alkanhousch
 I have been trading gold for five years. Like many traders, I bought robots that looked perfect in their ads and lost money on my account, so I started building and testing my own.
- バージョン: 1.0
Phoenix Volatility Clock shows when the symbol usually moves.
How it works
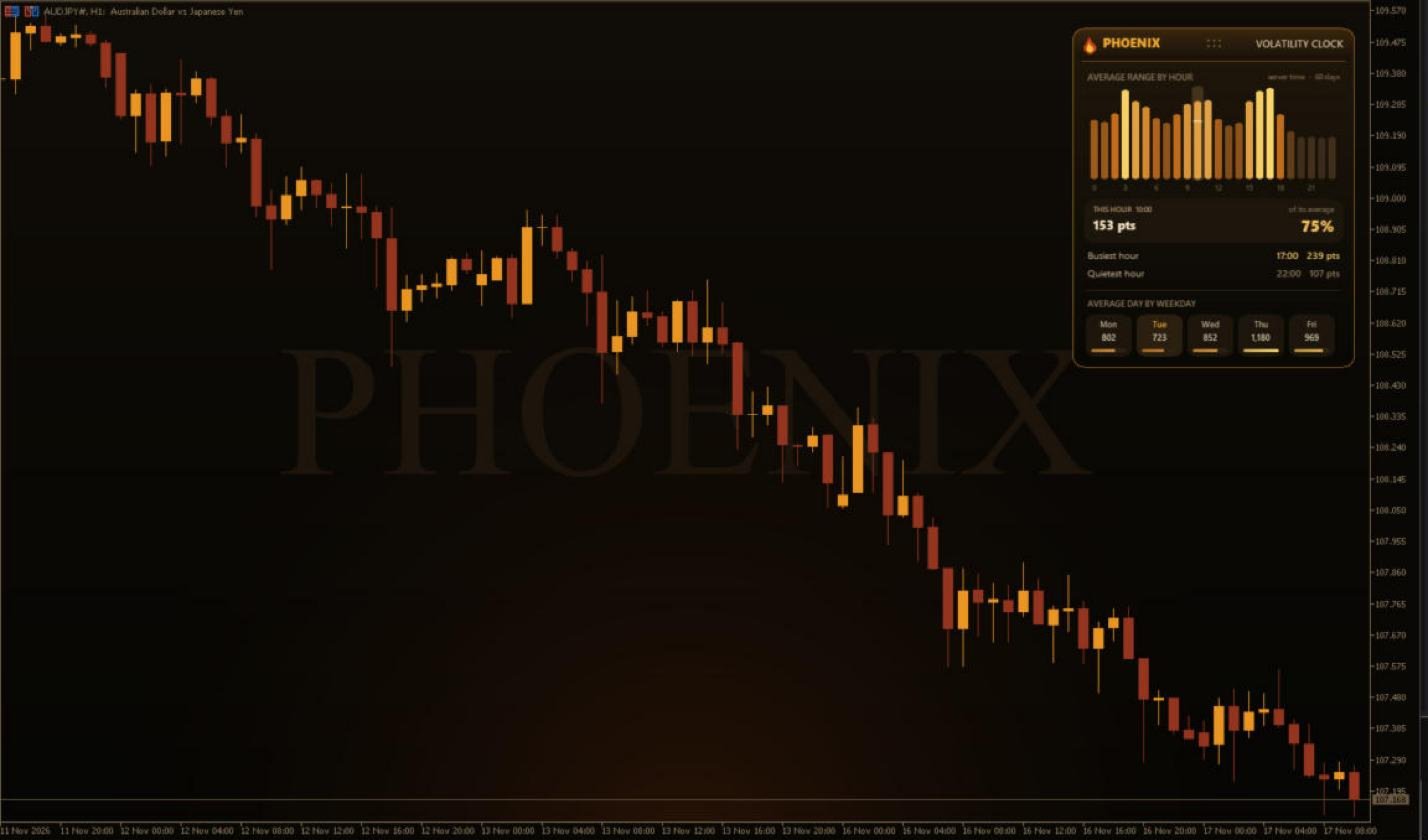
Every symbol has hours when it moves and hours when it sleeps. The indicator reads the last 60 days of your broker's H1 history and, for each of the 24 hours, averages the range (high - low) of that hour's candle. The same is done for each weekday with daily candles. So you see at a glance when trading the symbol makes sense and when the market is usually quiet.
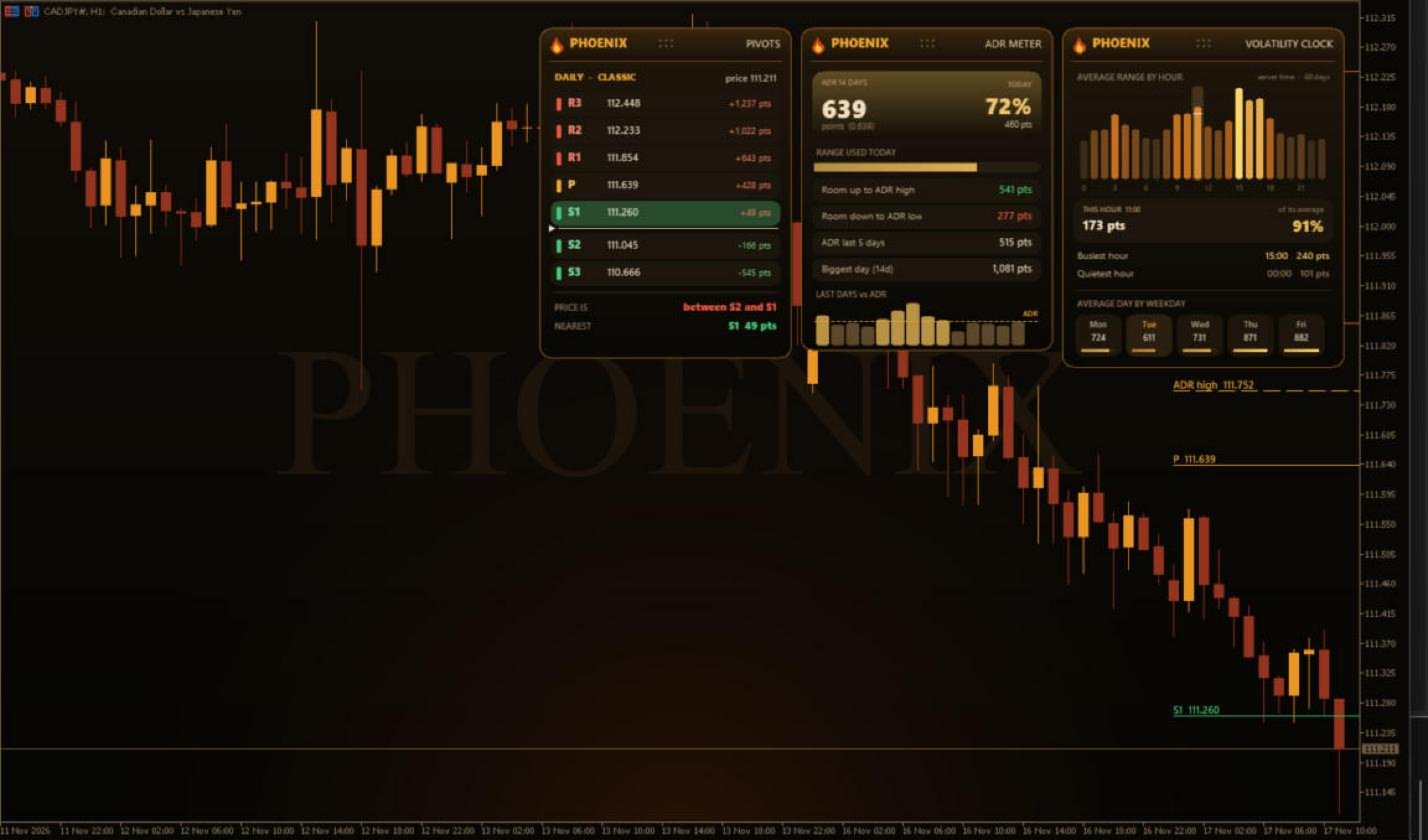
- 24 bars: the average candle range for each hour of the day, coloured from quiet to busy.
- The current hour is marked, with how much it has moved so far against its own average.
- The busiest and the quietest hour.
- The average day range for Monday to Friday, today highlighted.
- Everything is measured on your broker's own history, so it fits your server's time and your symbol.
Works on every market: gold, forex, indices, crypto and any timeframe.
Inputs
- Days of history to average.
- Hours in server time or in your computer's time.
- Look: clean Phoenix chart theme (the original chart colours come back when you remove the indicator), panel corner and position. The panel can be dragged with the mouse and folded with its minimise button.
Part of the free Phoenix tools: Market Sessions, Lot Calculator, Bands, Trend MTF, Pivot Levels, Currency Strength, ADR Meter, Account Guard, Volatility Clock and Order Blocks. All Phoenix panels can sit on one chart and move out of each other's way.
Phoenix Three Flames, our gold Expert Advisor: https://www.mql5.com/en/market/product/207465