Tight Range Breakout

Finds only the tightest price ranges on any symbol and timeframe, marks breakouts and false breakouts, and alerts you on PC and mobile. No repaint. 

Price often moves in a tight range before a big move. The hard part is knowing which range is really tight.

A range of $10 on gold can be quiet one day and wild the next. A box drawn by eye, or with a fixed distance, cannot tell the difference. Tight Range Breakout measures every range against the market's own recent behaviour, so it only marks the ranges that are truly unusual for that symbol and timeframe.

What it does

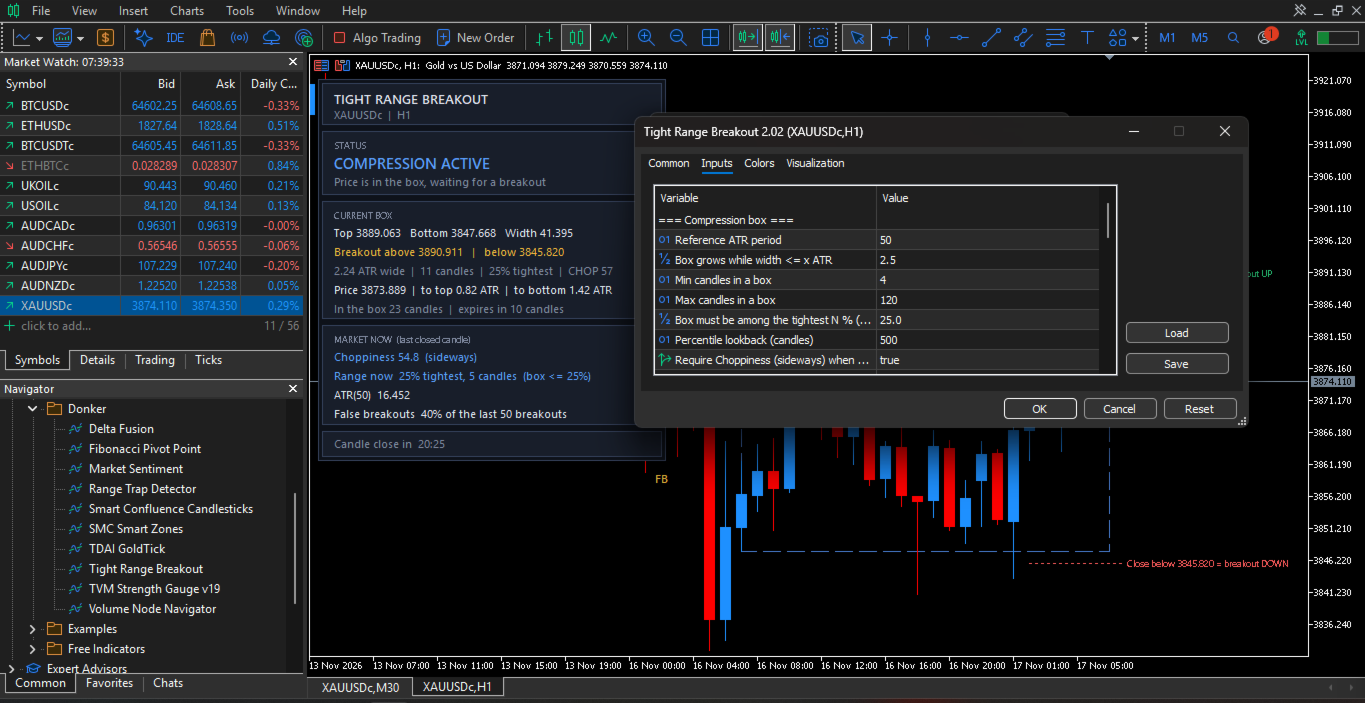
  • Finds compression boxes objectively. Each range is scored by its width, the current volatility and how long price has stayed inside it. A box appears only when that score ranks among the tightest ranges of recent history (the tightest 25% by default).
  • Filters out trending markets. An optional Choppiness filter makes sure the box forms while the market is moving sideways.
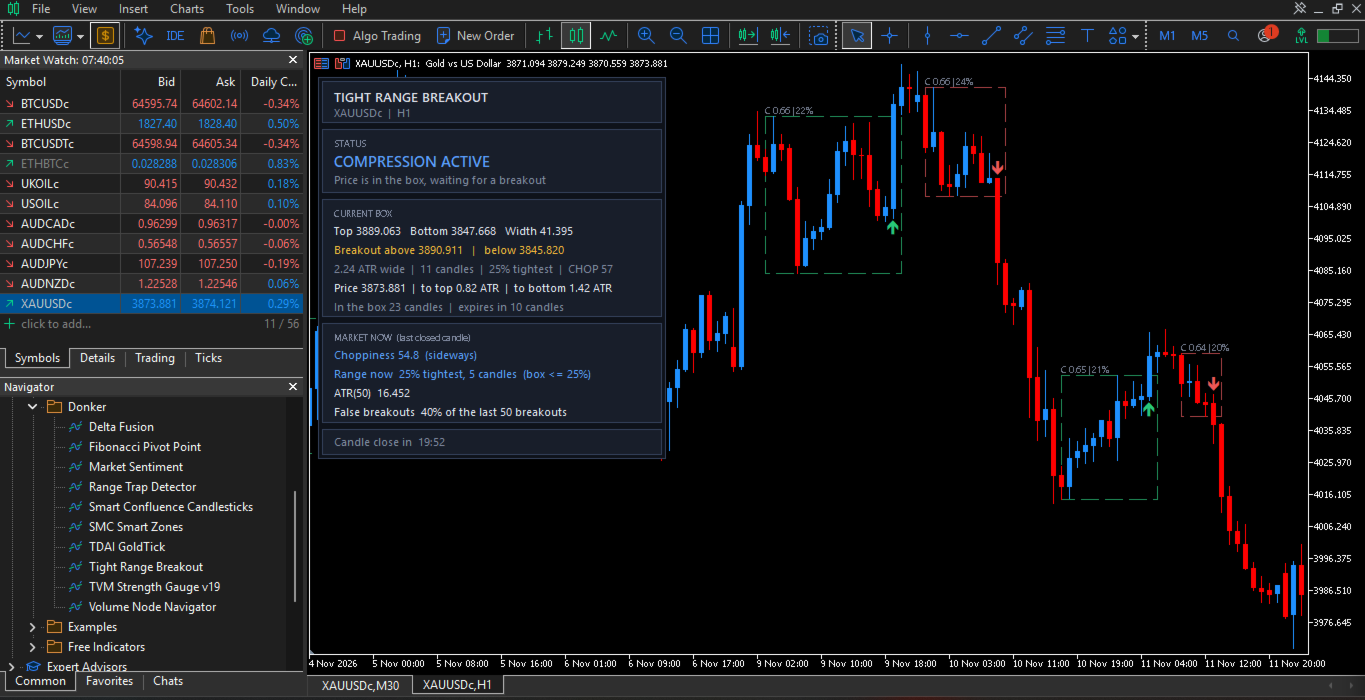
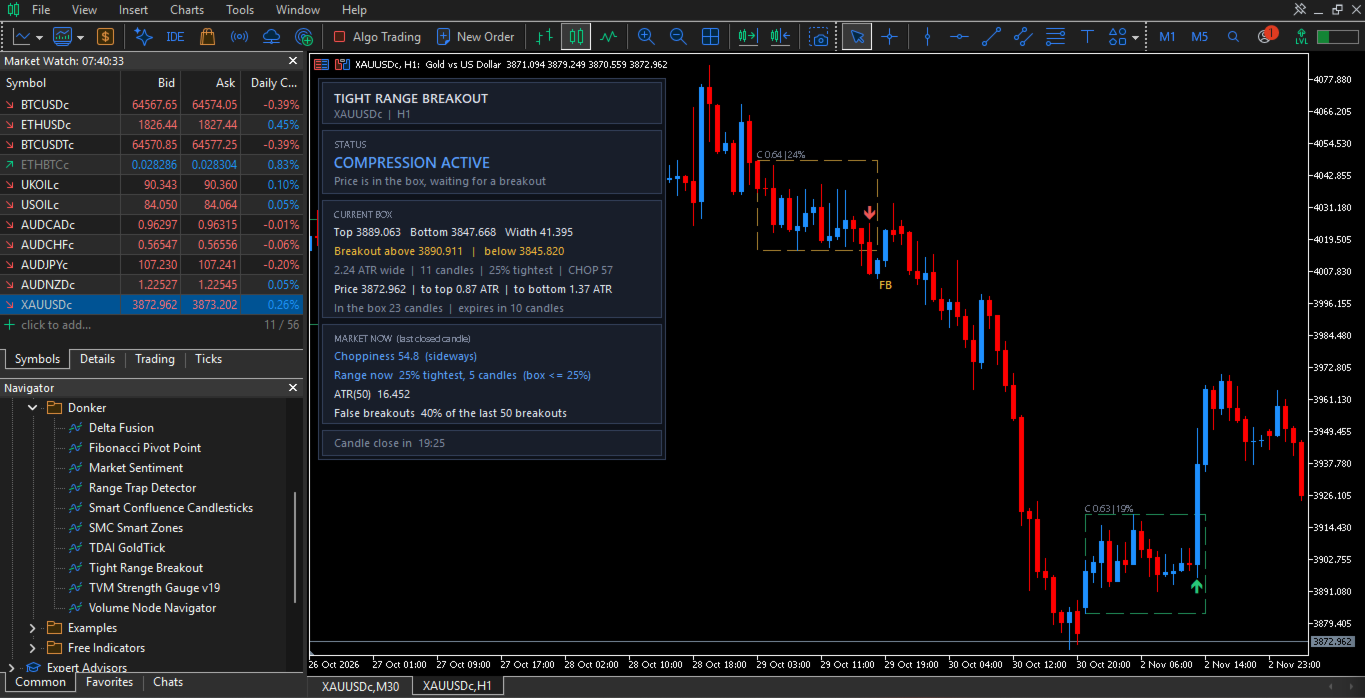
  • Marks the breakout. When a candle closes beyond the box (or touches the level, if you prefer), the box turns green or red and an arrow marks the breakout candle.
  • Detects false breakouts. If price closes back inside the box within a few candles, the box turns yellow and an FB label marks the furthest point of the failed move.
  • Expires old boxes. A box that waits too long without a breakout is closed in grey, and the indicator looks for the next one.
  • No repaint. Boxes, breakouts and false breakouts are calculated on closed candles only.

One setting for every market

Everything is measured in volatility units and ranked against the symbol's own history. The same default settings work on gold, forex, indices and crypto, on any timeframe, with no need to change pips or dollar values.

The panel

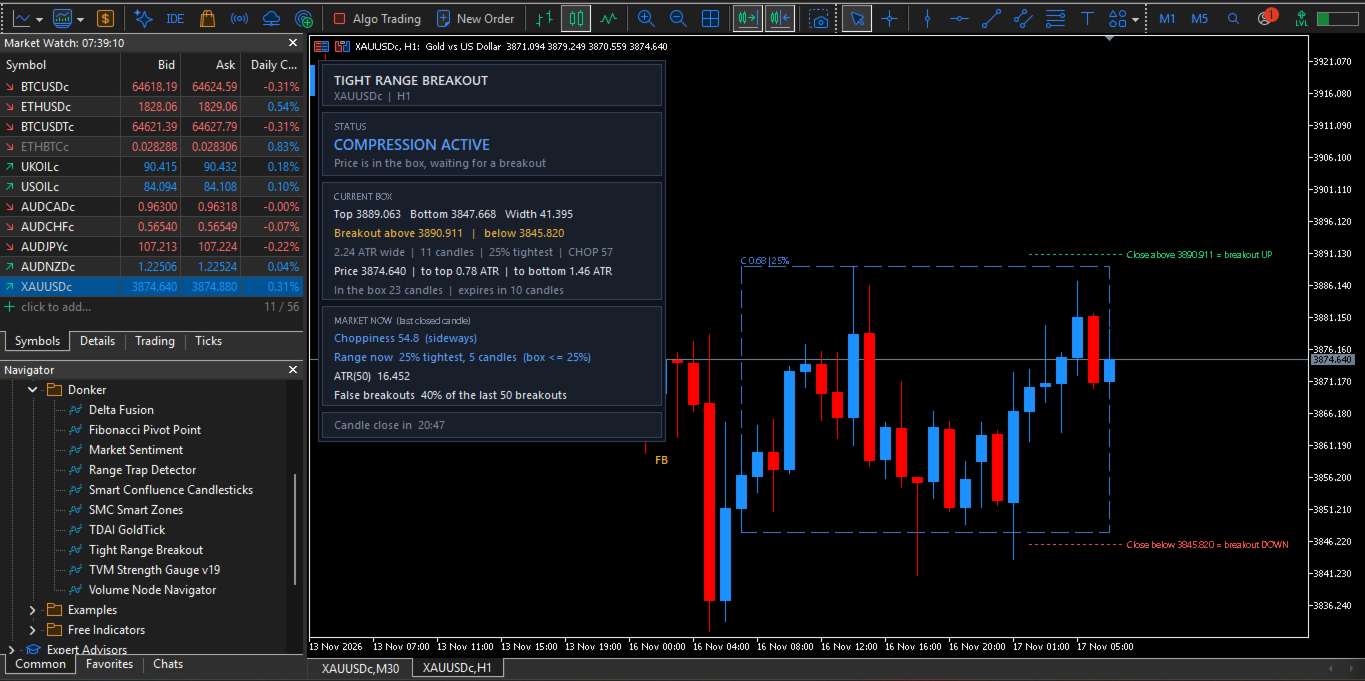
  • Status: compression active, breakout up or down (with the confirmation count), breakout held, false breakout or no compression.
  • Box: top, bottom, width, the exact breakout levels above and below, and how tight the box is compared with history.
  • Live price: where price is now relative to the box, updated every second.
  • Market now: current Choppiness (sideways, neutral or trending), how tight the current range already is, ATR, and the false breakout rate of the last 50 breakouts on this chart.
  • Candle countdown.

Hover over the label of any box to see its full details.

Alerts on PC and mobile

Turn on push notifications and receive a message on your phone when:

  • a new compression box is detected, with its breakout levels,
  • price breaks out up or down,
  • (optional) a breakout fails and price returns inside the box.

The same message is never sent twice, even after the indicator reloads.

How to use it

  1. Attach the indicator to any chart. H1 and M30 are good starting points.
  2. Wait for a blue box. The dotted lines show the breakout levels.
  3. Plan your trade with your own method when price breaks out, or wait for the breakout to be confirmed as held.
  4. Use the false breakout rate on the panel as a warning: when it is high, the first breakout often fails.

This is an analysis tool. It does not place trades and does not promise profit. Combine it with your own risk management.

Inputs

Compression box

Input

Default

What it does

Reference ATR period

50

Volatility used to measure the box

Box grows while width <= x ATR

2.5

Widest range that can still count as one box

Min / max candles in a box

4 / 120

Shortest and longest box

Tightest N %

25

Lower = fewer, stronger boxes

Percentile lookback

500

Candles the box is compared with

Require Choppiness / period / min

on / 14 / 50

Box must form in a sideways market

Box expires after x its length

3

0 = never expires

Breakout

Input

Default

What it does

Breakout trigger

Candle close

Touch (real-time), close, or close + extra distance

Buffer beyond the box

0.1 ATR

Small distance price must clear

Close + distance

0.25 ATR

Extra distance for the third trigger

False breakout within N candles

3

Close back inside within this many candles = false breakout

Display

History candles to scan, boxes kept on the chart, breakout level lines and their length, colours, panel on/off and position.

Alerts

Input

Default

Alert to mobile (push notification)

off

Popup alert on PC

off

Alert: compression detected

on

Alert: breakout up / down

on

Alert: false breakout

off

Push notifications need your MetaQuotes ID in Tools > Options > Notifications. Alerts work on live charts only, not in the Strategy Tester.
作者のその他のプロダクト
Clean, professional, and minimalist Daily Fibonacci Pivot Point indicator designed specifically for MetaTrader 5 (MT5).  It automatically calculates and plots critical intraday reversal and breakout levels—including the Pivot Point (PP), Resistance levels (R1–R3), and Support levels (S1–S3)—based on price action from the previous complete trading session. ​Built for price-action traders and technical analysts who prefer a clutter-free chart, this indicator eliminates visual noise while deliverin
FREE
Automatic Stop Loss and Take Profit for your manual trades. Choose the distance in price, points, pips, percent, ATR or money. Works on any symbol. Never opens trades. Donker Guard makes sure every manual position gets a Stop Loss and a Take Profit, even when you open trades in a hurry from your phone, the one-click panel or the order window. Attach it to a chart once, and every new position is protected within a fraction of a second. The EA is completely passive: on a live or demo account it
FREE
Account Watchdog & Push Notification System Protect Your Capital. Stay Informed Anywhere, Anytime. Pocket Alert is a professional account watchdog Expert Advisor designed for MetaTrader 5 . Unlike traditional EAs that risk your capital by opening or closing trades, Pocket Alert focuses purely on safeguarding your account . It continuously monitors critical account metrics and instantly delivers real-time push notifications straight to your MT5 Mobile app . Whether you are running multi-pair grid
FREE
See the real quality of any EA or manual trading: results in R, money and percent, time below peak, monthly heatmap, results per comment, symbol and direction, plus an automatic martingale, grid and no-stop-loss check. Net profit tells you how much an EA made. It does not tell you how it made it, how long you had to wait through losses, or whether the account is one bad week away from disaster. Smart Trade Analyzer reads your account history inside MetaTrader 5 and answers those questions on one
FREE
Smart Zones is a comprehensive, institutional-grade price action indicator designed specifically for MetaTrader 4 (MT4) traders utilizing Smart Money Concepts (SMC) . Whether you trade Forex, Gold (XAUUSD), or indices, Smart Zones automates your technical analysis by mapping out institutional order flow directly on your MT4 charts—saving you hours of manual charting and eliminating emotional bias. Key Features & Capabilities: Dual Market Structure (Swing & Internal): Automatically detects an
Delta Fusion SMC is an advanced MetaTrader 4 indicator designed for serious traders who want to merge institutional price action—specifically Smart Money Concepts (SMC) —with high-frequency Tick Delta order flow analysis . ​By uniting multi-engine data into a clean, interactive chart dashboard, Delta Fusion SMC helps you filter out noise, spot true institutional footprints, and execute with disciplined, rule-based precision. ​ Key Engines & Core Features ​ Engine 1: Tick Delta Fusion (TDA + TI
Smart Zones is a powerful, comprehensive MetaTrader 5 indicator designed for traders using Smart Money Concepts (SMC) and institutional price action. All-in-One SMC & Price Action Engine. Instead of cluttering your charts with multiple tools, Smart Zones automatically maps dual market structures, order blocks, liquidity sweeps, fair value gaps, premium/discount zones, and multi-timeframe bias into one ultra-clean, professional dashboard.  Key Features & Core Engines Dual Market Structure (Swin
TDAI Gold  Lite  (Tick Delta Accumulation Indicator)   Sub-Bar Order Flow & Tick Imbalance Analytics for XAUUSD  is an institutional-grade trading tool engineered exclusively for   XAUUSD (Gold Spot) .  Unlike traditional technical indicators (RSI, MACD, Moving Averages) that suffer from inherent lag by only looking at historical OHLC bar closes, TDAI operates at   sub-bar resolution .  It captures, calculates, and analyzes the raw flow of individual price ticks in real-time inside the forming c
Delta Fusion SMC is an advanced MetaTrader 5 indicator designed for serious traders who want to merge institutional price action—specifically Smart Money Concepts (SMC) —with high-frequency Tick Delta order flow analysis . ​By uniting multi-engine data into a clean, interactive chart dashboard, Delta Fusion SMC helps you filter out noise, spot true institutional footprints, and execute with disciplined, rule-based precision. ​ Key Engines & Core Features ​ Engine 1: Tick Delta Fusion (TDA + TI
Tick Volume
Muhammad Karman Kadir
Market Sentiment – Buy/Sell Tick Volume, Delta & Cumulative Delta Panel. See who controls the market in one clean panel: buy vs. sell tick volume, delta, cumulative delta, volume spikes, divergence and a delta histogram, calculated from real tick history. Market Sentiment splits the tick volume of every candle into buying and selling pressure and shows the result in a compact, modern panel on your chart. No extra indicator window, no cluttered chart.  WATCH INDICATOR IN LIVE STREAMING on OUR YO
Volume Node Navigator is an institutional-grade Tick Volume Profile and Order Flow indicator built specifically for MetaTrader 5 . Designed to reveal hidden market liquidity, structural support and resistance, and real-time buyer/seller aggression, it provides traders with a complete auction market framework directly on their charts . Core Features Multi-Timeframe & Session Profiles: Automatically plot Volume Profiles across Sessions (Asia, London, New York with customizable GMT hours), Daily ,
Range Trap Detector (RTD) is an advanced technical indicator for the MetaTrader 5 platform, specifically engineered to precisely detect back-and-forth (ranging or sideways) price movements . This indicator goes beyond simply drawing range boxes; it maps back-and-forth cycles, tracks breakouts, and identifies market traps such as False Breakouts in real-time. It is ideal for various asset classes (Forex, Gold/XAUUSD, Crypto, and Indices) to help you avoid consolidation traps or capture reversal o
Smart Confluence Candlesticks finds classic price-action patterns and keeps only the ones that form at a meaningful price level. A pattern in the middle of nowhere is ignored. A pattern at a swing high, the previous day's low or a round number is shown with its score, its levels and a complete trade plan. Everything is calculated on closed candles only. Levels and bias use only data that was available when the pattern closed, so what you see in history is what you would have seen live. “Spotting
フィルタ:
レビューなし
レビューに返信