Sideway Detector with Push Alert
- インディケータ
- バージョン: 3.17
- アクティベーション: 5

Sideway Detector Pro
Understand Market Conditions Before Planning Your Next Trade
Sideway Detector Pro is an analytical indicator for MetaTrader 5. It helps identify consolidation areas, assess sideways conditions and compare market regimes across multiple timeframes.
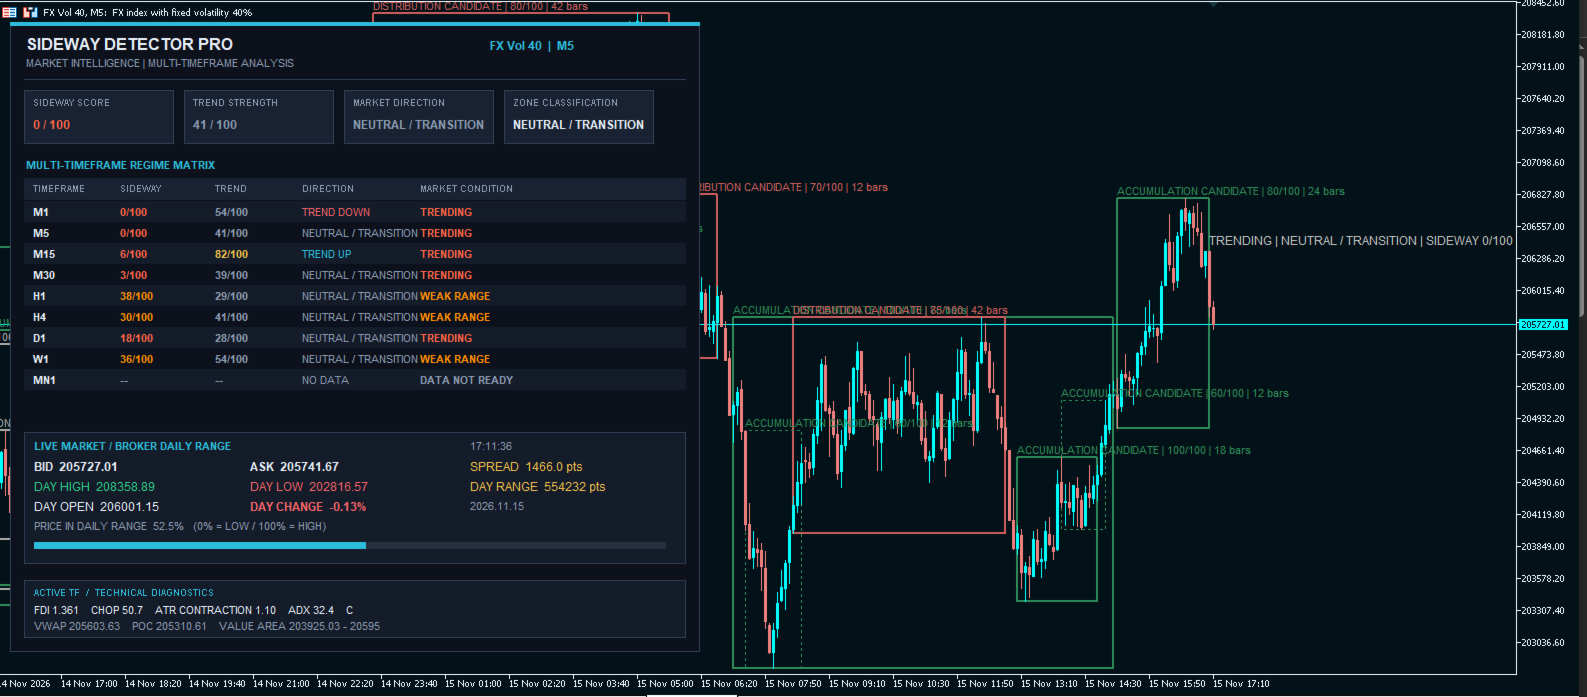
The indicator combines horizontal chart zones, a multi-timeframe dashboard, market-event notifications and a Live Market panel displaying current quotes and the daily trading range.
Use this information to understand market context before applying your own trading strategy.
The indicator does not open, modify or close trades.
For Scalpers and Day Traders
Received a notification on your computer or phone, or noticed a change on the dashboard? Review the relevant chart and assess the opportunity using your own trading rules.
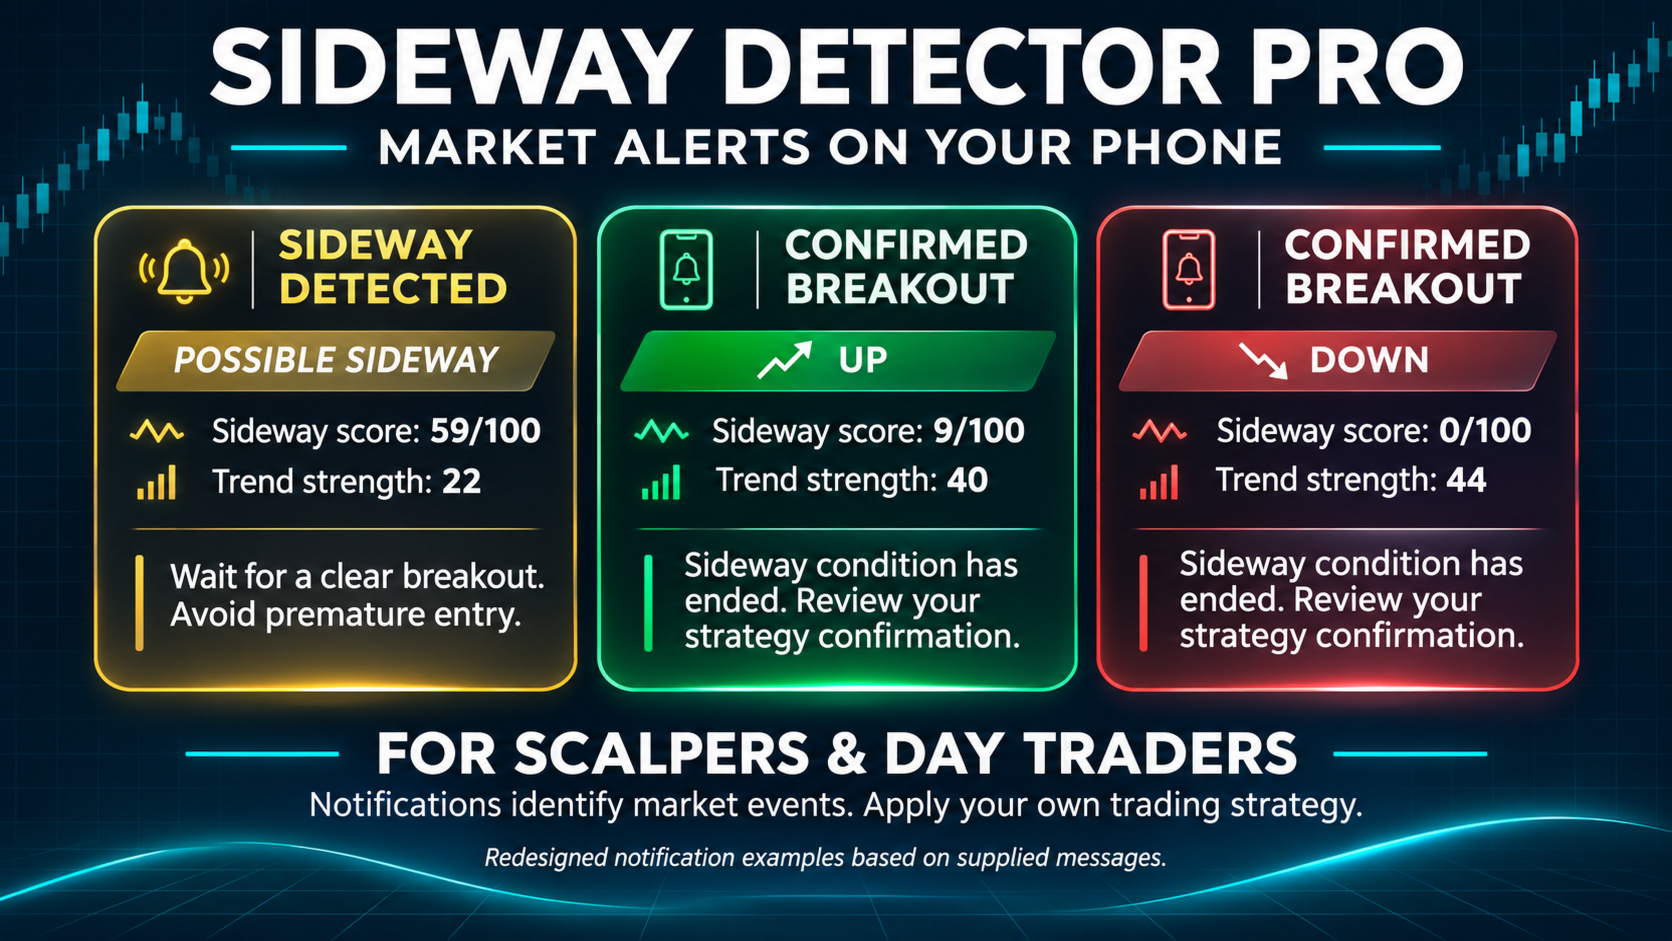
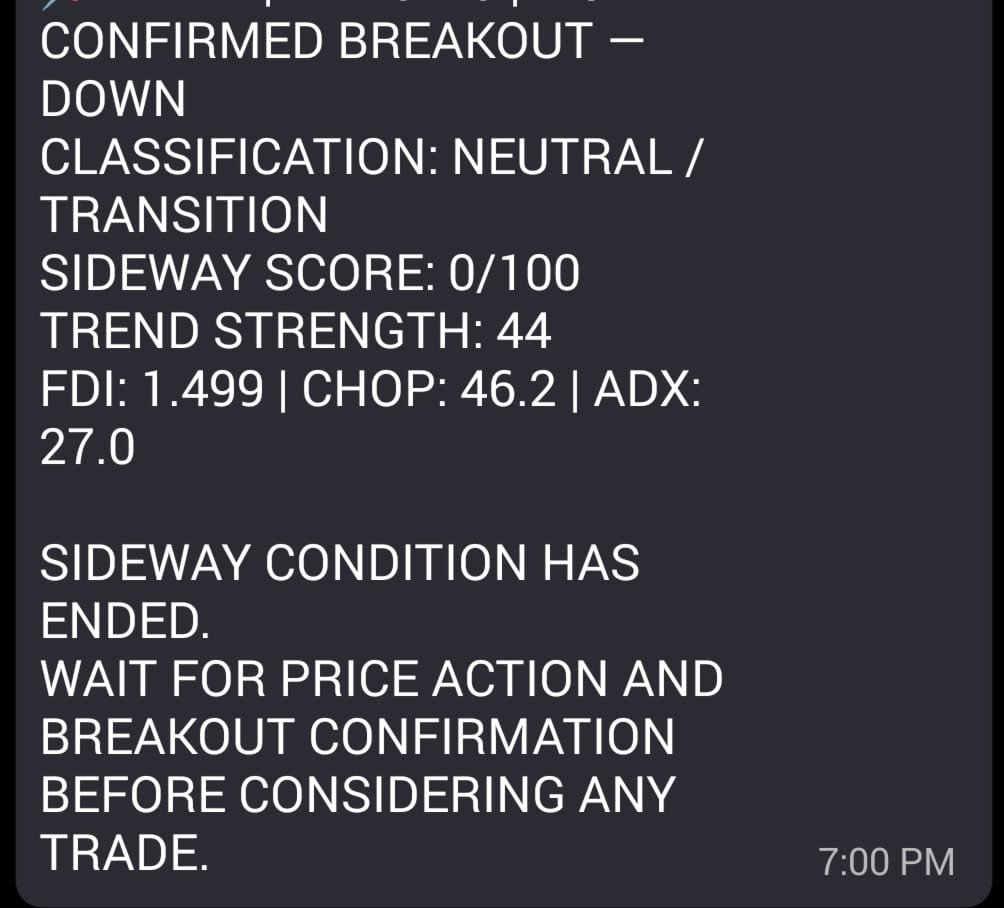
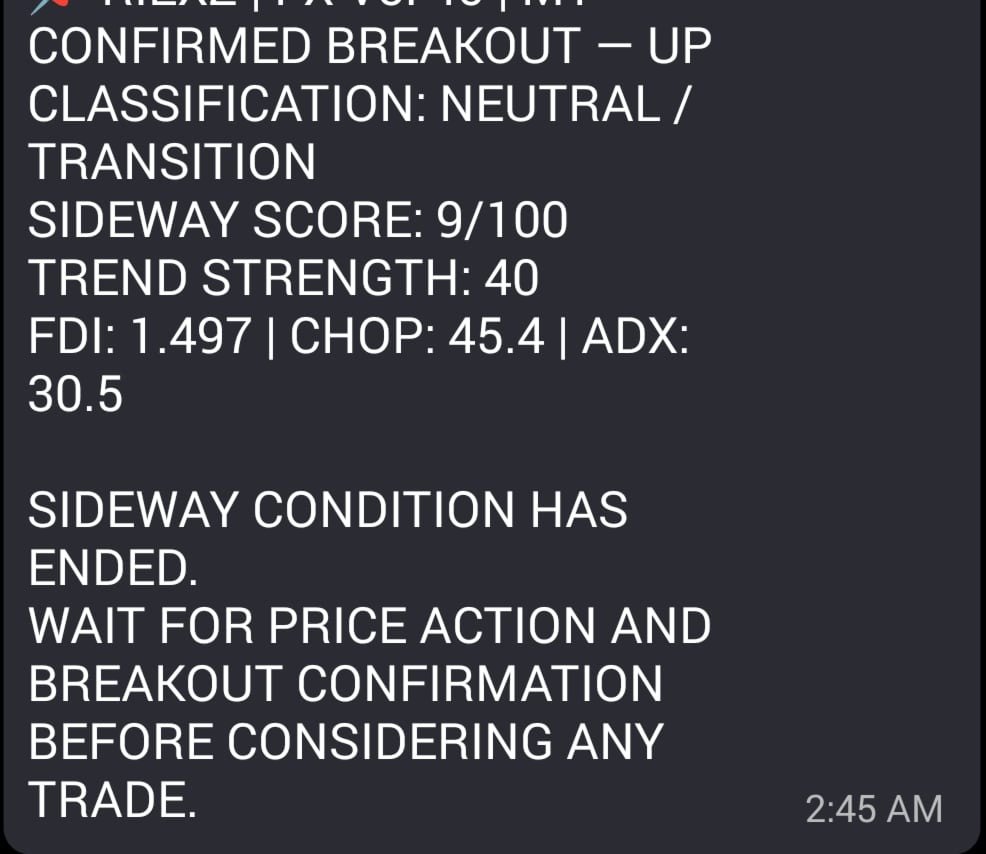
Notifications can draw attention to developing sideways conditions, potential fakeouts and confirmed exits from monitored ranges.
Before entering a trade, determine whether the setup meets your strategy, whether the direction is confirmed, and where to place your entry, stop-loss and profit objective. Select a position size appropriate for your risk limit.
A notification reports a detected market condition. It is not an automatic BUY or SELL instruction. If your strategy’s conditions are not satisfied, no trade is required.
Finding BUY and SELL Opportunities
Use the colored zones together with the dashboard and relevant computer or mobile notifications.
Green Zones: Look for BUY Setups
Green rectangles labelled ACCUMULATION CANDIDATE identify areas to examine for potential BUY opportunities.
When price is inside or returns to a relevant green zone:
-
Review the dashboard’s market direction and trend strength.
-
Compare conditions across your selected timeframes.
-
Look for the BUY confirmation required by your strategy.
-
Define your stop-loss, position size and profit objective.
A green zone does not guarantee support, a reversal or a subsequent price increase.
Red Zones: Look for SELL Setups
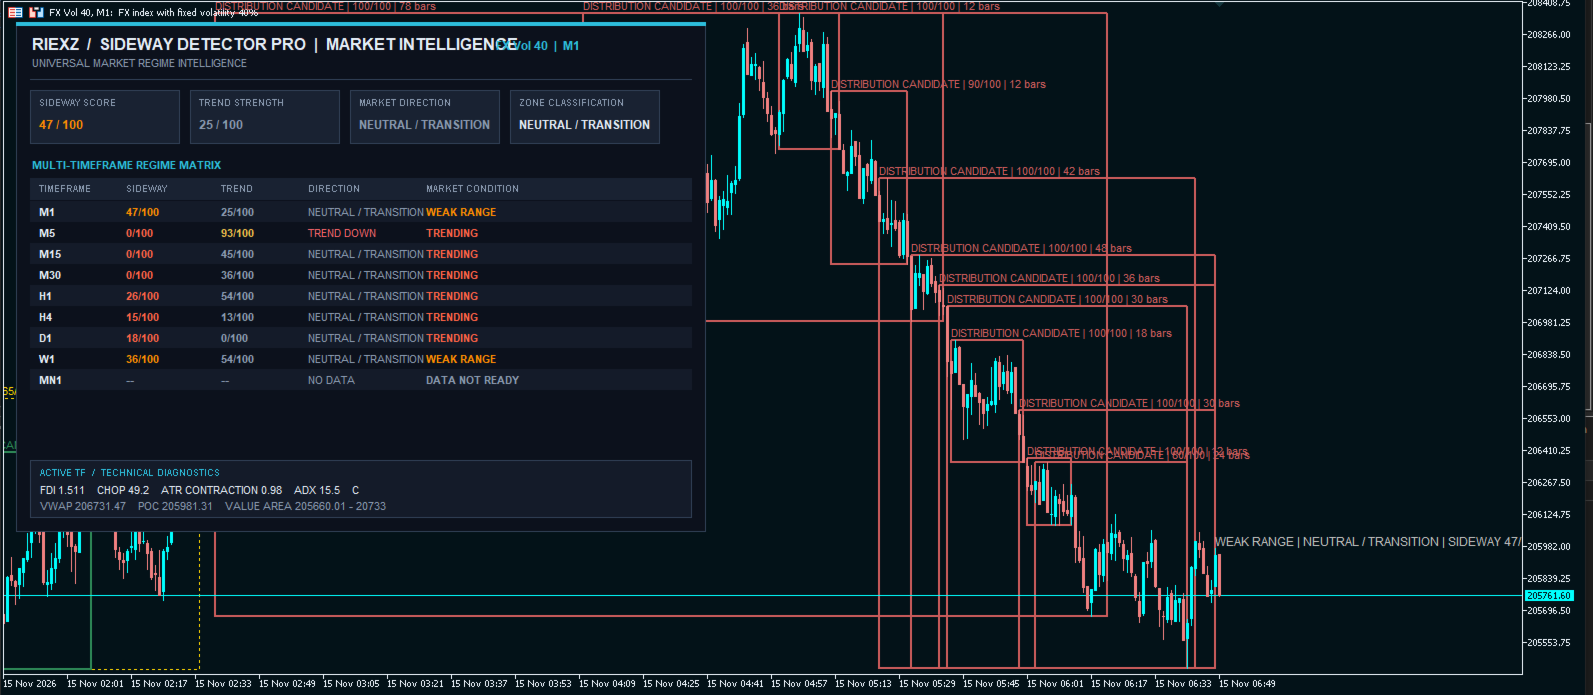
Red rectangles labelled DISTRIBUTION CANDIDATE identify areas to examine for potential SELL opportunities.
When price is inside or returns to a relevant red zone:
-
Review the dashboard’s market direction and trend strength.
-
Compare conditions across your selected timeframes.
-
Look for the SELL confirmation required by your strategy.
-
Define your stop-loss, position size and profit objective.
A red zone does not guarantee resistance, a reversal or a subsequent price decrease.
Combine Zones, Dashboard Context and Notifications
When a notification arrives, first check its symbol, timeframe and event type. Then review the corresponding chart and determine whether a relevant zone and your strategy support the same setup.
Notifications are not necessarily issued whenever a green or red rectangle appears. They report market events detected by the notification logic.
Zone colors identify areas of interest, not automatic trading instructions. Historical zones may no longer be relevant to current price. If the zone, dashboard context and your strategy do not support the same setup, wait for clearer conditions.
In version 3.17, rectangle labels use the price-movement context within the detected historical window. “Accumulation Candidate” and “Distribution Candidate” are preliminary classifications, not confirmation of institutional activity.
Main Features
Multi-Timeframe Market Dashboard
Monitor nine timeframes for the current chart symbol:
M1, M5, M15, M30, H1, H4, D1, W1 and MN1.
The dashboard displays:
-
Sideway score.
-
Trend strength score.
-
Market direction.
-
Market-condition classification.
-
Current chart timeframe summary.
Each timeframe is evaluated independently. A lower timeframe may show consolidation while a higher timeframe remains directional.
Historical and Current Consolidation Zones
The indicator scans historical windows of different durations and highlights areas that satisfy its range-detection conditions.
Chart labels can include:
-
ACCUMULATION CANDIDATE
-
DISTRIBUTION CANDIDATE
-
CONSOLIDATION
Colors can be customized. Green and red are the default directional colors; if you change them, interpret the zones according to their labels.
When overlapping-zone merging is enabled, qualifying zones may be combined and their boundaries and labels updated.
Historical rectangles can remain visible after a trend begins. They describe earlier market structure and do not mean current price remains inside the same range.
Live Market Panel
The Live Market section displays:
-
Current Bid and Ask.
-
Spread in points.
-
Daily high and low.
-
Daily range in points.
-
Daily opening price.
-
Percentage change in Bid from the daily opening price.
-
Bid’s position within the daily range.
-
A visual daily-range position bar.
-
Latest quote time.
On the position scale, 0% represents the daily low, 50% the midpoint, and 100% the daily high.
This position is not a probability of reversal or continuation.
Daily values use the broker’s current D1 candle. The trading-day boundary follows the broker’s data and may differ from your local calendar day.
The daily range measures the distance already established between today’s high and low. It is not an average daily range or a forecast of remaining movement.
Quotes update when ticks arrive. Main market-regime analysis runs separately using a timer and completed candles.
Computer and Mobile Notifications
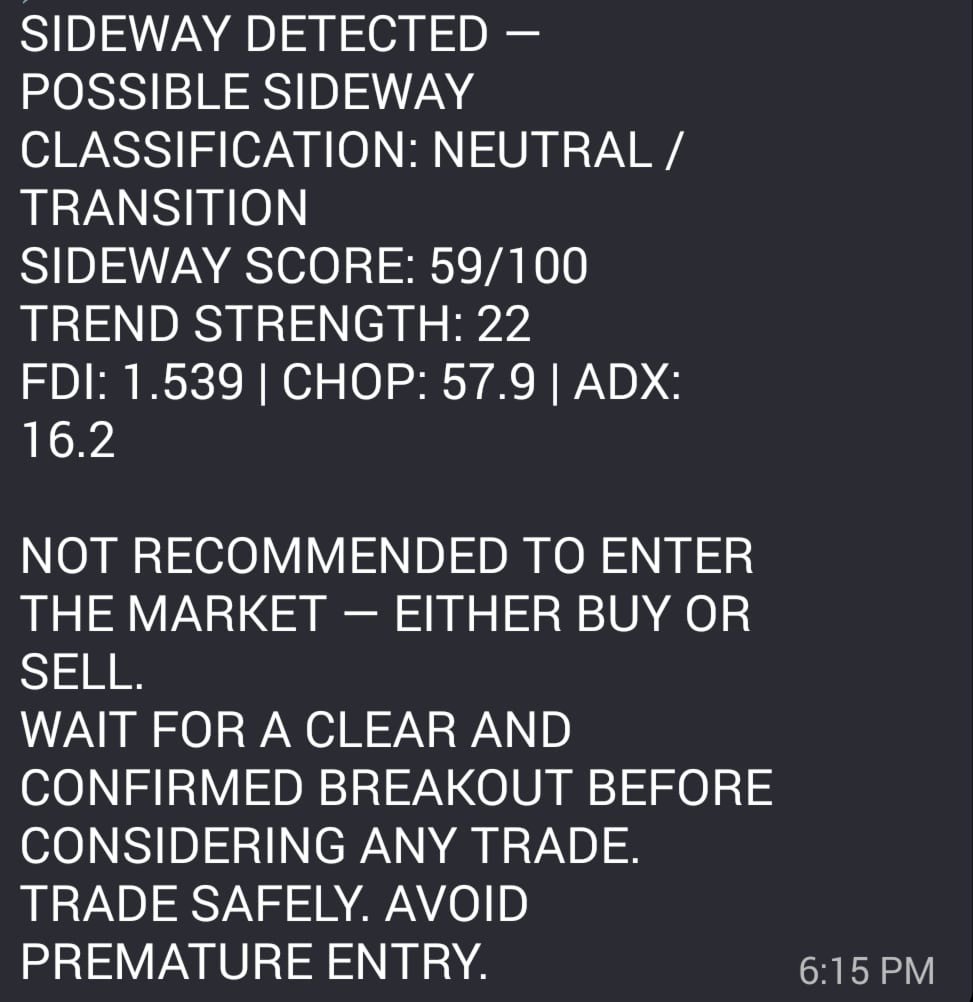
The indicator supports terminal popups and mobile push notifications for:
-
The start of possible sideways conditions.
-
The start of confirmed sideways conditions under the model.
-
A confirmed exit from a monitored sideways range.
-
Qualifying fakeout or liquidity-sweep conditions.
A confirmed exit uses a completed candle relative to monitored boundaries, together with additional model conditions. It is a market-regime notification, not a separate breakout alert for every historical rectangle.
Configure MetaTrader 5 notifications and enter your MetaQuotes ID to receive mobile messages. The terminal must remain running and connected for continuous analysis and notification delivery.
Understanding the Dashboard
Sideway Score
The score ranges from 0 to 100:
-
0–29: TRENDING
-
30–49: WEAK RANGE
-
50–69: POSSIBLE SIDEWAY
-
70–84: SIDEWAY CONFIRMED
-
85–100: STRONG SIDEWAY
These are model classifications, not probabilities of profitable trades. A score of 85 does not mean 85% accuracy.
TRENDING indicates a low sideway score. It does not independently confirm a strong trend.
Trend Strength and Direction
Trend strength separately summarizes directional characteristics. Trend strength and sideway scores are not required to add up to 100.
Direction can show:
-
TREND UP
-
TREND DOWN
-
NEUTRAL / TRANSITION
Neutral / Transition means the directional requirements are not sufficiently aligned. It does not necessarily mean price is stationary.
Dashboard Scores Versus Zone Scores
The dashboard describes recent conditions on each monitored timeframe. A rectangle’s score relates to the historical window used to detect that zone.
An older rectangle can therefore have a high range score while the current dashboard shows TRENDING.
Main Settings
Display and History
-
InpDashboard: Show or hide the dashboard, including Live Market.
-
InpDrawHistoricalZones: Show or hide detected zones.
-
InpDrawTrendLabels: Show or hide the current market-condition label.
-
InpHistoryBars: Set historical analysis depth.
-
InpMaxZones: Limit the number of zones in the detected-zone list.
-
InpMergeOverlappingZones: Enable overlapping-zone merging.
-
InpRefreshSeconds: Set the main analysis refresh interval.
InpMaxZones defaults to 35. Reduce this value if the chart becomes crowded.
Notifications
-
InpEnablePush: Enable mobile notifications.
-
InpEnablePopup: Enable terminal popup alerts.
-
InpAlertOnPotentialZone: Notify when possible sideways conditions begin.
-
InpAlertOnConfirmedZone: Notify when confirmed sideways conditions begin.
-
InpAlertOnBreakout: Notify about a confirmed exit from the monitored sideways regime.
Additional settings control detection, zone construction, appearance and dashboard placement.
Getting Started
-
Attach the indicator to your selected symbol.
-
Allow sufficient historical data to load.
-
Review current quotes and the daily range.
-
Compare market conditions across timeframes.
-
Examine relevant green zones for BUY setups and red zones for SELL setups.
-
Enable the notifications you need.
-
Apply your own entry confirmation and risk-management rules.
Symbols and Data
The indicator automatically uses the current chart symbol.
Its calculations use relative market measurements rather than a fixed synthetic-index point conversion. It is designed to process broker-provided symbols, including Forex, metals, indices and synthetic instruments where sufficient history is available.
Results can differ between brokers, symbols, sessions and timeframes. Technical compatibility does not establish equal detection quality across all markets.
Volume-related components use broker-provided tick volume, not a complete record of market-wide traded volume.
Important Operating Notes
-
Market-regime analysis uses completed candles, so confirmation introduces delay.
-
Current quotes and daily values update separately.
-
Zones may update or merge as new data becomes available.
-
Historical rectangles are not guaranteed support or resistance.
-
Green and red zones are not automatic BUY or SELL signals.
-
A fakeout does not guarantee a reversal.
-
Price can return inside a range after a confirmed exit.
-
The indicator does not automatically size positions or place stop-loss and take-profit orders.
-
Profitability, a particular accuracy percentage and protection against losses are not guaranteed.
Evaluate the indicator on your intended symbols and timeframes before incorporating its information into a live trading plan.