Zonecraft SMC Suite
- インディケータ
- バージョン: 1.0
- アクティベーション: 10

Clear structure. Clean zones. No repaint.
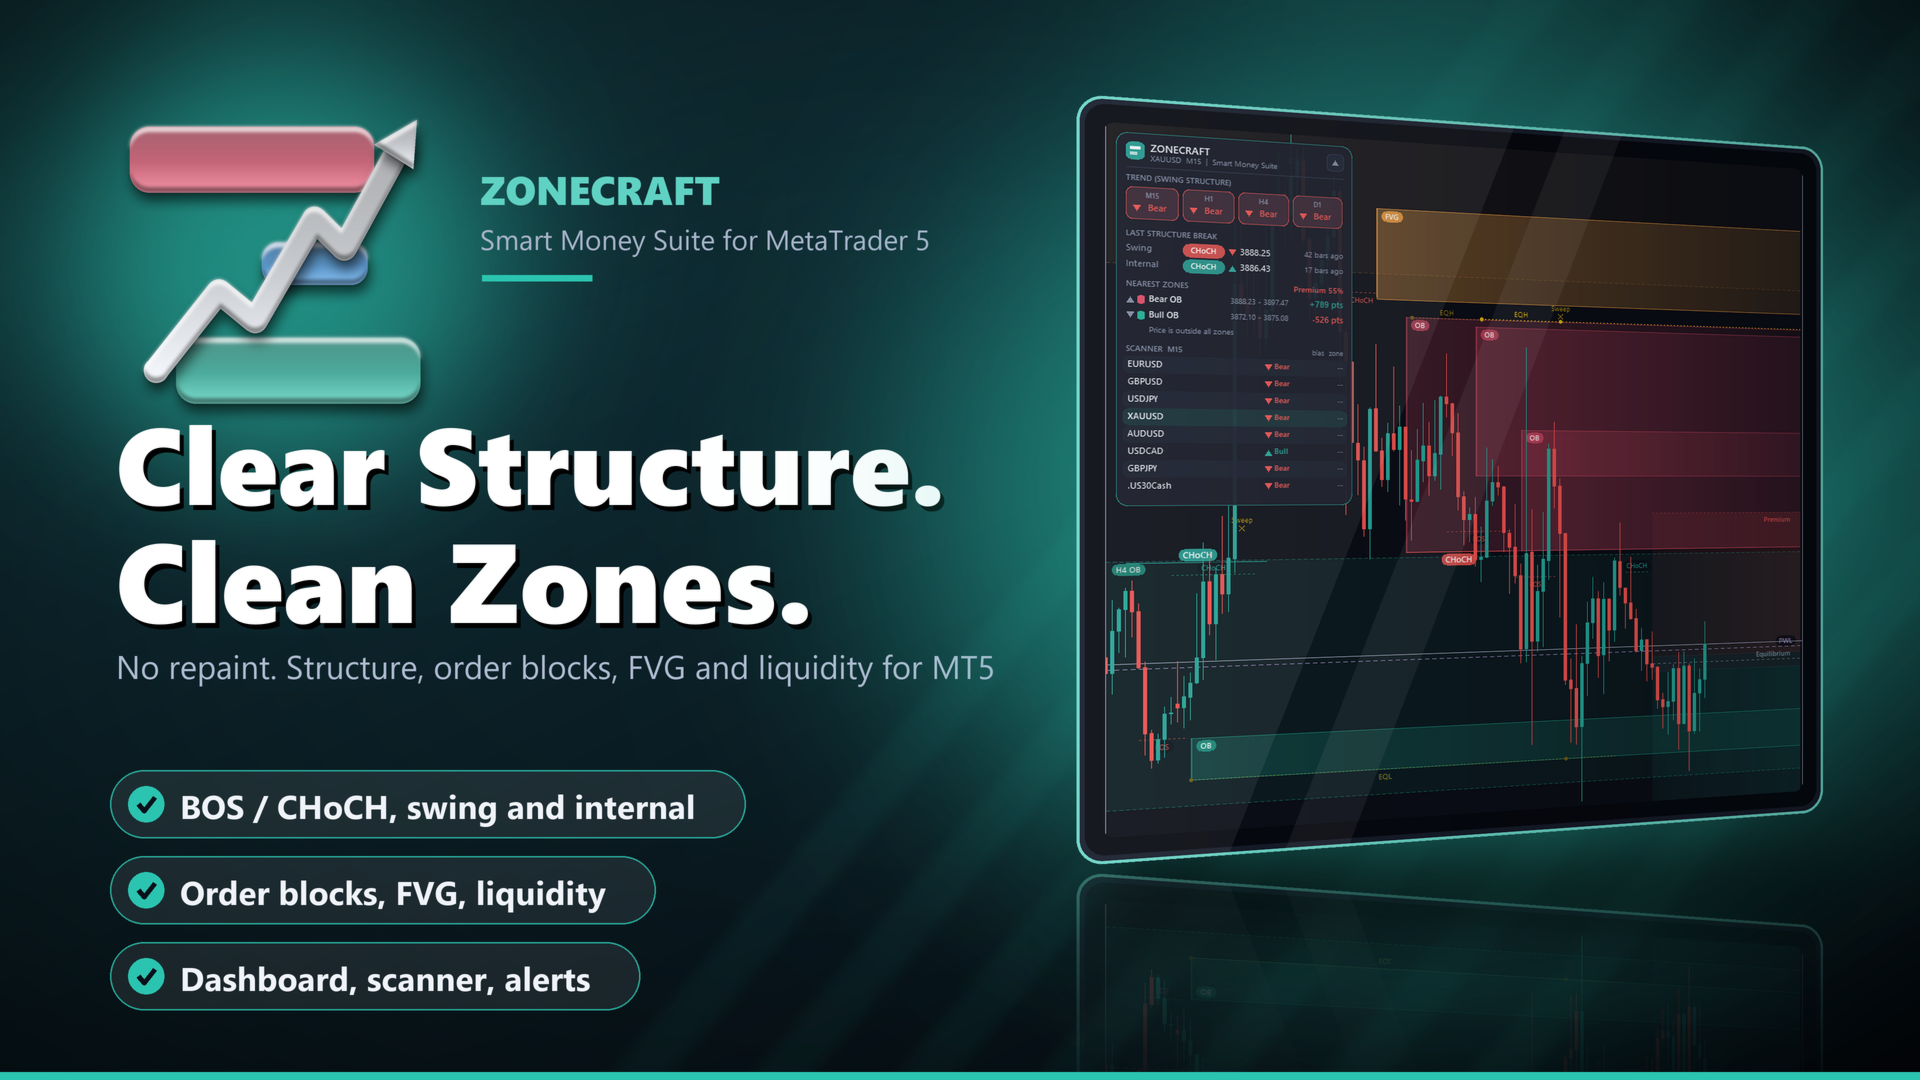
Zonecraft SMC Suite draws market structure, order blocks, fair value gaps, liquidity and premium / discount zones on your MetaTrader 5 chart. Every element follows a written rule, is calculated from closed candles only and is drawn as a soft, semi-transparent zone with a small label that does not cover other labels. A compact dashboard shows the trend on four timeframes, the nearest zones above and below price and a small scanner for up to 12 symbols.
It is an analysis tool. It does not open trades and it does not give buy or sell signals.
What you see on the chart
- Market structure on two levels: swing structure (strength 10 by default) and internal structure (strength 3). BOS and CHoCH labels, swing points HH / HL / LH / LL on request.
- Order blocks, bullish and bearish, with their state: fresh, touched (drawn lighter) and broken (removed or kept faded, your choice).
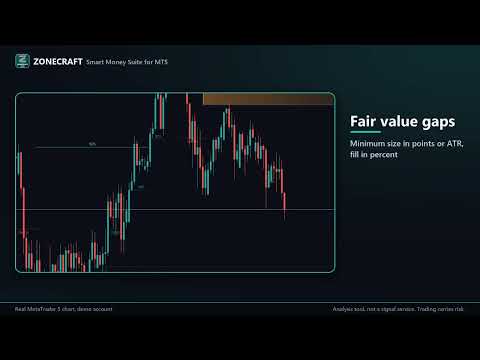
- Fair value gaps with a minimum size in points or as a fraction of ATR. Partly filled gaps shrink to the open part and show how much is filled, for example "FVG 45%".
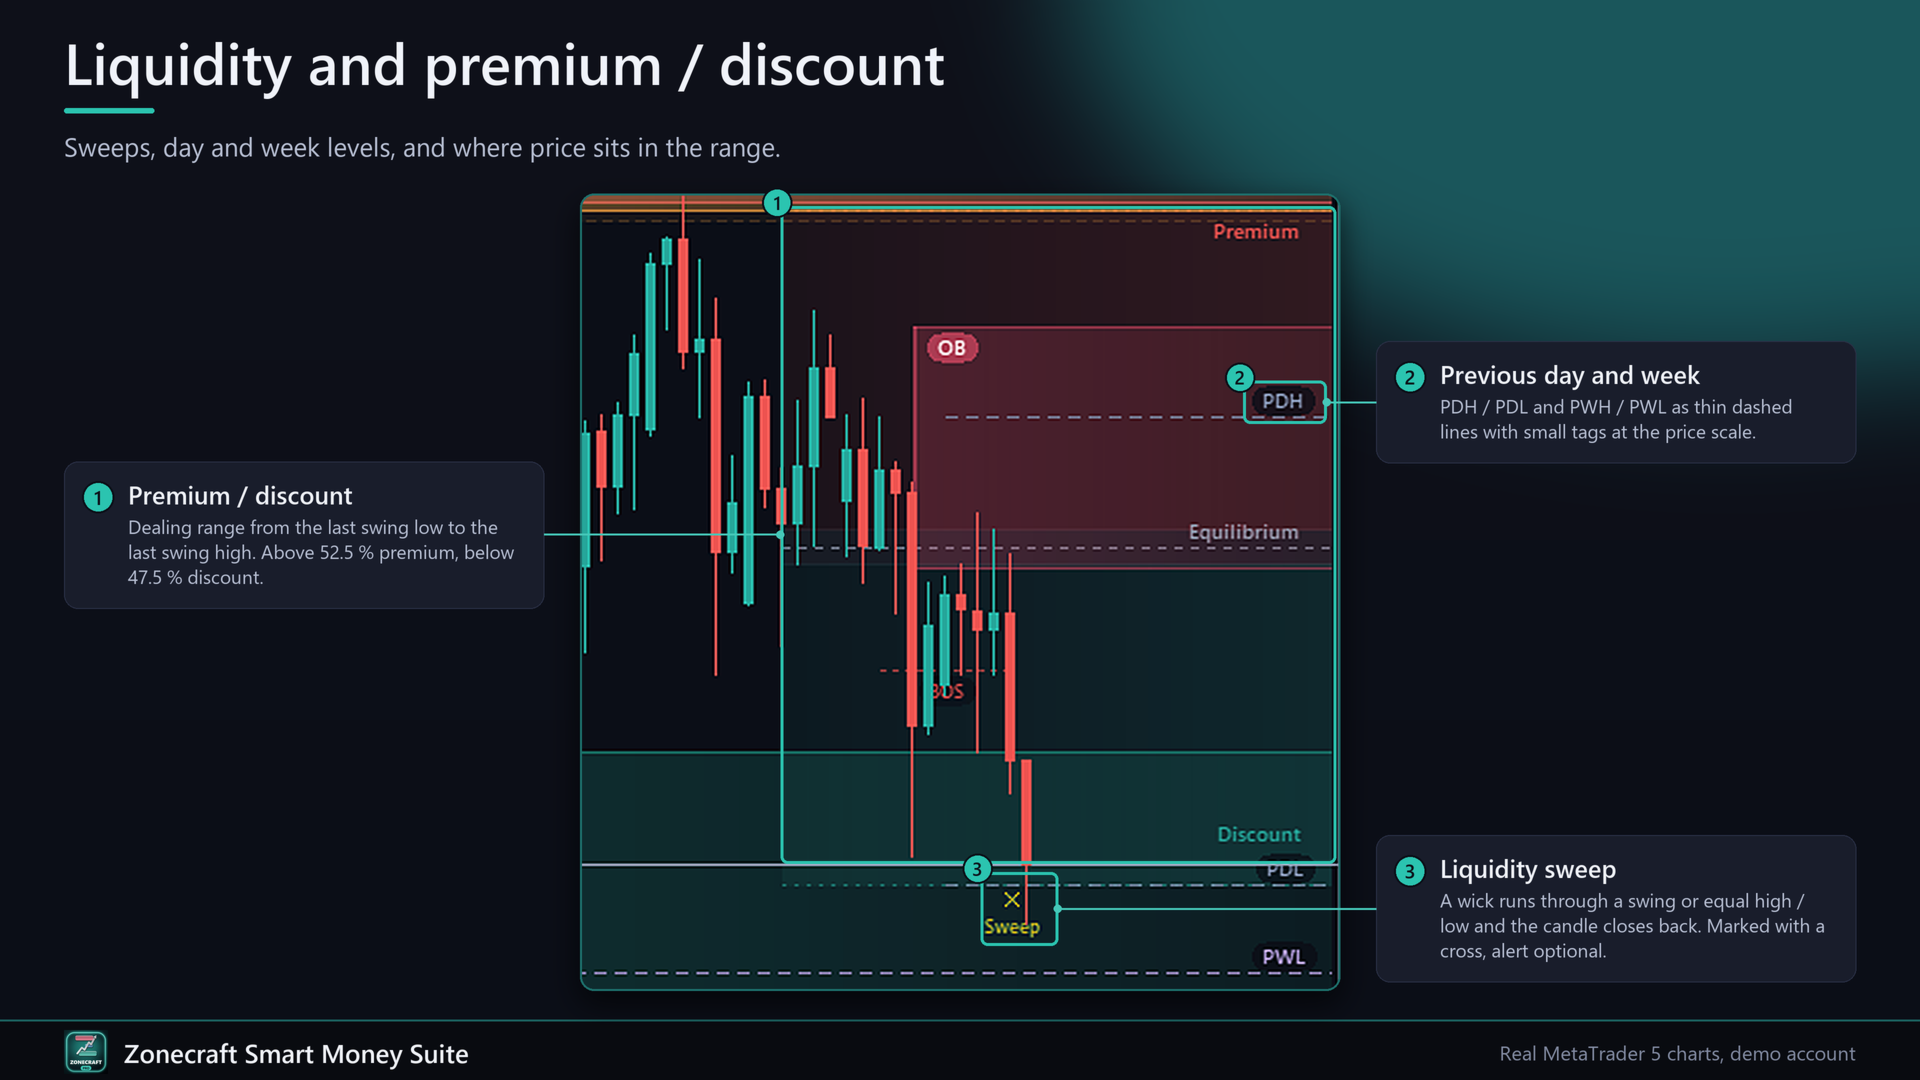
- Liquidity: equal highs and lows (EQH / EQL) with a tolerance, liquidity sweeps marked with a small cross, previous day high / low and previous week high / low.
- Premium, equilibrium and discount zones of the current dealing range.
- Higher timeframe zones: order blocks and fair value gaps of one timeframe you choose (H4 by default) drawn on the lower chart with a dashed border and a "H4 OB" label.
How every element is defined
Swing point. A candle whose high (low) is higher (lower) than the N candles before it and not exceeded by the N candles after it. N is the strength. The point is known only when those N candles have closed, so its label appears N candles later and then never moves.
BOS and CHoCH. A candle closes above the last unbroken swing high (or below the last unbroken swing low). If the structure was already bullish (bearish) this is a Break of Structure, otherwise a Change of Character. You can choose "wick" instead of "close" as the break condition. Internal breaks at the same level as a swing break are not drawn twice.
Order block. After a bullish break, Zonecraft looks at the move between the broken swing high and the break candle, takes the candle with the lowest low of that move and uses the last bearish candle at that point (up to 3 candles back) as the order block. The zone is the full candle range, or only the body if you choose. Bearish order blocks mirror this. An order block is "touched" when a later closed candle trades into it and "broken" when a candle closes beyond its far edge.
Fair value gap. Three candles where the low of the third candle is above the high of the first (bullish), the middle candle closes beyond the first candle and the gap is at least the minimum size. The gap is confirmed when the third candle closes. It extends to the right until price has filled it completely.
Equal highs / lows. Two internal swing highs (lows) whose prices differ by less than the tolerance (0.10 x ATR by default) with no higher high (lower low) between them.
Liquidity sweep. A closed candle trades through an equal high / low or a swing high / low with its wick and closes back on the other side of that level.
Premium / discount. The dealing range runs from the last swing low to the last swing high and grows with new extremes. Above 52.5 % is premium, below 47.5 % is discount, the band in between is equilibrium.
No repaint, explained exactly
- All structure points, breaks, order blocks, gaps, equal highs / lows and sweeps are calculated from closed candles only. Each closed candle is processed once, in time order. Nothing that was drawn is moved to another candle later.
- What changes over time is only the state of an existing zone, decided by later closed candles: an order block becomes touched or broken, a gap becomes partly or fully filled. Active zones also extend to the right with time.
- Swing points are confirmed N candles after the swing (the strength). This delay is the price of a result that does not change.
- The live, unclosed candle is used only for the zone entry alert, the distances in the dashboard and the "price in zone" flags of the scanner.
- Higher timeframe zones use closed higher timeframe candles only. A zone of the running H4 candle appears when that H4 candle has closed.
Dashboard
- Trend of the swing structure on M15, H1, H4 and D1 for the chart symbol.
- Last swing and last internal break (BOS or CHoCH, direction, price, candles ago).
- Nearest order block or gap above and below the price with its range and the distance in points, the zone price is in right now and the position in the dealing range (for example "Discount 31%").
- Scanner for up to 12 symbols of your list: structure bias and "OB" / "FVG" flags when price is inside a zone of that symbol. A click on a symbol switches the chart. Broker names such as EURUSD.m or .US30Cash are found automatically.
- Drag it with the mouse, collapse it with the arrow button, choose 90 to 150 % size. Light or dark colours follow your chart background. Position and collapsed state are remembered per chart.
Alerts
- New swing BOS, new swing CHoCH, internal breaks if you want them too.
- Price enters a fresh order block or an open fair value gap.
- Liquidity sweep.
- Popup, sound, push notification and e-mail, each switchable. Every event alerts once, with a minimum pause per alert type (30 s by default). Zones price is already inside when you load the indicator do not alert.
Examples of use
1. Top-down: the dashboard shows H4 and D1 bearish while H1 prints a bullish CHoCH. You know the H1 move runs against the higher structure and can wait for price to reach the H4 order block above.
2. Pullback planning: after a bullish BOS the fresh order block and an open gap below price are listed with their distance. You set an alert and do not need to watch the chart.
3. Liquidity: equal highs above price are marked as EQH. If a candle wicks through them and closes back below, a sweep cross appears and an alert can tell you.
4. Watchlist: the scanner shows which of your symbols has price inside a zone right now. One click opens it on the same chart.
Quick start
1. Attach Zonecraft SMC Suite to any chart. The defaults work on forex, metals, indices and crypto from M1 to D1.
2. Choose the higher timeframe for the overlay (H4 by default; it must be higher than the chart).
3. Enter your scanner symbols (comma separated) and switch on the alerts you need.
4. Fewer zones: reduce "Max. active order blocks per side" and "Max. open FVGs per side" or raise the FVG minimum size. More structure detail: lower the swing strength.
Performance
Only new closed candles are calculated (incremental). 1,000 candles are analysed by default (100 to 5,000). All zones and labels are drawn on one chart canvas behind the candles, so the chart stays responsive, and everything is removed when you delete the indicator. No DLL, no web requests, no files.
FAQ
Does it repaint?
No result on closed candles is moved or deleted later, see "No repaint, explained exactly". A zone may change its state (touched, broken, filled) when later candles close. That is the information you want to see.
Why does a swing label appear a few candles late?
A swing high is only a swing high when the following N candles have not exceeded it. Lower the strength for faster, smaller swings.
Why do I see fewer zones than with other tools?
Broken order blocks and filled gaps are removed by default and the number of active zones per side is limited. You can show broken zones faded and raise the limits.
Can I use it in an Expert Advisor?
The indicator draws on the chart and has no buffers. It is made for visual analysis and alerts.
Does it work in the Strategy Tester?
Yes, in visual mode with all drawings. The scanner is switched off in the tester because other symbols are not loaded there.
Is there a free version?
Yes: Zonecraft Structure (market structure BOS / CHoCH and fair value gaps with a small dashboard). It shares the same rules.
Important
Zonecraft is an analysis tool, not a signal service. Zones show where price reacted or left an imbalance in the past. They do not predict where price will turn and no result is promised. Trading leveraged products carries a high risk of loss. Test the settings on a demo account first.
Input parameters
General: language (auto, English, German), bars to analyse (1000), colour theme (auto, dark, light), label font size (8), zone opacity (60 %).
Market structure: show swing structure, swing strength (10), show internal structure, internal strength (3), break confirmation (close or wick), label swing points HH / HL / LH / LL.
Fair value gaps: show, minimum size measured in ATR fraction or points, minimum ATR fraction (0.25), minimum points (0), max. open FVGs per side (4), filled FVGs (remove or keep faded).
Order blocks: show, order blocks from swing breaks, internal breaks or both, use candle body, max. active order blocks per side (3), broken order blocks (remove or keep faded).
Liquidity: equal highs / lows, tolerance (0.10 x ATR), sweep markers, previous day high / low, previous week high / low.
Premium / discount: show zones.
Higher timeframe overlay: show, timeframe (H4), order blocks, fair value gaps, max. zones per type and side (2).
Dashboard: show, start position X / Y, size, scanner symbols, scanner timeframe (chart timeframe by default).
Alerts: swing BOS, swing CHoCH, internal breaks, zone entry, liquidity sweep, popup, sound and sound file, push, e-mail, minimum seconds between alerts of one type (30).
Colours: bullish / bearish structure, bullish / bearish FVG, bullish / bearish order block, liquidity, previous day, previous week, premium, discount, equilibrium.