Ema Cross Solution multi timeframe
- インディケータ
-
SISSA TECHNOLOGY
 Forget dodgy DIY setups and laggy websites. At SISSA TECHNOLOGY, they code for those who want results.
- バージョン: 53.0
- アクティベーション: 5
EMA CROSS
English EN
EMA CROSS — Separate observed crossings from possible future crossings
A moving average crossing is a reference point. Interpreting it also requires an understanding of its context, how it develops and how earlier cycles behaved.
EMA CROSS is a MetaTrader 5 indicator dedicated to tracking exponential moving average crossings. It organises current events, their history and estimates of upcoming crossings into separate views.
What is happening now
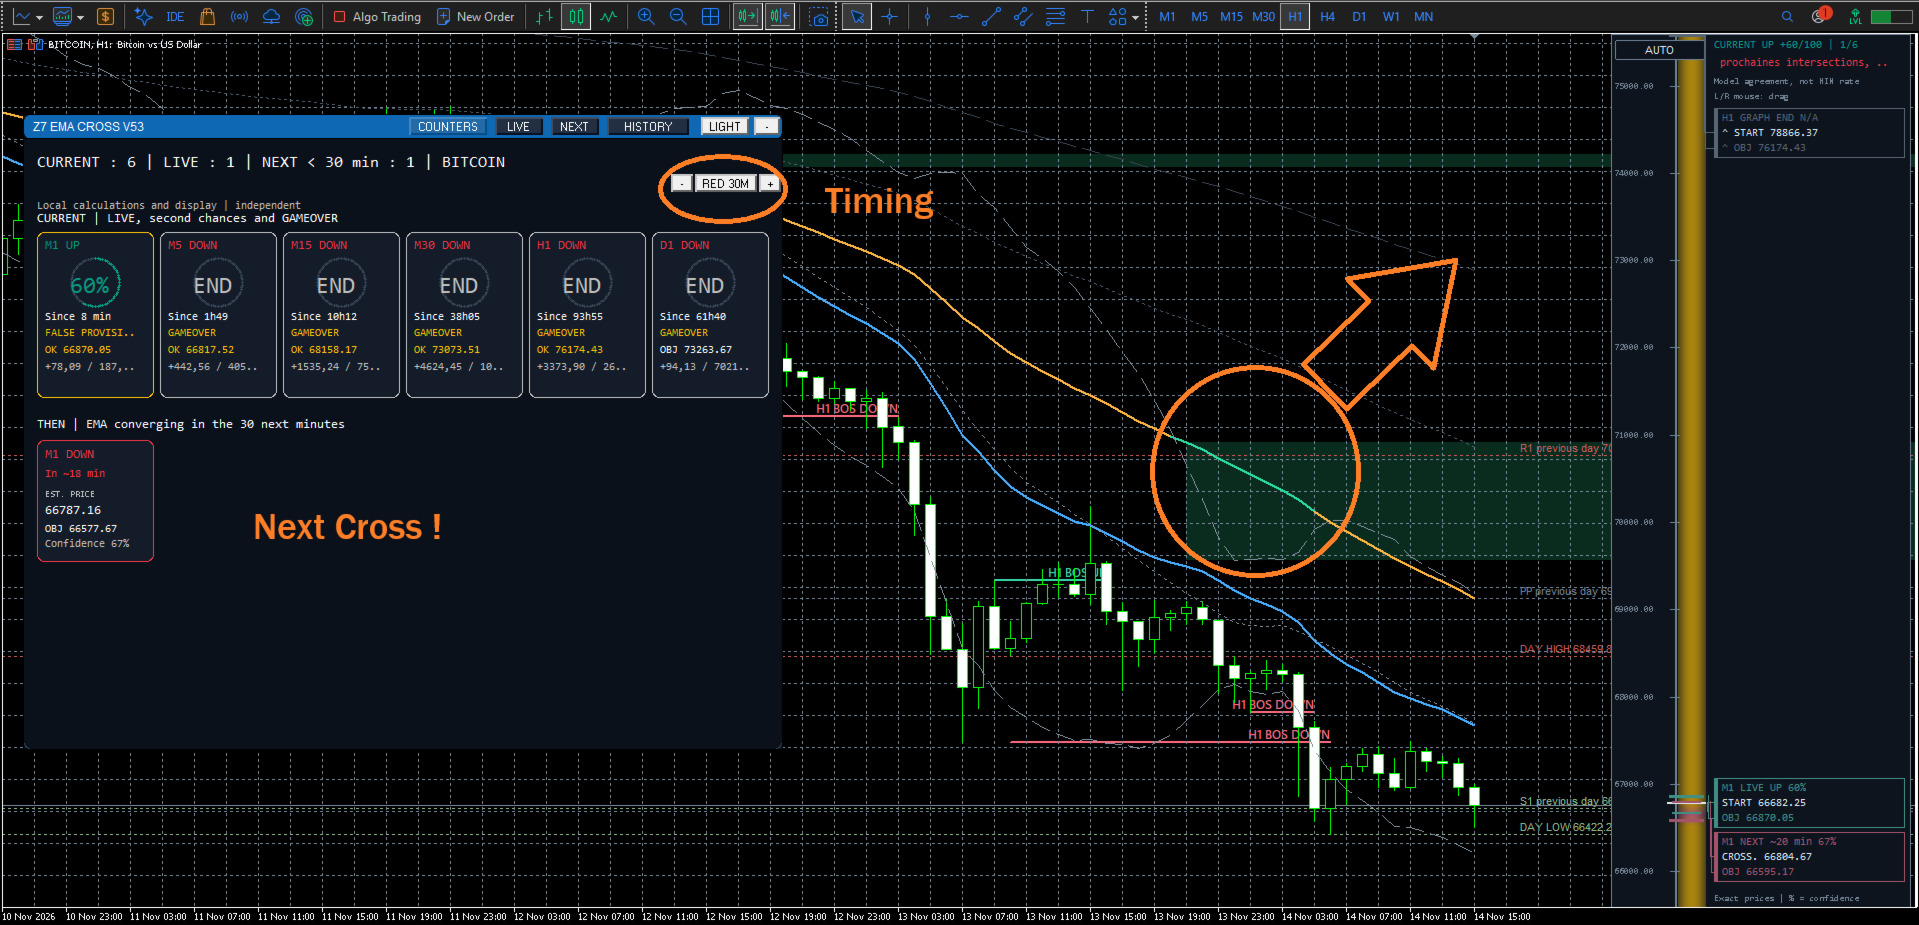
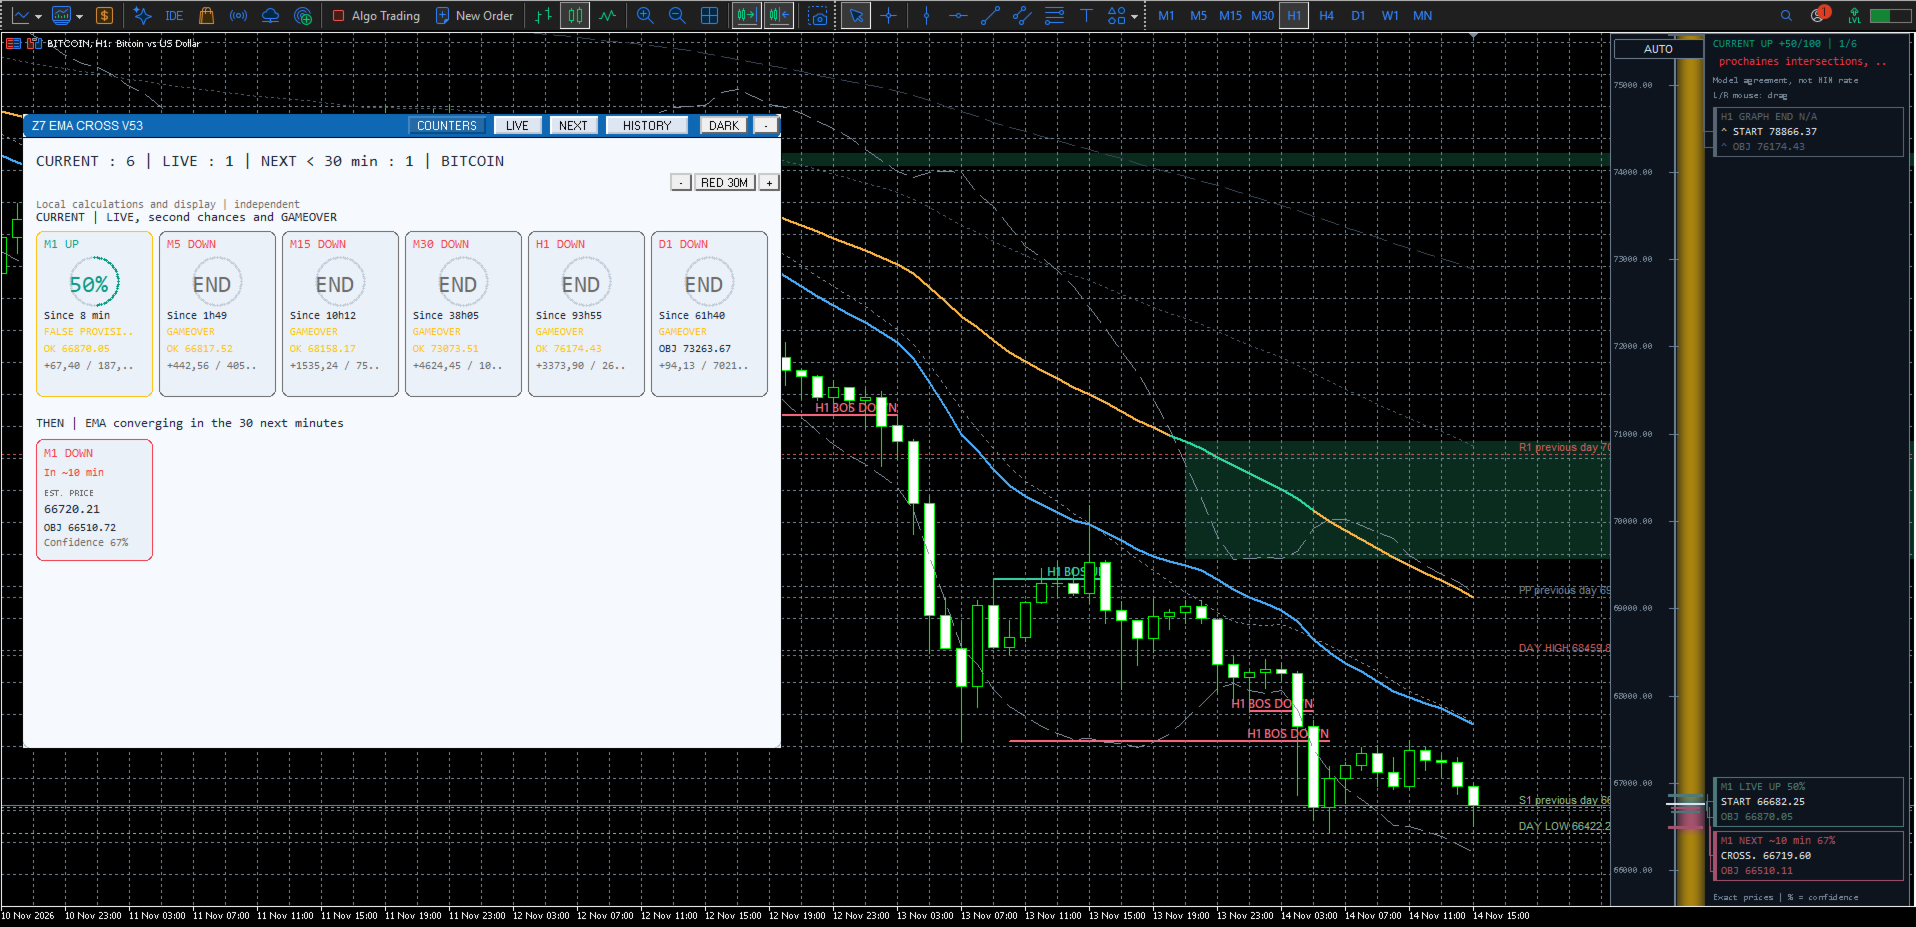
The counters and LIVE view show the crossings being tracked across several timeframes: direction, cycle state, duration, movement in points and a statistical target when available.
Completed events remain identifiable through their GAME OVER state. Attempts that may resume can appear as second chance situations under the model’s rules.
This presentation helps distinguish an active event, provisional deterioration and a cycle that has already ended.
What could happen next
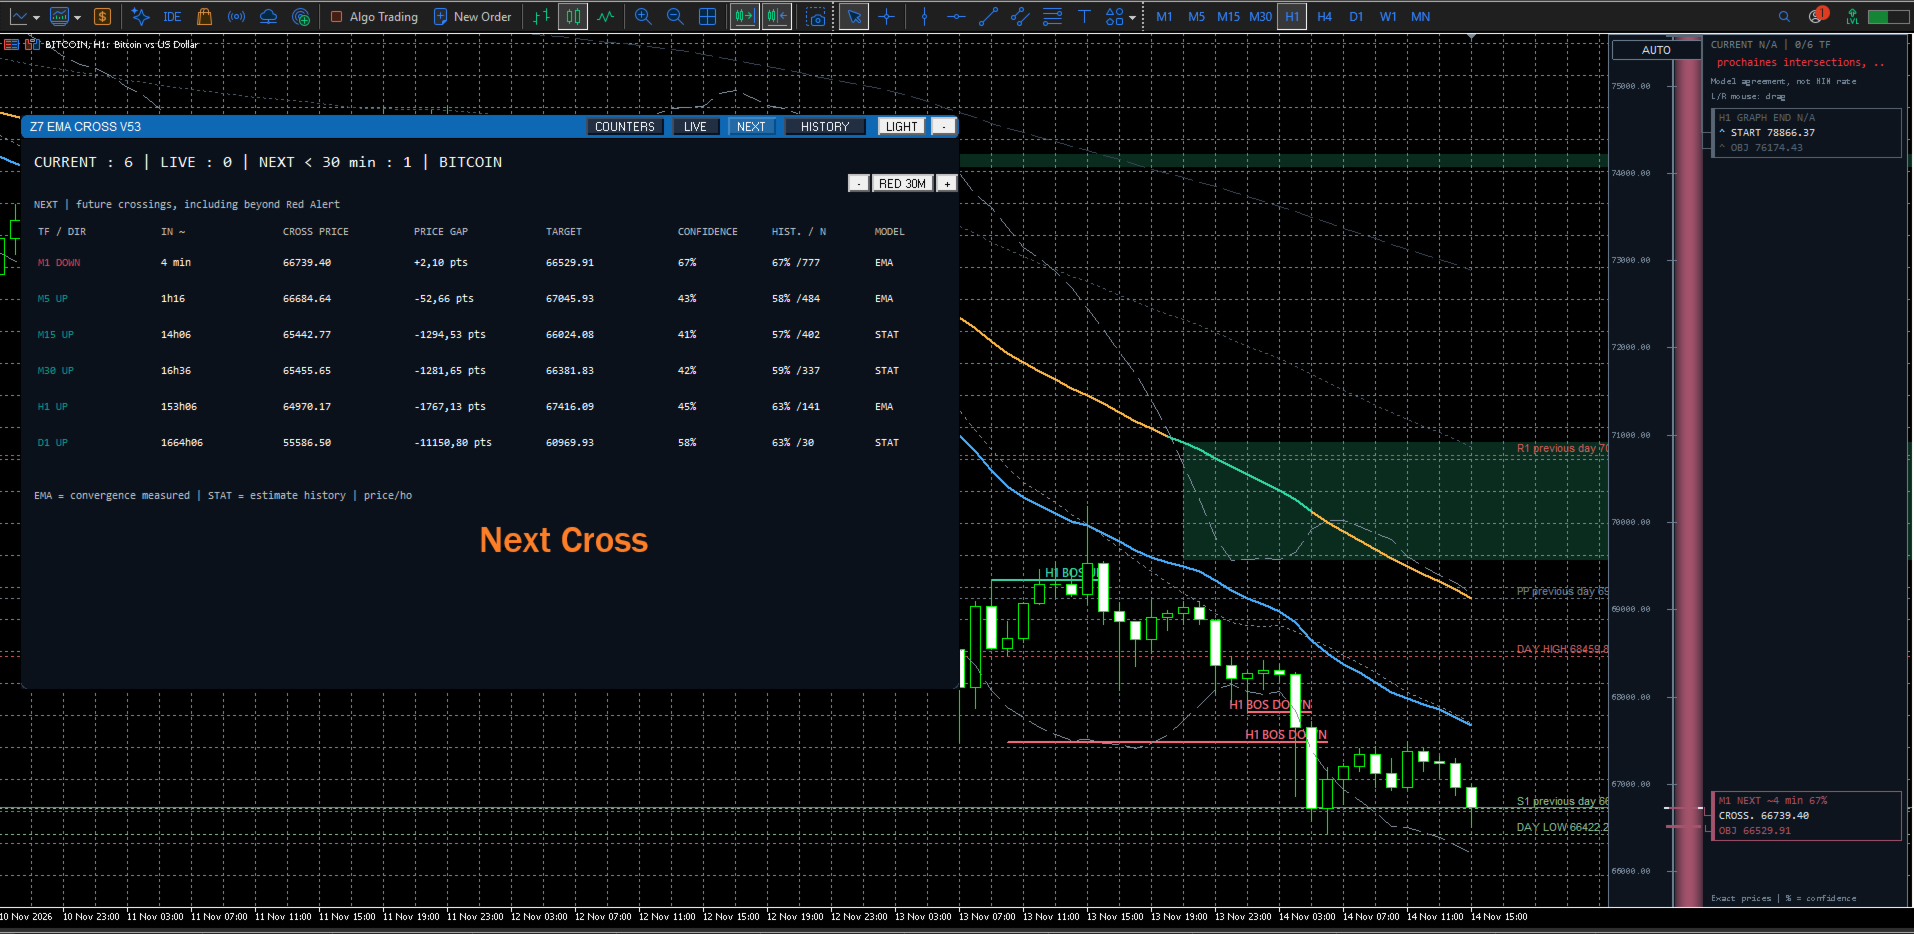
The NEXT view presents estimates of upcoming intersections: an estimated delay, crossing level, target and associated score when the data allows.
The model distinguishes measured EMA convergence from estimates derived from history. A forecast can change or disappear as the market evolves. It does not guarantee a particular price or a particular time.
History for a broader perspective
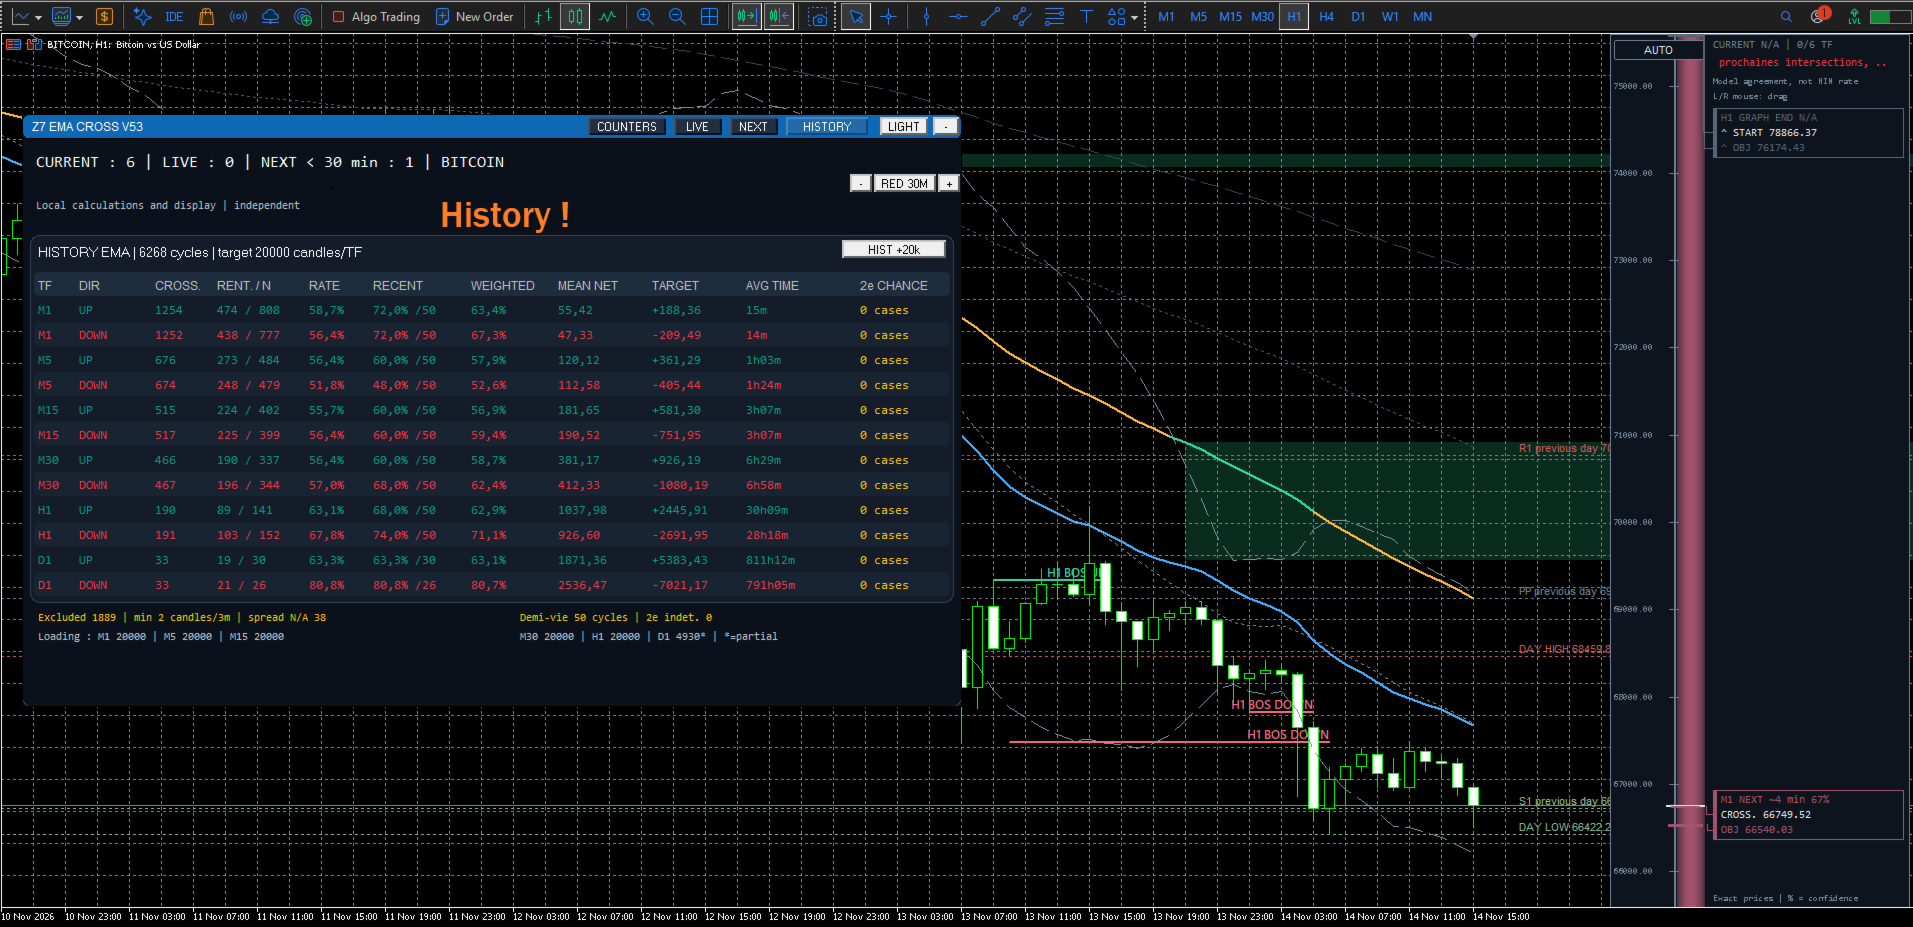
The HISTORY view lets you compare cycles by timeframe and direction. It presents historical results under the model’s criteria, recent observations and measures weighted according to their age.
Sample counts and data coverage help put the percentages into context.
Reference points directly on the chart
EMA CROSS can display cycle origins, targets, excursions already observed and confirmed breaks of structure. A side scale brings together reference points from the tracked timeframes, with vertical zoom controls.
The crossings edition keeps the chart focused on this function, without a STREAK histogram in a lower pane.
Who it is for
EMA CROSS is designed for traders who use moving averages to read the market and want a structured view of current and possible crossings.
Scores are model estimates and targets are statistical reference levels. They are neither a promise of market movement nor a guarantee of profit. EMA CROSS does not place orders.