CLOUDPips Kaze
- インディケータ
-
Ekkrit Foonngern
 Helping traders find a strategy that fits their style, based on real testing and honest results.
Each strategy comes with a step-by-step setup guide, 20 years of backtest data and ready-to-use preset files. - バージョン: 1.0
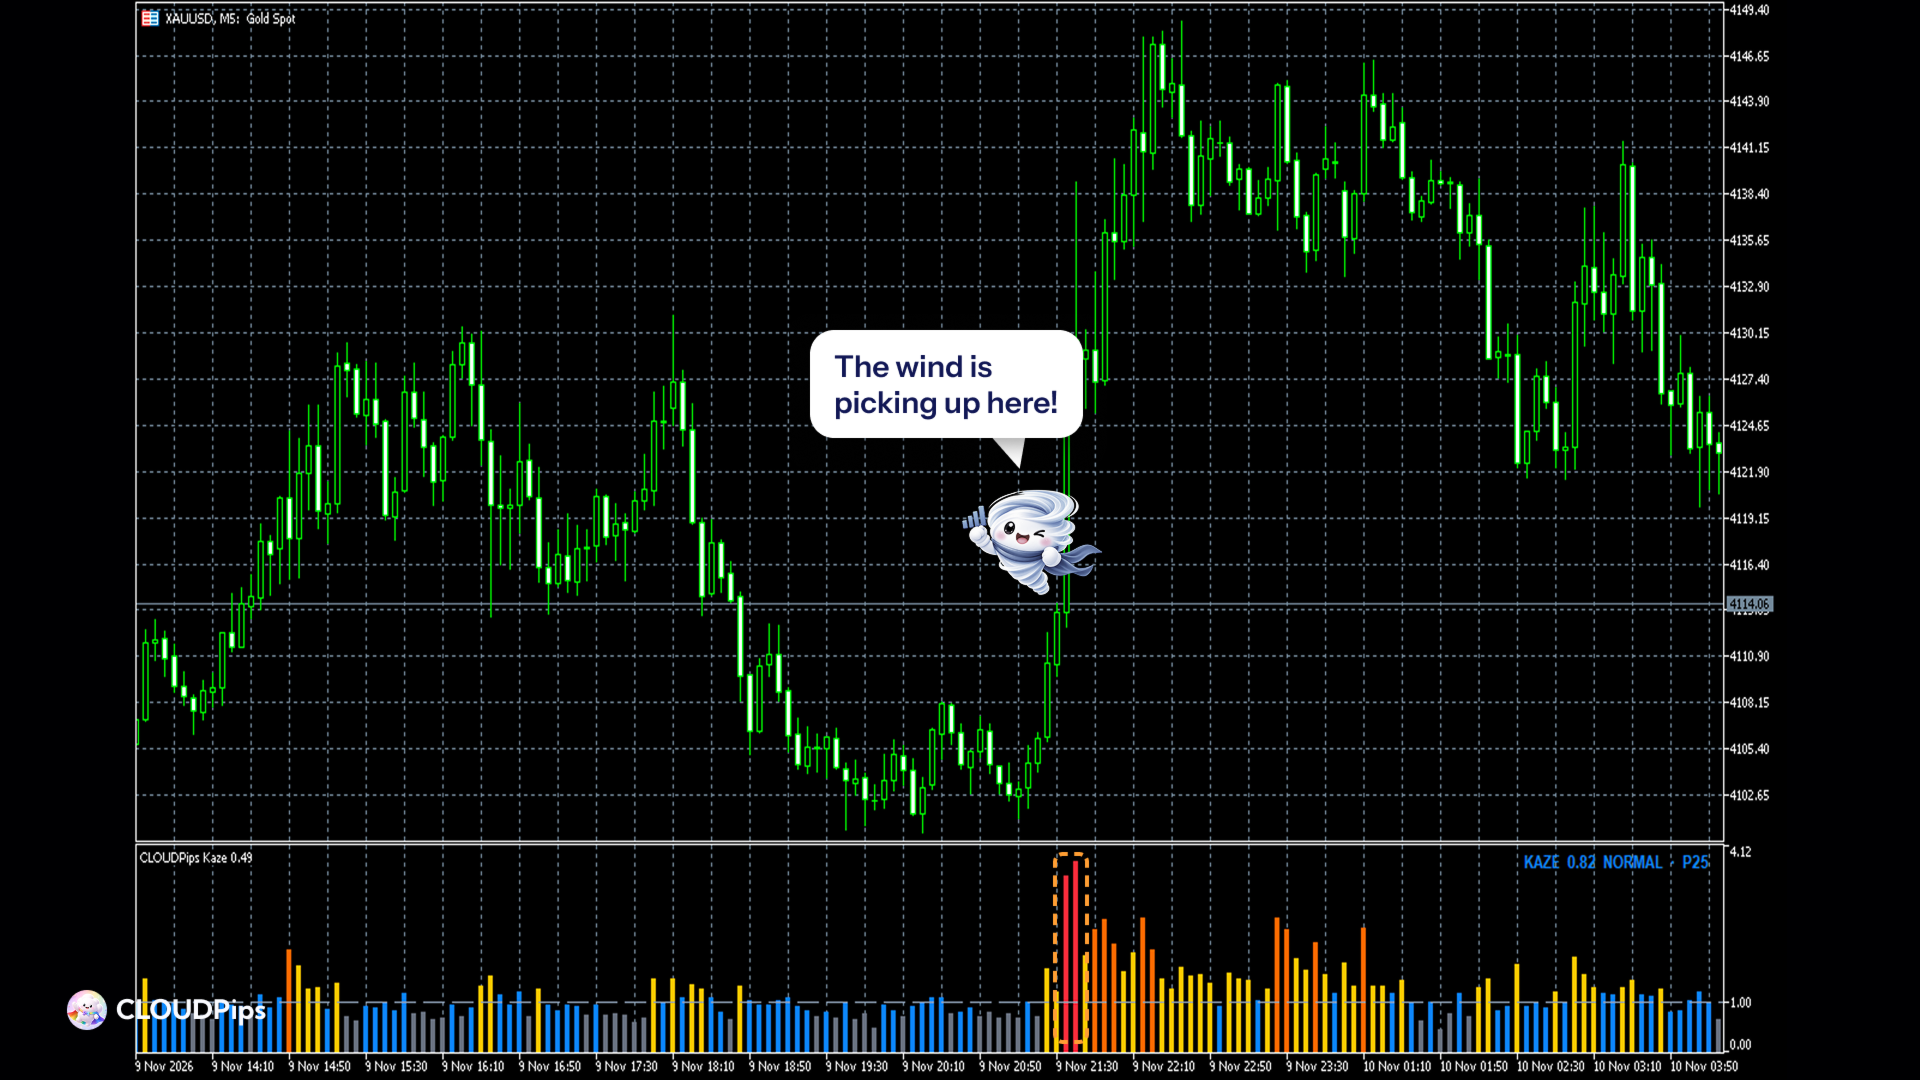
CLOUDPips Kaze answers one question before you trade: is the market really moving right now, or is it just quiet?
Ever seen price break out, only to snap back minutes later? Many false breakouts happen when the market is quiet. Kaze makes that quiet visible.
How it works
- Kaze combines each candle's tick volume and its range (high − low).
- It compares them with what is normal for the same hour of the day over the last 20 days (adjustable).
- 1.0 = normal for that hour. The Asian session is always quieter than the New York open, so each hour is compared with itself, not with the whole day.
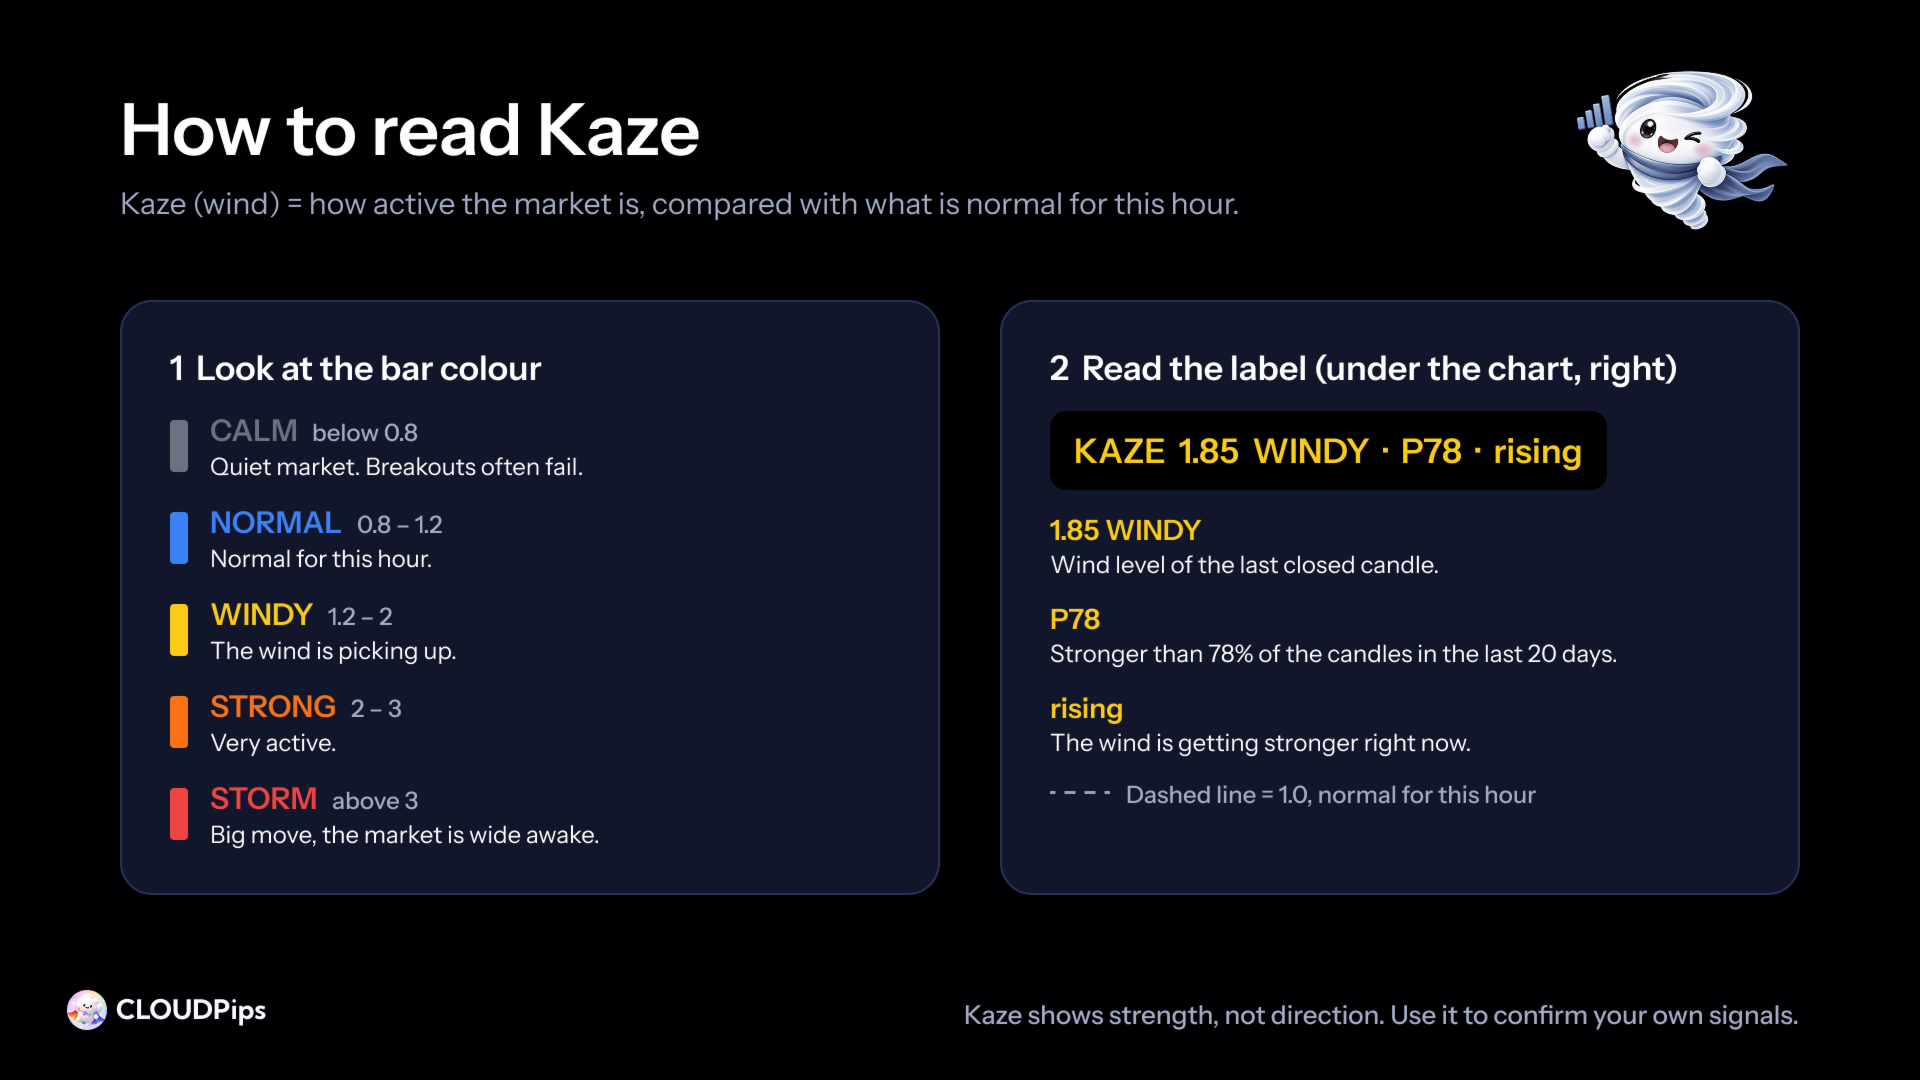
Five levels, five colours
| Kaze | Level | Colour | What it means |
|---|---|---|---|
| below 0.8 | CALM | gray | Quieter than usual for this hour. Breakouts here often fail: wait. |
| 0.8 – 1.2 | NORMAL | blue | A normal market for this hour. |
| 1.2 – 2 | WINDY | yellow | The wind is picking up: more traders than usual. A breakout has real activity behind it. |
| 2 – 3 | STRONG | orange | Very active, often around the London or New York open or news. |
| above 3 | STORM | red | A big move is happening right now. Fast prices and wider spreads: keep your stop loss in place. |
A dashed line marks 1.0 (normal).
The label (under the chart, right) In the Kaze window under the price chart, on the right. It always reads the last closed candle:
- its Kaze value and level, e.g. KAZE 1.85 WINDY
- its percentile over the last 20 days, e.g. P78 : stronger than 78% of recent candles
- rising when the wind is picking up (Kaze is above the median of the 6 candles before it)
How traders use it
- Confirm a breakout: a breakout with WINDY or stronger wind has real activity behind it; a breakout in a CALM market is more likely to fail.
- Confirm a trend entry: wait until the wind is at least NORMAL.
- See the session at a glance: when the market wakes up and when it goes quiet.
Kaze measures strength, not direction. It never tells you to buy or sell: use it to confirm your own signals, not as a signal on its own.
The same filter as our Expert Advisors Kaze is the filter inside several CLOUDPips Expert Advisors, where it is on by default: the bots take a signal only when the wind is at least normal. In our research, the signals Kaze skipped were losing trades as a group. This indicator lets you see that filter on your own chart, free.
Inputs
- Kaze_Days (default 20): the number of days that define "normal" for each hour.
- History_Bars (default 10000): how many candles to draw. Older candles are left empty.
- Show_Label (default true): show the value label (in the Kaze window, on the right).
Recommended settings
- Timeframe: works on any timeframe; designed for M5 to H1.
- Symbol: researched on XAUUSD (gold); it works on any symbol your broker sends tick volume for.
- History: Kaze needs some history before it draws (about 10 days of candles for each hour), so the oldest part of the chart stays empty. That is normal.
Good to know
- Closed candles keep their value; only the forming candle updates with each tick.
- Hours follow your broker's server time, so "normal" is learned from your own broker's data.
- Kaze does not make every trade a winner. It helps you skip the moments most likely to be false.
- Free, no time limit, no account lock.
Trading involves risk. Kaze is an analysis tool, not a trading signal.