Rez Market Scanner
- インディケータ
-
John John Gutierrez Vivas
 Español:
Programador MQL4/MQL5 con experiencia en trading. Desarrollo Expert Advisors, indicadores y herramientas a medida para MetaTrader 4 y 5.
• Convierto tu estrategia en un EA
• Indicadores personalizados y alertas
• Gestores de riesgo y herramientas para cuentas de fondeo - バージョン: 1.0
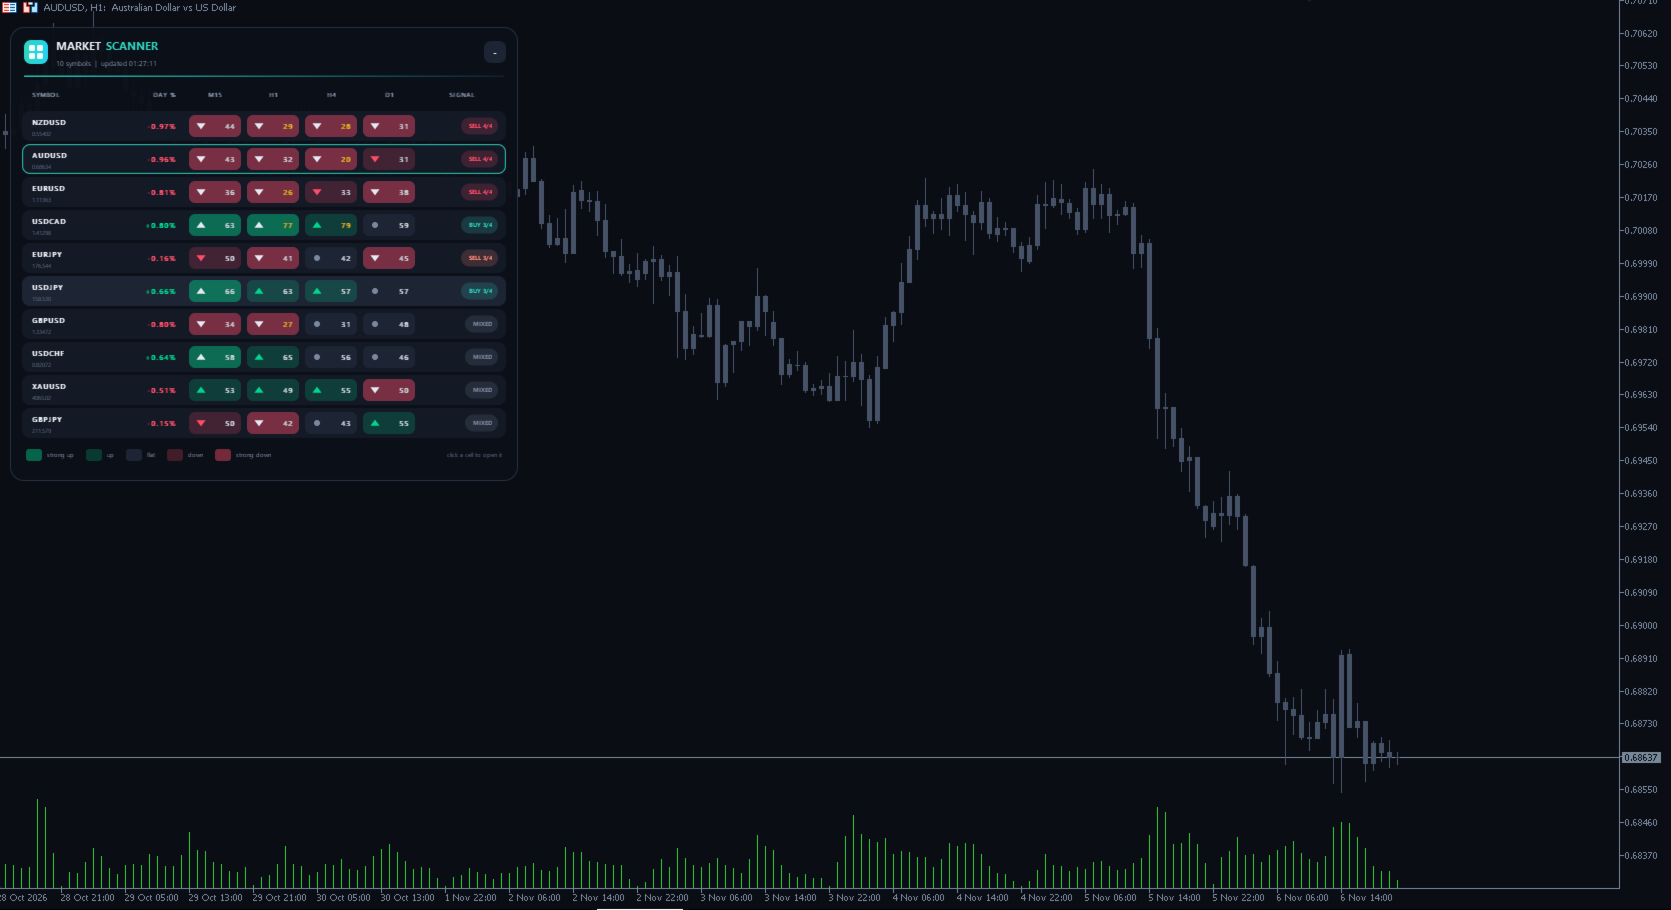
Rez Market Scanner is a free dashboard for MetaTrader 5 that shows the trend of up to 20 symbols on up to 6 timeframes at once. In seconds you see which pairs are trending, how strong the trend is, where the RSI is and how much each symbol moved today. One click opens the one you want.
What the panel shows
- SYMBOL: name and current price. The symbol of your chart has a colored border.
- DAY %: change since the daily open of your broker.
- Timeframe cells (M15, H1, H4 and D1 by default): trend, strength and RSI.
- SIGNAL: how many timeframes agree (BUY 4/4, SELL 3/4 or MIXED).
How to read each cell
- Green arrow up: uptrend (fast EMA above the slow EMA and price above the slow EMA).
- Red arrow down: downtrend.
- Gray dot: no clear trend.
- Strong color: strong trend (the EMAs are at least 1 ATR apart). Soft color: young or weak trend.
- Number: RSI of that timeframe. It turns yellow above 70 or below 30.
How to use it
1. Look at the top rows: they are the clearest trends (BUY 4/4 or SELL 4/4).
2. Prefer cells with a strong color on H4 and D1.
3. If the RSI is yellow, the move is stretched: wait for a pullback.
4. Click the cell of your trading timeframe and look for your entry on the chart in the direction of the scanner.
5. If you trade trends, skip symbols marked MIXED.
Features
- Rows sorted by the clearest trends (optional)
- Click a symbol to open it, or a cell to open it on that timeframe
- Symbols from your own list or from the Market Watch, with broker suffix support (EURUSDm, EURUSD.raw...)
- Any timeframes you like: M1 to MN1, up to 6
- Modern panel that can be moved, minimized and resized
- Light on resources: all values are calculated inside the indicator
Main inputs
- Symbols / Broker suffix / Max symbols: what to scan
- Timeframes: which timeframes to show
- Fast EMA / Slow EMA (21 / 55), RSI period (14)
- Strong trend (1.0 ATR): from what EMA distance a trend is shown as strong
- Panel size: set 1.2 or 1.5 on high resolution screens
Note: in the strategy tester only the chart symbol is scanned, because the tester does not load other symbols. On a live chart it scans the whole list.
This is a technical analysis tool and does not guarantee profits. Always use risk management.
Do you like it? Please leave a review. It takes one minute and helps me keep making free tools. If you have questions or ideas, write them in the comments and I will answer.
Check my other tools: https://www.mql5.com/en/users/saintseiyarez-gmail/seller