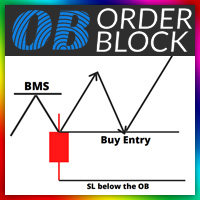
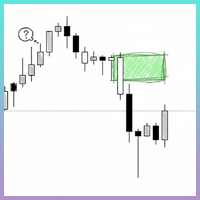
Real liquidity zones
- インディケータ
- バージョン: 3.0
- アクティベーション: 5

Multi-timeframe high-resistance liquidity-zone identification — combining a union of multiple methods + multi-timeframe confluence + strength scoring to mark the key levels where price is most likely to reverse after sweeping liquidity.
01Purpose & Positioning
A liquidity-zone visualization indicator built for domestic futures (MT5/CTP) and forex (MT4/MT5), helping traders quickly lock onto:
Genuine High-Resistance Zones
Scores "multi-timeframe confluence + volume participation/absorption" to tell apart the key zones that will actually block price.
As Complete as Possible
Takes a union of multiple methods, covering larger-level swing points, equal-high/equal-low pools, and previous-day/week highs and lows to reduce omissions.
Sweep-and-Reverse Candidates
Distinguishes "intact, not swept" from "already swept" zones to help judge the next spot that may reverse after being swept.
02Core Methods
Four principles: Multi-method union (complete) · Multi-timeframe confluence (genuine) · Strength scoring · State filtering
① Multi-Method Union
- Swing points: lookback of 5 / 10 / 20 / 50 across multiple scales
- Liquidity pools: clustering of nearby swing points (equal highs/lows, double tops/bottoms)
- Key prices: previous-day high/low PDH/PDL, previous-week high/low PWH/PWL
② Multi-Timeframe Confluence
- Reads M15 / M30 / H1 / H4 simultaneously
- D1 / W1 serve as background key prices
- The more timeframes confirm a zone, the higher its strength
③ Strength Score (0–100)
④ State Filtering
- Hides zones invalidated by a confirmed close above/below
- Merges overlapping zones of the same direction and caps the max height (to avoid one giant color band)
- Uses different colors for "intact, not swept" vs. "already swept"
03Comparison with the Previous Generation (Wing real Liquidity)
| Aspect | Previous · Wing real Liquidity | New · WingLiquidityZones |
|---|---|---|
| Data Basis | Volume × range (single combined metric) | Multi-timeframe + dual volume metrics (participation volume×range / absorption volume÷range) |
| Detection Method | Single lookback window (20) extreme bars + reverse-bar extreme band | Multi-lookback swing points + equal-high/low clustering + previous-day/week key prices |
| Timeframes | Only the current chart timeframe | M15 / M30 / H1 / H4 (+D1/W1 background), multi-timeframe confluence |
| Coverage | Gaps present (local relative extremes miss larger levels) | Union of multiple methods, visibly fewer omissions |
| Genuineness Judgment | No scoring; relies only on the single "not broken" condition | Strength score 0–100 combining confluence / touch / volume / freshness |
| Display Quality | Many overlapping bands, cluttered chart | Merging + height cap + hide broken + count limit — clean and readable |
| State Distinction | Only "broken or not" | Intact vs. swept, four customizable colors |
| Platform | MT4 only | MT4 + MT5 |