Auto 123 Fibonacci Pattern Tool
- インディケータ
- バージョン: 1.1
- アクティベーション: 5

The Architecture of Market Geometry
Financial markets move in a continuous sequence of expansions and contractions, leaving behind a trail of geometric ratios. Uncovering these hidden harmonic patterns manually is a labor-intensive and subjective process. It transforms the art of structural market analysis into a precise, automated science.
Operating as an advanced institutional-grade charting environment, this tool is designed to systematically extract market noise, isolate dominant price waves, and instantly project a dynamic matrix of retracement and extension zones. It bridges the gap between discretionary harmonic analysis and strict, mathematically driven market positioning.
Primary Architectural Pillars
1. Dynamic Wave Recognition Engine
The system does not react to every tick; it parses the market for structural integrity. Utilizing an integrated, customizable ZigZag algorithm, it filters out microscopic volatility to define true market swings.
- Adaptive Depth & Deviation: Users maintain total control over the fractal scale of the analysis, dictating exactly what magnitude of price action qualifies as a structural swing.
- Historical Memory Allocation: The system dynamically buffers an exact user-defined number of historical swings, maintaining a clean visual environment while preserving enough contextual data to map macro and micro cycles simultaneously.
2. The Harmonic Projection Matrix
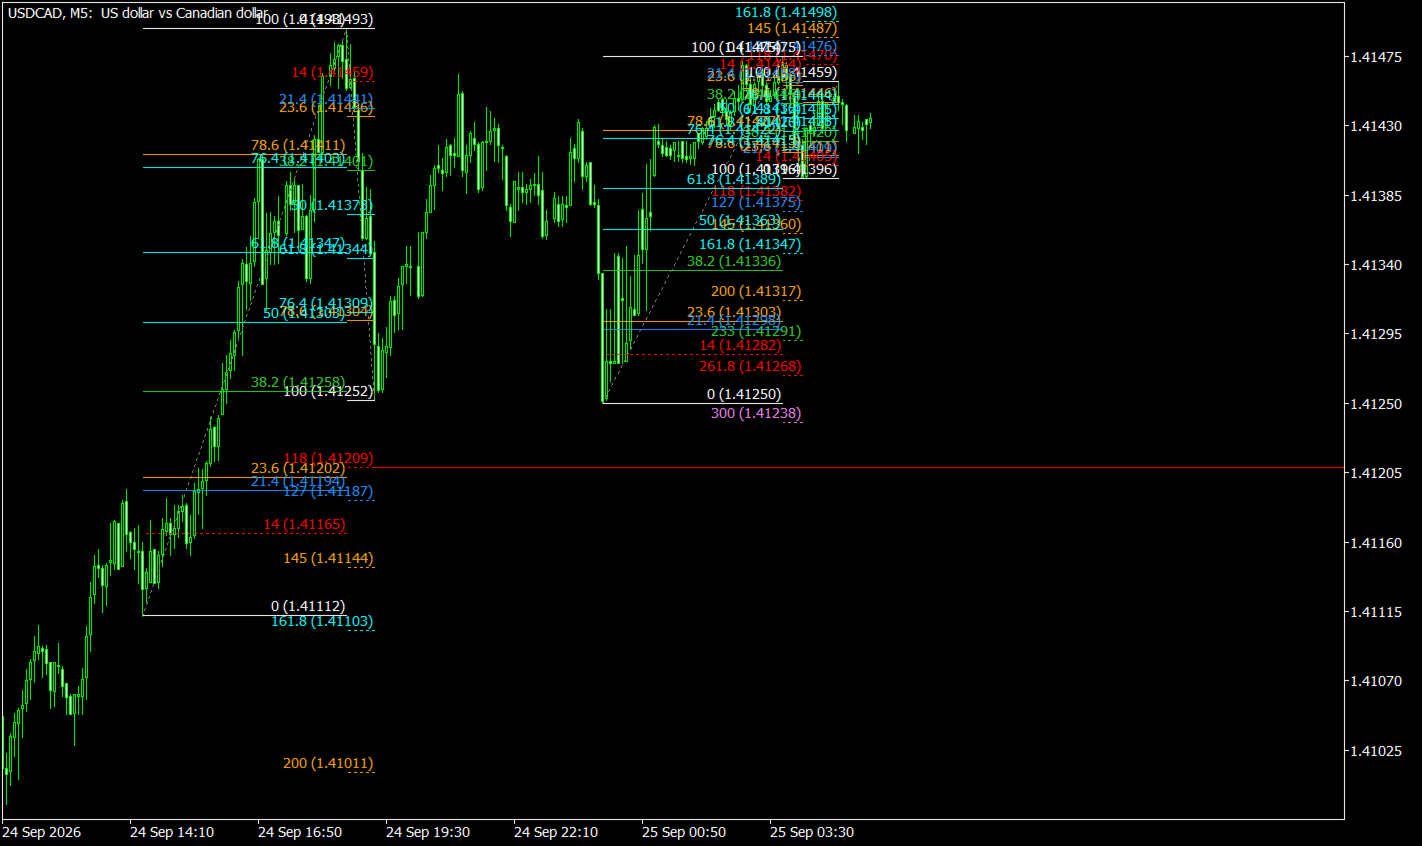
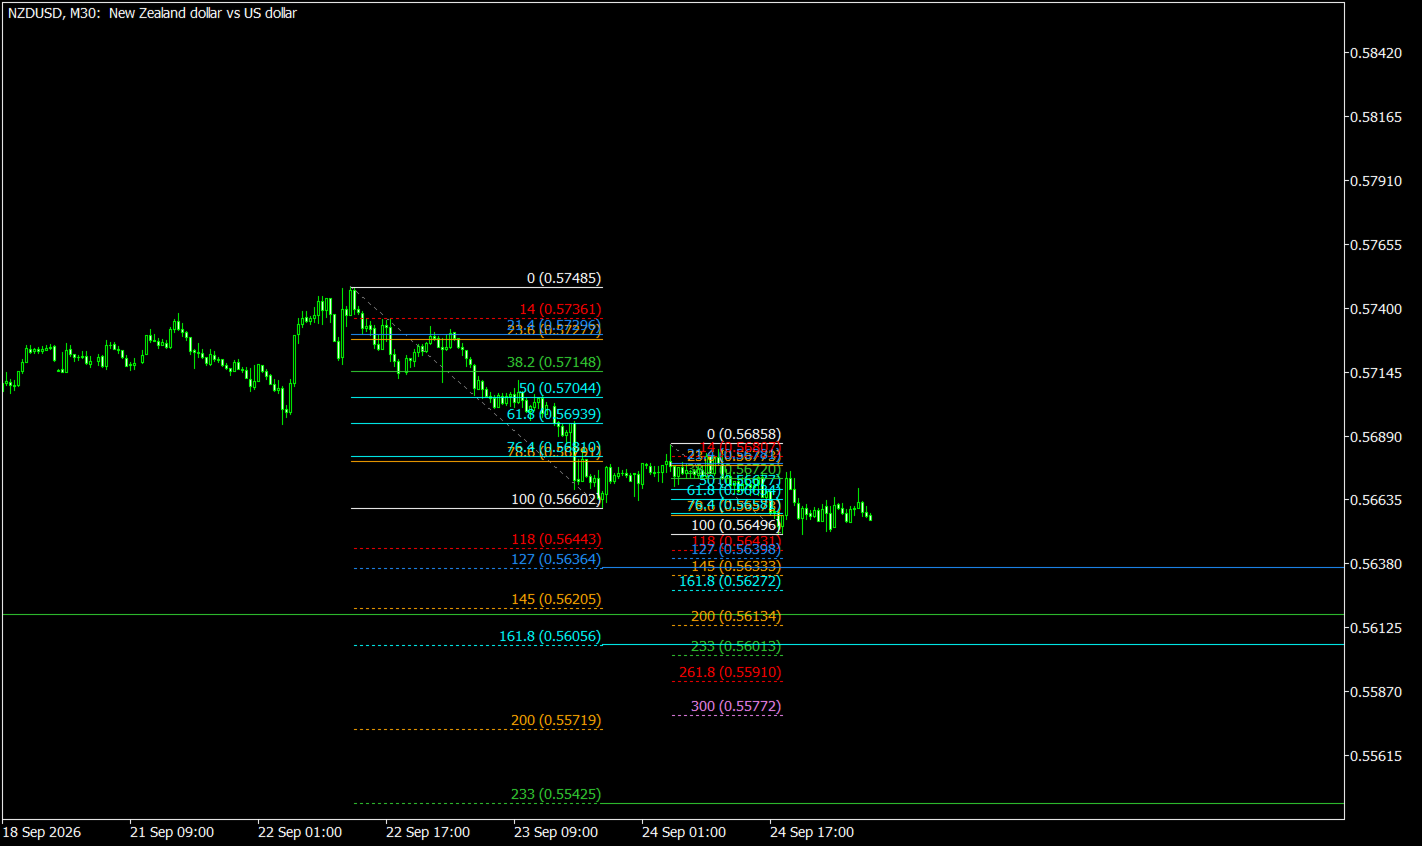
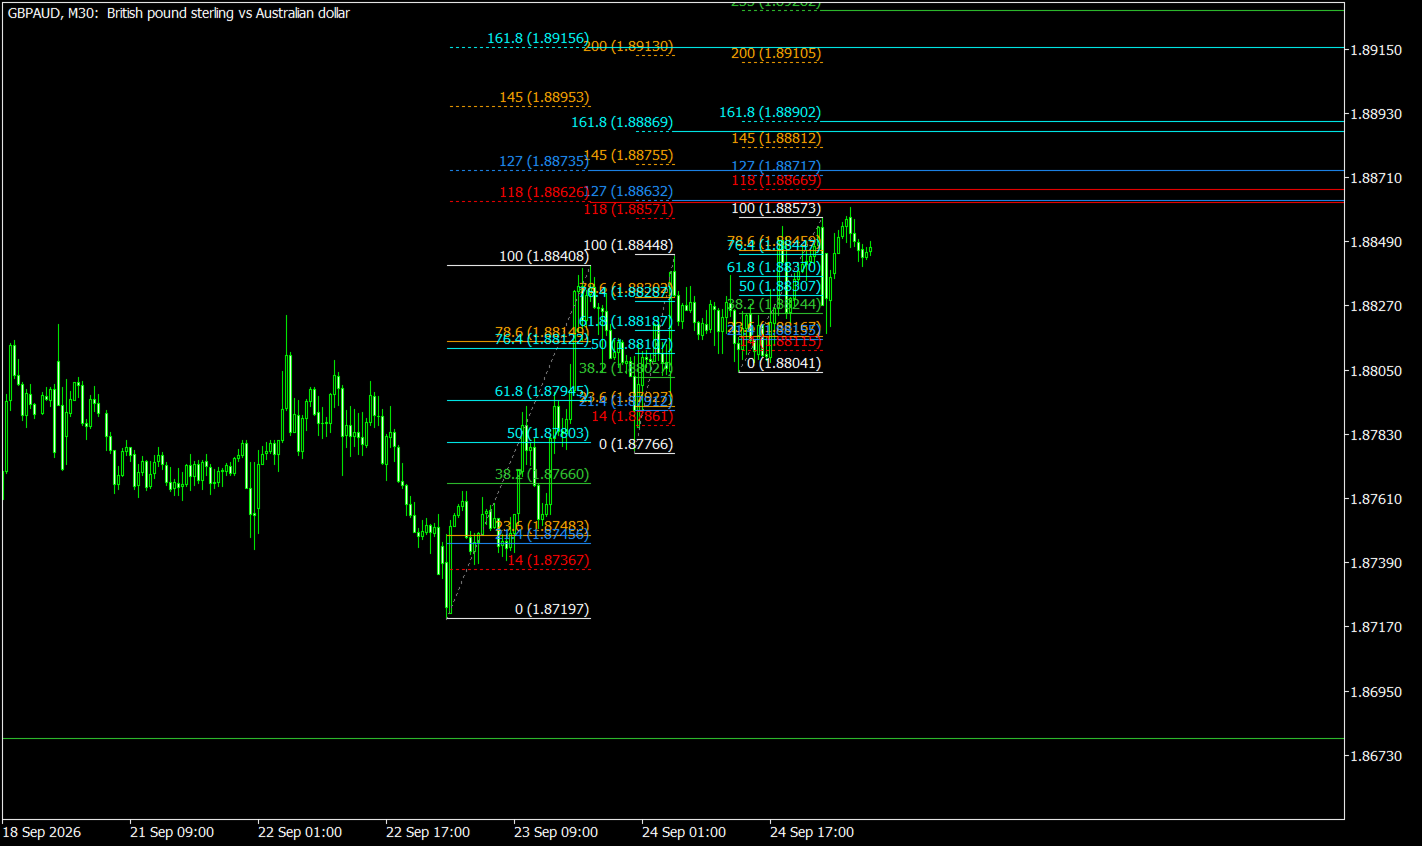
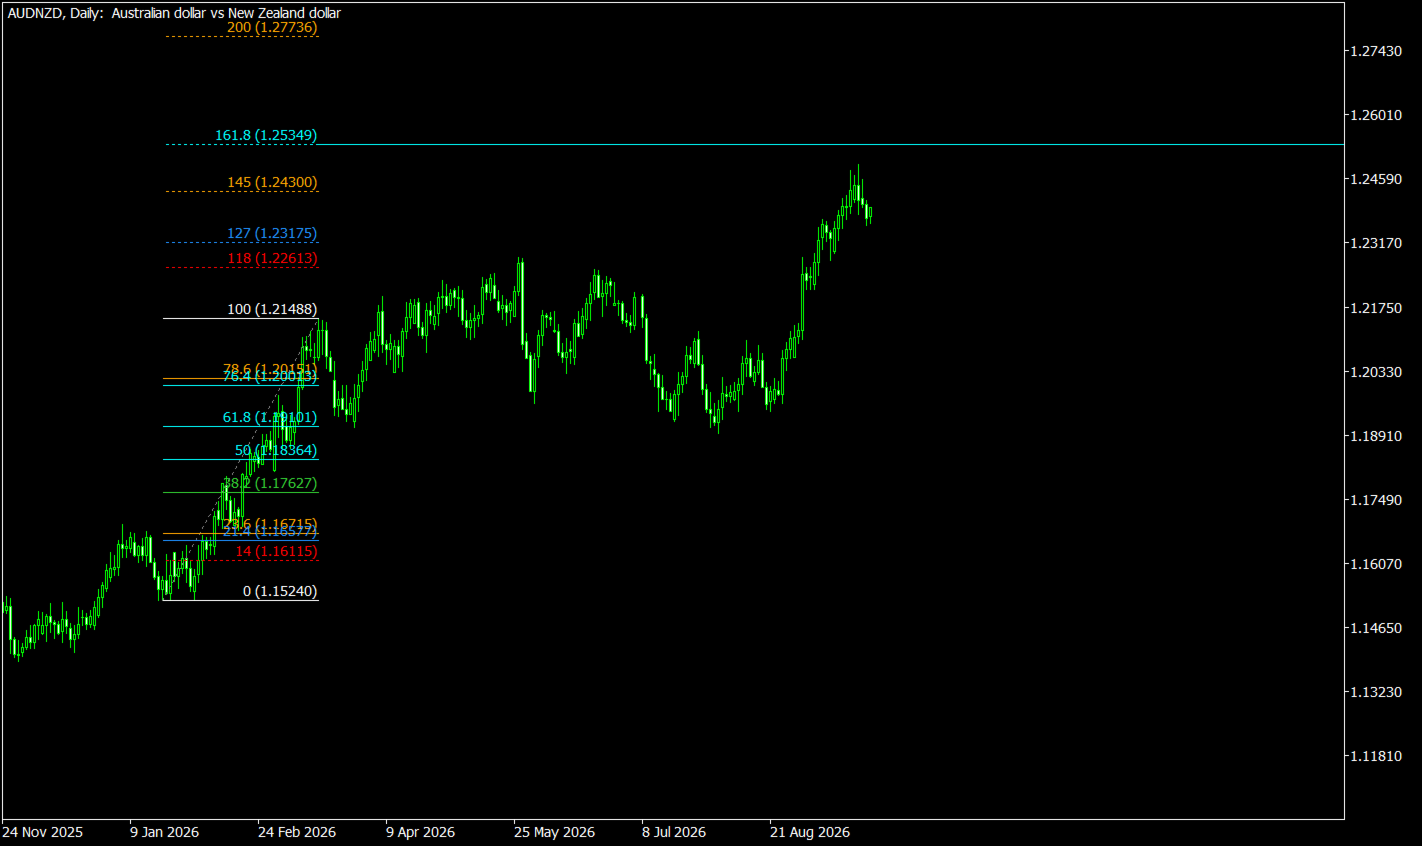
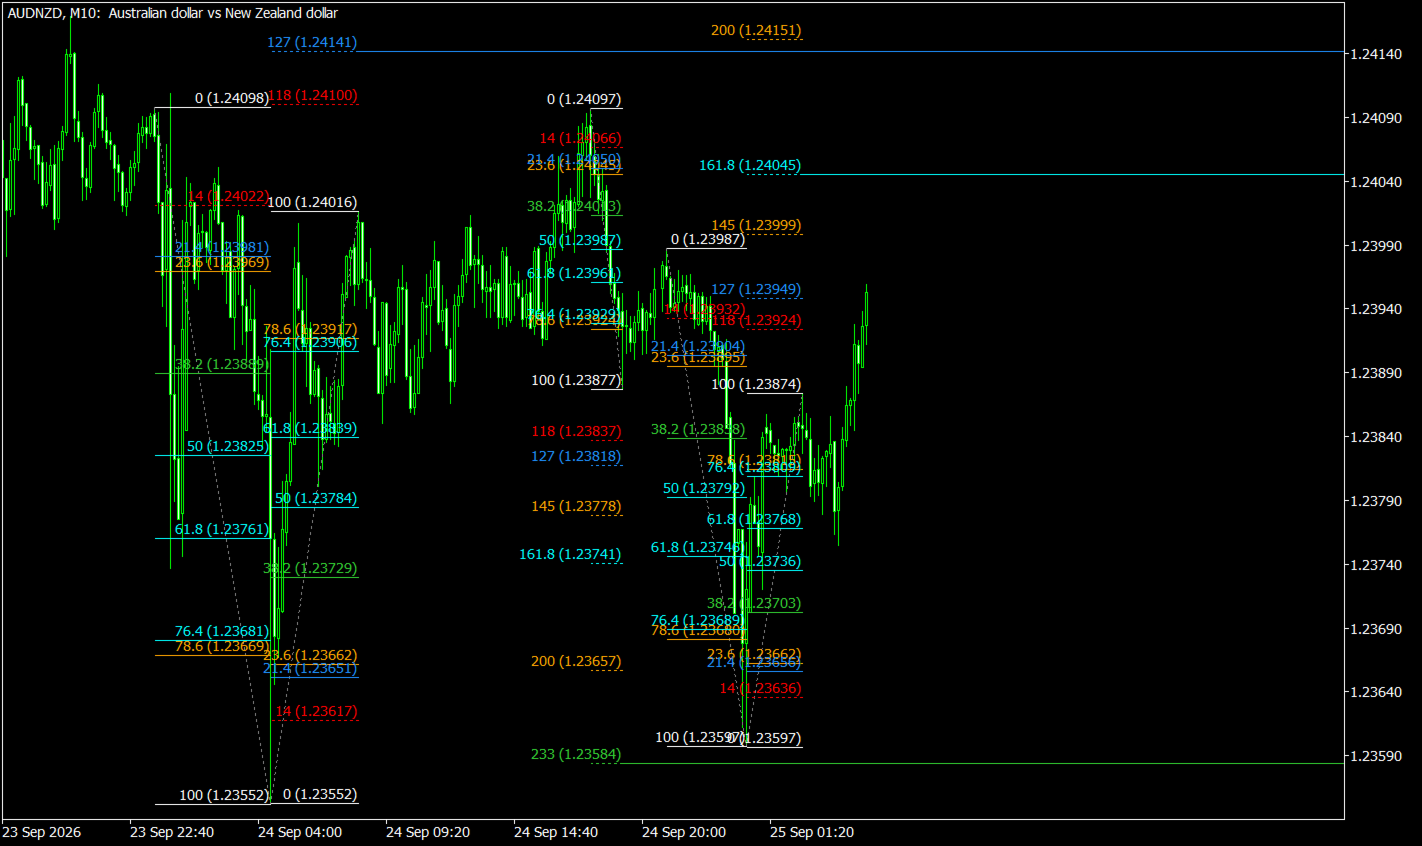
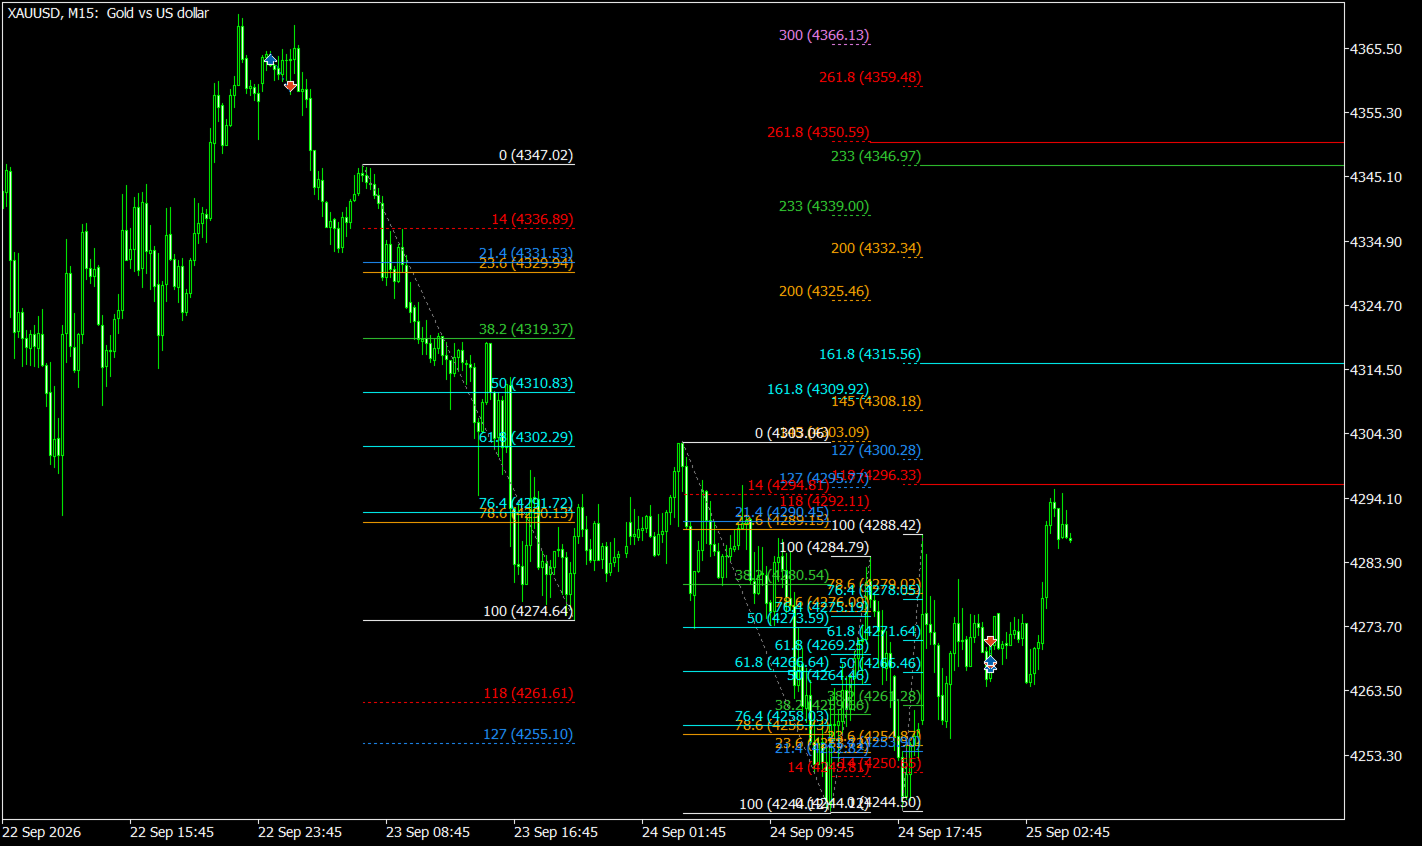
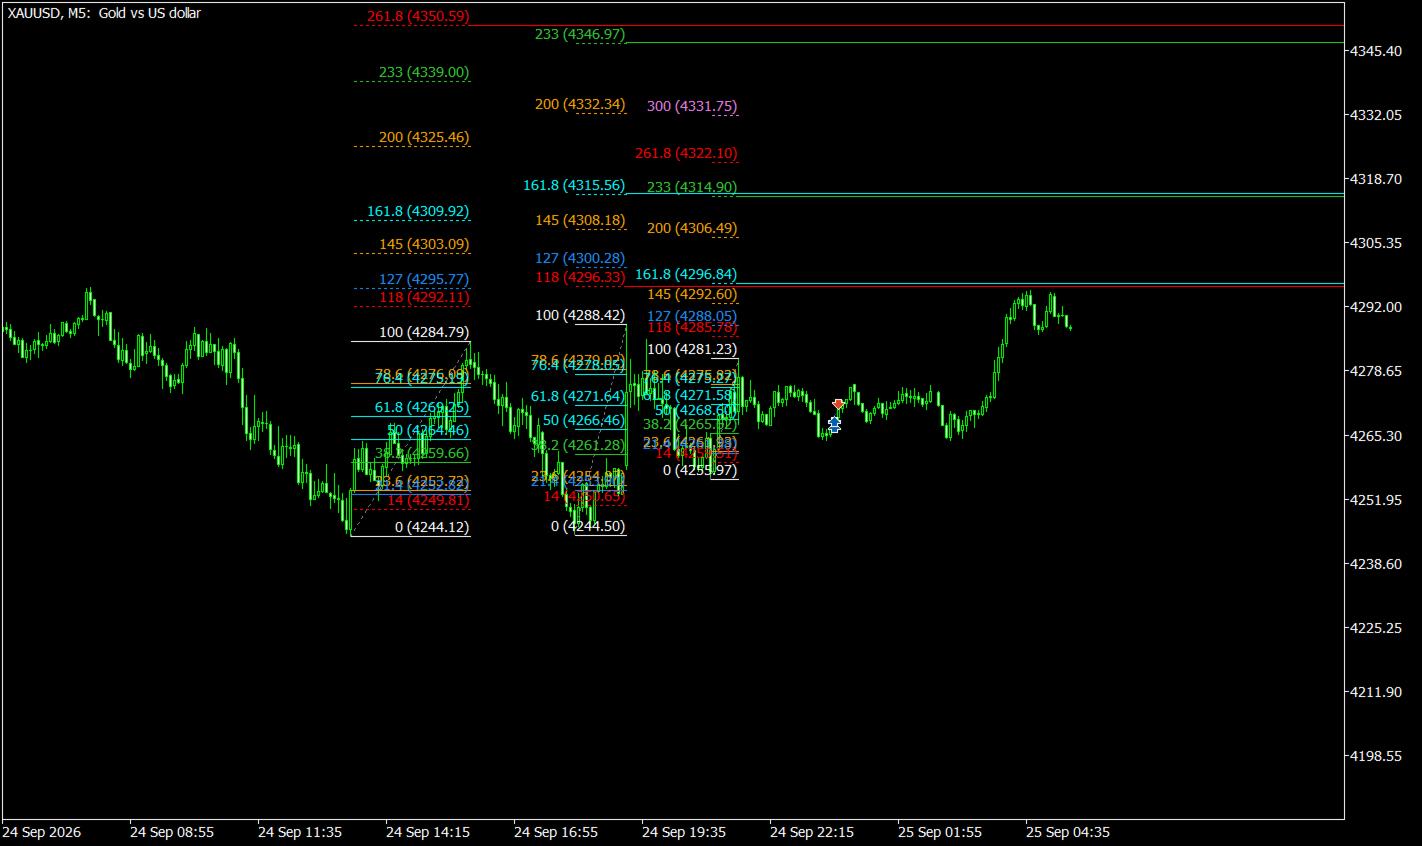
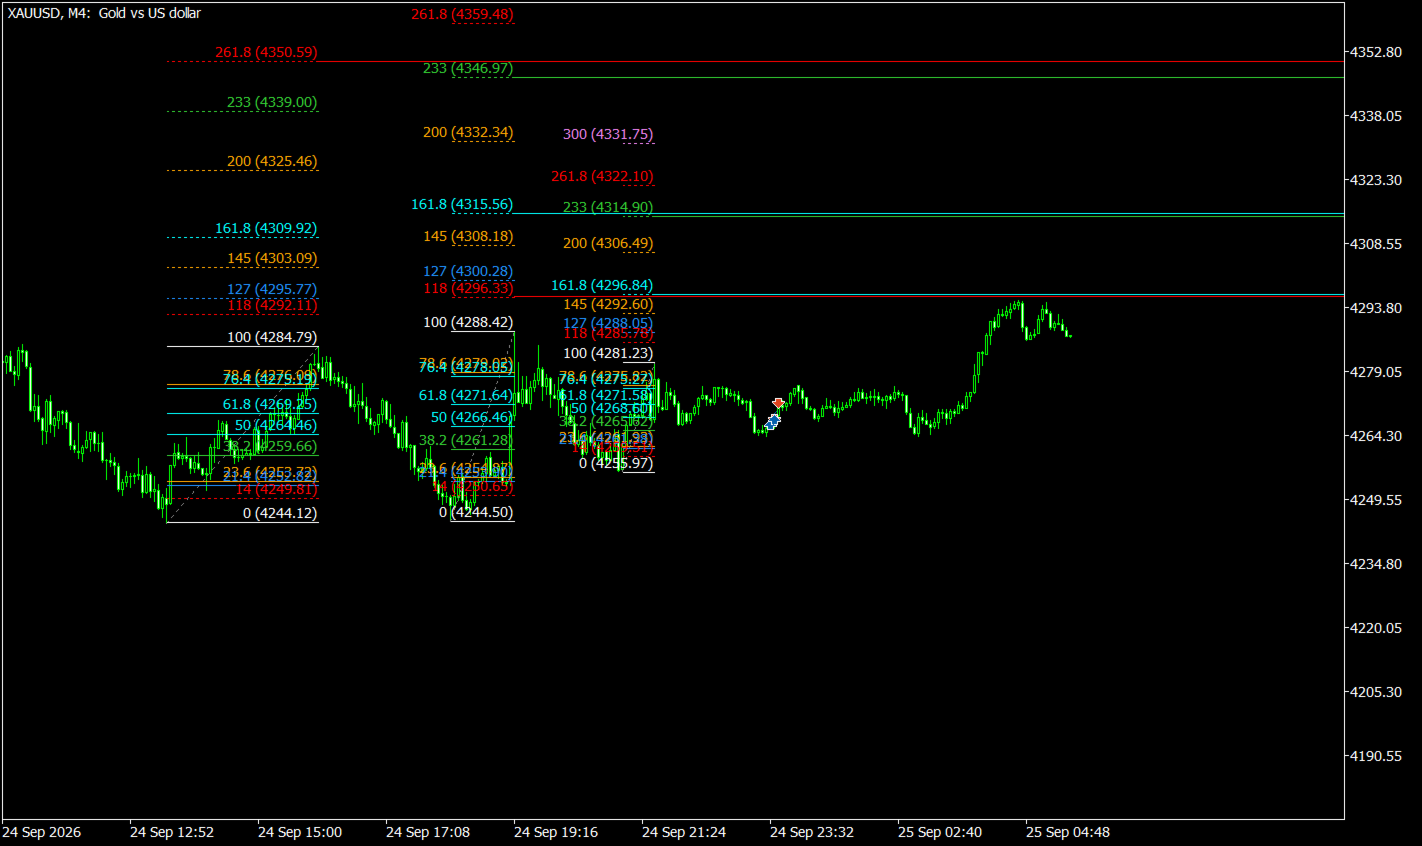
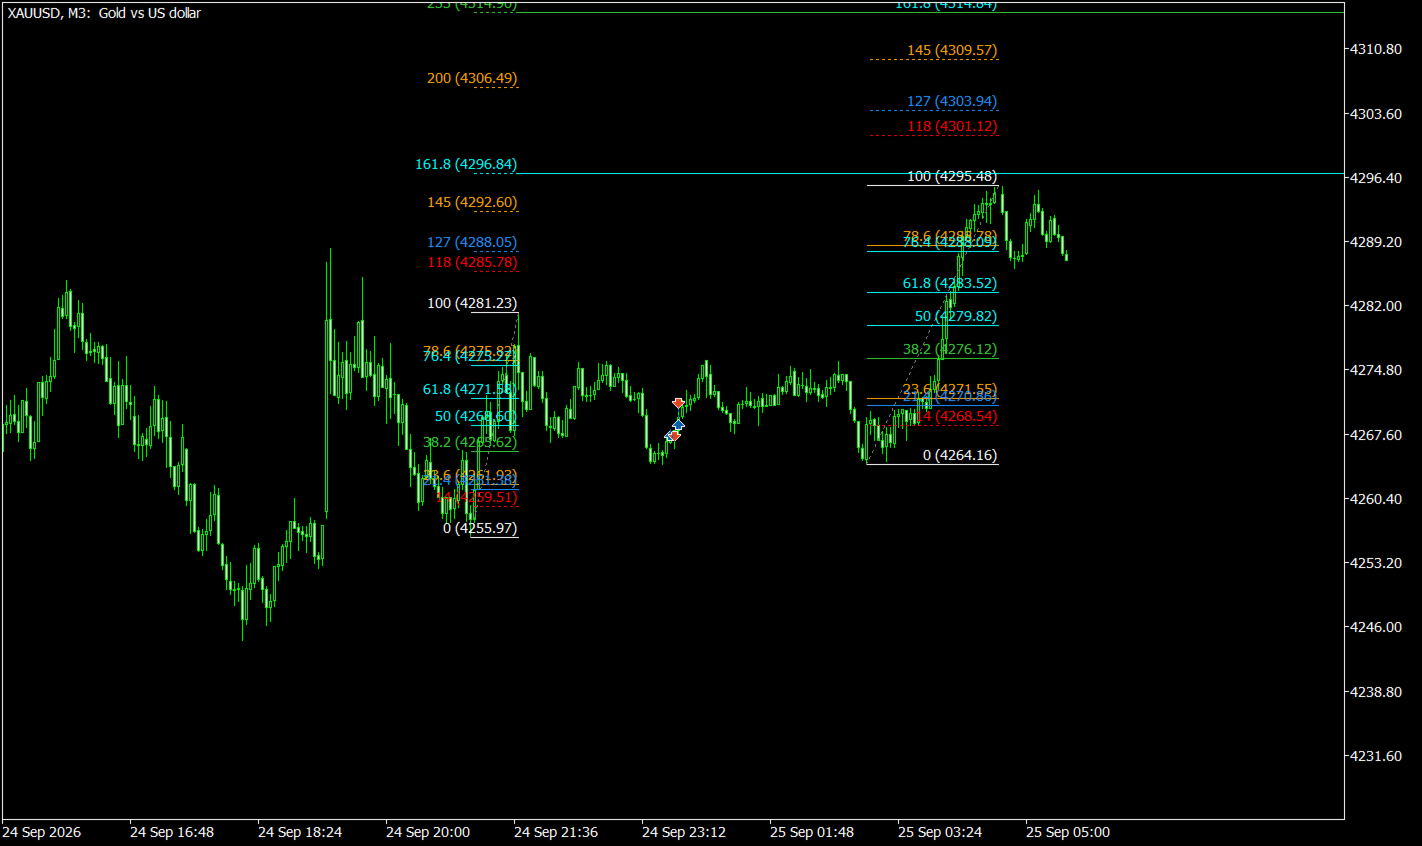
Once a structural swing is validated, the indicator deploys a comprehensive 18-tier Fibonacci matrix. This is not a standard retracement tool; it is a full-spectrum harmonic grid.
- Deep Retracement Tracking: Incorporates specialized retracement depth tracking, plotting crucial turning points at the 78.6, 21.4, and extreme 14 levels to identify deep harmonic patterns and liquidity sweeps.
- Algorithmic Target Scaling: The system analyzes the exact depth of the retracement and calculates up to four optimal extension targets, projecting forward-looking levels ranging from the initial 118 and 127 expansion zones out to the extreme 261.8 and 300 targets.
- State-Aware Ray Rendering: Target levels are projected as forward-facing horizontal rays. As price action unfolds, the indicator tracks interactions with these rays in real-time, providing immediate visual feedback on market progression.
3. Automated Ecosystem Management
Chart clutter is the enemy of analytical clarity. It features an aggressive, intelligent memory management protocol that constantly curates the visual workspace.
- Setup Invalidation: If price breaks the origin point of a tracked swing, the setup is deemed invalid, and all associated geometric objects are instantly purged from the chart.
- Target Achievement: Once all generated extension rays for a specific swing have been hit by live price action, the setup is classified as "completed," and the visual data is archived and removed to make way for new structural formations.
4. Background Signal Processing
Beyond generating visual geometry, the tool runs a quiet secondary analytical layer to track momentum shifts and structural breaks.
- Unobtrusive Tracking: The system continuously calculates directional bias shifts internally, logging precise moments when price exhausts a down-swing or up-swing against key structural levels.
- Clean Charting Environment: By hiding these pure logic calculations from the primary display, the user's workspace remains entirely focused on price action and geometric levels, free from distracting arrows or overlapping indicators.
Technical Specifications and Capability Matrix
| Feature | Technical Implementation | Analytical Benefit |
| Wave Filtration | MT5 ZigZag Engine (Depth, Deviation, Backstep) | Ensures only structurally significant highs and lows are analyzed, eliminating false readings in ranging markets. |
| Comprehensive Fibonacci | 18 predefined tiers with localized mapping | Covers everything from minor pullbacks at the 78.6 mark to extreme parabolic extensions at the 300 level. |
| Visual Hierarchy | Categorized color arrays mapping specific zones | Provides instant cognitive recognition of level importance (e.g., core 161.8 extensions in Aqua, extreme 300 targets in Violet). |
| Object Memory Tracking | Struct-based swing arrays and validation | Prevents redundant calculations and ensures the terminal operates at peak efficiency with a clean interface. |
| Structural Logic Gate | Baseline breakdown and momentum state tracking | Delivers exact directional bias shifts and reversal confirmations based strictly on closing prices. |
It is a comprehensive analytical framework. By transforming abstract market geometry into hard, actionable mapping, it allows modern technical analysts to operate with unprecedented precision, speed, and spatial awareness.