• 概要
  • レビュー (4)
  • コメント (13)
  • 最新情報

GridShowAverageMT5

4

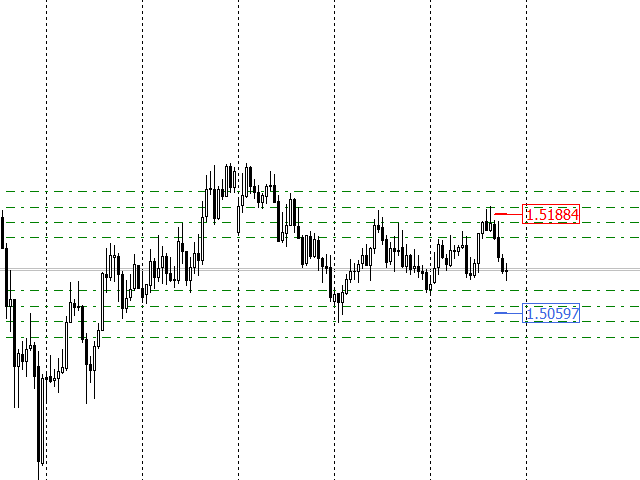
For any number of placed market and pending orders, the utility calculates the "breakeven level" - weighted average price. The calculation is performed individually for buy and sell orders. The weighted average price is marked with a label and colored horizontal line separately as well - one line for the buy price, and the other for sell price.
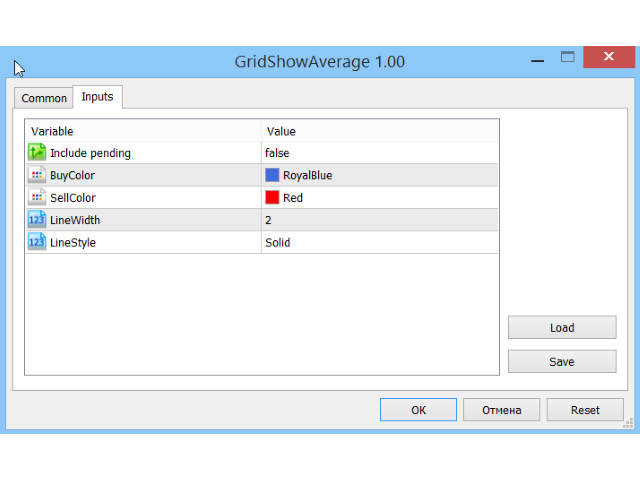

Input Parameters:

  • Include pending. Include the pending orders in calculation. The default value of this parameter is false, and the calculation of the breakeven level is performed based on market order only. For the netting accounts, the use of this script makes sense only in case this parameter is set to true. For the hedge accounts, any value is applicable.
  • BuyColor. Color of the label and horizontal segment for the buy orders. The default is blue.
  • SellColor. Color of the label and horizontal segment for the sell orders. The default is red.
  • LineWidth. The width of lines and size of the price label. The default value of this parameter is two (2).
  • LineStyle. Style of lines. By default, it is a conventional line without gaps.

Additional information in the Telegram channel. Don't forget to subscribe!

    おすすめのプロダクト
    Free automatic Fibonacci is an indicator that automatically plots a Fibonacci retracement based on the number of bars you select on the BarsToScan setting in the indicator. The Fibonacci is automatically updated in real time as new highest and lowest values appears amongst the selected bars. You can select which level values to be displayed in the indicator settings. You can also select the color of the levels thus enabling the trader to be able to attach the indicator several times with differe
    FREE
    This indicator copies graphical objects (vertical lines, horizontal lines, text labels, fibo and etc.) from master chart to other charts.  For example, you can copy lines from the chart GBPUSD with period H1 to chart GBPUSD with period M15. It's makes technical analyses more simple. Show label - show label on the Master chart, where you draw graphical objects to copy; Font size - font size of label; Type of synchronisation - type of synchronisation Copy text - on/off copy of text objects Copy
    FREE
    This is my version of the famous VWAP indicator.  Channel Group: Click Here You get:  - Default VWAP Line - First and second deviation zones - Previous day levels Very simple to use, one of the best tools for day trading.  Can be used on any TF and on any symbol. Don't use for entries, use as a trend filter. Add supporting indicators  I would recommend to use the indicator on either 15M or 5M chart.
    FREE
    Auto Fib Retracements
    Ross Adam Langlands Nelson
    4.33 (6)
    Automatic Fibonacci Retracement Line Indicator. This indicator takes the current trend and if possible draws Fibonacci retracement lines from the swing until the current price. The Fibonacci levels used are: 0%, 23.6%, 38.2%, 50%, 61.8%, 76.4%, 100%. This indicator works for all charts over all timeframes. The Fibonacci levels are also recorded in buffers for use by other trading bots. Any comments, concerns or additional feature requirements are welcome and will be addressed promptly. 
    FREE
    Babel Assistant
    Iurii Bazhanov
    4.33 (6)
    Babel assistant 1     The MT5 netting “Babel_assistant_1” robot uses the ZigZag indicator to generate Fibonacci levels on M1, M5, M15, H1, H4, D1, W1  periods of the charts , calculates the strength of trends for buying and selling. It opens a position with "Lot for open a position" if the specified trend level 4.925 is exceeded. Then Babel places pending orders at the some Fibonacci levels and places specified Stop Loss , Take Profit. The screen displays current results of work on the positio
    FREE
    Fibo Trader is an expert advisor that allows you to create automated presets for oscillation patterns in reference to Fibonacci retracements values using fully automated and dynamically created grid. The process is achieved by first optimizing the EA, then running it on automated mode. EA allows you to switch between automatic and manual mode. When in manual mode the user will use a graphical panel that allows to manage the current trading conditions, or to take control in any moment to trade ma
    FREE
    Functional in the Forex market. Functional in the B3 market - Bolsa Brasil Balcão. Motivation The technical Fibonacci retraction indicator for many is essential and the basis for all market movement forecasts. The name of the tool comes from the Italian mathematician Leonardo de Pisa (13th century). This DEMO version will work in Meta Trader with Demo and Strategy Tester. To purchase the Full version that works on a Real account, click on: https://www.mql5.com/en/market/product/38089
    FREE
    Pro tren entri premium Logika TZ Trade, menehi sampeyan, versi apik saka entri tren Premium Rilis iki, bakal nggawa sampeyan kahanan dagang sing luwih santai kanthi fitur canggih kanggo nyaring tren lan wektu mlebu sinyal premium. Kanggo kita, dudu nggawe produk sing penting! nanging pangopènan lan pendhidhikan terus kanggo pangguna. liwat sarana khusus kanggo nggayuh kita, sampeyan bakal nemokake pandhuan cedhak babagan cara nggunakake produk lan latihan liyane sing gegandhengan karo dag
    FREE
    Necessary for traders: tools and indicators Waves automatically calculate indicators, channel trend trading Perfect trend-wave automatic calculation channel calculation , MT4 Perfect trend-wave automatic calculation channel calculation , MT5 Local Trading copying Easy And Fast Copy , MT4 Easy And Fast Copy , MT5 Local Trading copying For DEMO Easy And Fast Copy , MT4 DEMO Easy And Fast Copy , MT5 DEMO 高度なボリンジャーバンド: 1.ボリンジャーレールは方向によって色が変わります」 2.ボリンジャーアウターレールの伸縮はアウターレールの色の変化でマークされます。」 3.ボリンジャ
    FREE
    Did you ever feel irritated by manually adjusting Fibonacci retracement levels? Do you ever want to have a tool that was automatically adjust to certain Fibonacci levels with your trading? Well here is a tool for you: Fast Fibonacci indicator and Grid trader allows you to quickly adjust Fibonacci retracement levels or construct Fibonacci extension grid! You can also quickly setup your grid trading based on these levels - only with few clicks. Adjustable graphics, font sizes and graphics panels m
    FREE
    Necessary for traders: tools and indicators Waves automatically calculate indicators, channel trend trading Perfect trend-wave automatic calculation channel calculation , MT4 Perfect trend-wave automatic calculation channel calculation , MT5 Local Trading copying Easy And Fast Copy , MT4 Easy And Fast Copy , MT5 Local Trading copying For DEMO Easy And Fast Copy , MT4 DEMO Easy And Fast Copy , MT5 DEMO Fibo: from KTrade 1. Automatically calculate and analyze the band. -> Get the desired band 2.
    FREE
    This is a regression tree indicator for MT4/MT5. This indicator classificate nodes on the time period so that the deviation becomes smaller, and displays regression line and channel for each node. It's free! Attached CartDemo.ex4 and CartDemo.ex5 is a Demo version and has the following limitations: Method is RandomForest only Maximum number of bars is 200 Maximum number of trees is 2 Maximum tree depth is 2 Calculated waste lines are shown Not display correlation coefficients Fu
    FREE
    Value Chart Candlesticks
    Flavio Javier Jarabeck
    4.67 (9)
    The idea of a Value Chart indicator was presented in the very good book I read back in 2020 , " Dynamic Trading Indicators: Winning with Value Charts and Price Action Profile ", from the authors Mark Helweg and David Stendahl. The idea is simple and the result is pure genius: Present candlestick Price analysis in a detrended way! HOW TO READ THIS INDICATOR Look for Overbought and Oversold levels. Of course, you will need to test the settings a lot to find the "correct" one for your approach.
    FREE
    CandleBot
    Mithlesh Kumar Mandal
    キャンドルボットのご紹介 - ローソク足パターンを認識しトレードするための究極の無料ツール!キャンドルボットを使用して、簡単に高値と低値の両方に認識できる牛さんと熊さんのエングルフィング、モーニングスター、イブニングスター、そしてハンマーシグナルを活かし、市場で優位性を得ましょう。特定の期間にわたる始値、高値、安値、終値から導き出されたローソク足パターンは、価格動向の視覚的な表現となり、トレーダーが市場センチメントを分析し、潜在的な逆転や継続を予測するのに役立ちます。 ローソク足パターンの理解: エングルフィングパターン: 二つのローソク足から成り立ち、二つ目のローソクが完全に最初のものを覆います。ベアッシュエングルフィングは下降トレンドの終わりにおいて上昇トレンドの反転の可能性を示し、ブルッシュエングルフィングは上昇トレンドの終わりにおいて下降トレンドの反転の可能性を示唆します。エングルフィングキャンドルの本体が大きいほど、そのシグナルは強力です。 ハンマーパターン: 一本のローソク足で、本体が上部近くに小さく、下部に長い尾を持つハンマーのような形です。ブルッシュハンマーは下降トレン
    FREE
    Indicator introduction: The indicator draws wave lines and histograms, It has small price lag, and the signal will not drift. The indicator can send emails, alerts and notifications to you when previous k line has an up arrow and it is under the histogram sections or it has a down arrow. you can choose whether or not to send the two kind of alerts, the alerts repetition times can also be changed. If the indicator appears red and green histograms, this is a buy zone. It can be used to analyze mar
    FREE
    Necessary for traders: tools and indicators Waves automatically calculate indicators, channel trend trading Perfect trend-wave automatic calculation channel calculation , MT4 Perfect trend-wave automatic calculation channel calculation , MT5 Local Trading copying Easy And Fast Copy , MT4 Easy And Fast Copy , MT5 Local Trading copying For DEMO Easy And Fast Copy , MT4 DEMO Easy And Fast Copy , MT5 DEMO Can set the cycle for other varieties of K line graph covered this window, fluctuations obse
    FREE
    MT5用NAS100 Auto SL and TP Makerをご紹介します: MetaTrader5でナスダック100市場をナビゲートするトレーダーにとって不可欠なアシスタントであるNAS100オートSLおよびTPメーカーで、ストップロスおよびテイクプロフィットの設定をもう見逃すことはありません。このツールは、ストップロスとテイクプロフィットのレベル管理を自動化するシームレスなソリューションを求める方々のために設計されています。 主な特徴 簡単な自動化: ストップロスやテイクプロフィットのないナスダック100取引を自動的に監視します。 ユーザーが構成した設定に基づいてレベルを動的に調整します。 注文タイプの多様性: Nasdaq100の成行注文と未決済注文の両方に対応。 MetaTrader 5で利用可能なさまざまな注文タイプをサポートします。 カスタマイズされた設定: ユーザーフレンドリーなパラメータ設定により、トラッキング設定とストップロス/テイクプロフィットレベルのカスタマイズが可能です。 柔軟な範囲: 実行する特定のNAS100商品または取引されるす
    FREE
    Round numbers (or key levels) is an amazing strategy. These numbers are strong support and resistance levels. So what this indicator does is draw horizontal lines on the chart to help you find these levels. Configurations: Key levels in pips - distance between the lines. Color -   lines color. Style -   lines style. Width -  lines width. Display at background -  draw lines in front or back of candles. Selectable -  turn on or off the option to select the lines. Lines identification -  identifica
    FREE
    Growthamp MT5
    Conor Stephenson
    5 (4)
    Growthamp は、独自のエントリ条件をカスタマイズしたいクライアント向けに設計されたグリッド エキスパートです。 エキスパートは、2 つの入力カスタム移動平均とオプションの確率的オシレーションを使用して取引を開始します。 次に、選択した注文管理とクローズ機能を使用して、注文を管理して利益を生み出します。      シグナルとグループチャット: https://www.mql5.com/en/users/conorstephenson 主な特長      カスタマイズ可能なエントリと取引管理。      36 種類の移動平均タイプから選択できます。      トレンドに従うか、移動平均クロスを使用してエントリーします。      取引をさらにフィルタリングするためのオプションの確率的入力。      取引を管理およびクローズするための複数の方法。      オプションのマーチンゲール モード。      オプションのヘッジロジック。      独自の戦略を作成/取引したいクライアント向けに設計されています。      広範囲の広がりと滑り防止。      株式制限
    FREE
    MACDは類似性と差異の移動平均と呼ばれ、二重指数移動平均から作成されます。高速指数移動平均(EMA12)を低速指数移動平均(EMA26)から差し引いて、高速DIFを取得し、次に2× (Express DIF-DIFの9日間の加重移動平均DEA)MACDバーを取得します。 MACDの意味は、基本的に二重移動平均と同じです。つまり、高速移動平均と低速移動平均の分散と集約は、現在のロングショートステータスと株価の開発傾向の可能性を特徴づけますが、読む方が便利です。 MACDの変化は市場動向の変化を表し、さまざまなKラインレベルのMACDは、現在のレベルサイクルにおける売買傾向を表します。 1.このインジケーターは、MACDの2行表示を追加します。 2.そしてエネルギーカラムに4つの異なる勾配を適用します! トレンドインジケーター、 波動標準の自動計算 、 MT5バージョンの波動標準の自動計算を強くお勧めします   Necessary for traders: tools and indicators Waves automatically calculate indicators
    FREE
    Pointer Sync is a pointer synchronizer between open charts. It makes the MT5 cross (activated by the middle mouse button) to be replicated on all open charts. In addition, it is possible to create horizontal lines (letter H) and vertical lines (letter V), very useful for studying. The appearance of the lines is customizable. Note: Synchronization is through the X and Y scale in pixels , not price and/or date. It is a simple and free utility. Enjoy! This is a free indicator, but it took hours t
    FREE
    Bollinger Bands B
    Flavio Javier Jarabeck
    5 (3)
    John Bollinger created this indicator in 2010 as a way to read the original indicator (Bollinger Bands) in a more "technical" way, shown as an oscillator. The typical range of the Bollinger Bands %B is 0 - 0.5 - 1.0, where "0" represents the lower band, the "0.5" the middle band, and "1" the upper band. The line on the indicator represents the Closing prices. As simple as that. SETTINGS Bollinger Bands period of analysis Standard Deviation multiplier Shift Price type to be analyzed If you
    FREE
    This Expert Advisor constantly monitors the balance and P/L of your trading account to prevent costly drawdowns and/or take profits. When a certain drawdown or profit target is reached, the EA will alert, close all trades and in some cases, delete all pending orders. Optionally, it can also close all charts to remove all EAs operating in the account. [ Installation Guide | Update Guide | Troubleshooting | FAQ | All Products ] The following features are implemented and can be enabled or disab
    FREE
    A ready-made multitimeframe trading system based on automatic plotting and tracking of Fibonacci levels for buying and selling any symbol. Demo version - calculation of the last 390 bars is not performed. Advantages Determines the trend direction based on a complex of 14 indicators ( Cx ), extremums of ZigZag ( Z ), RSI ( R ), Impulse ( I ) Displaying the values of 14 indicators comprising the trend direction ( Cx ) Plotting horizontal levels, support and resistance lines, channels View the pl
    FREE
    SDivergence Indicator calculates and shows regular divergences and hidden divergences for MACD and Stochastic(for now). The benefit of this indicator is multiple input variables. Using these inputs you can modify to get more adaptive RD and HD's to your strategy. Guide : 1- First put your desired oscillator (MACD or Stochastic or Both) on the chart. 2- Run SDivergence indicator and set corresponding sub-window index of previously put oscillator in SDivergence input window. -Note: the chart sub-w
    FREE
    You may find this indicator helpfull if you are following a session based strategy. The bars are colored according to the sessions. Everything is customisable.  Settings: + Asia Session: zime, color, high, low + London Session: zime, color, high, low + US Session: zime, color, high, low Please feel free to comment if you wish a feature and/or give a review. Thanks.
    FREE
    MFI and RSI sniper entry Signals for Boom and Crash synthetics come with powerful entry alert systems, and for more advanced filter signals consider the Harmonic Hybrid Pilot Pro. When trading Spikes you have three orders logically placed to distribute the risk and the third order is finally close to the highest probability of a spike. Signals are invalidated fifteen minutes from the final order and losses must be closed immediately. For Tp, I recommend you exit soon after a spike strikes in you
    FREE
    This is the demo version of "All Harmonics 26" indicator . "All Harmonics 26" searches for 26 types of harmonic patterns and outputs them in a convenient way. You can check out the documentation here . This demo version has the following limitations: The indicator searches only for one type of harmonic patterns out of 26:- Gartley. The indicator outputs new patterns with a lag of 10 bars.
    FREE
    Save time placing orders This is a tool for manual trading. It has an intuitive, and straightforward interface without any useless extras. Allows you to automatically calculate the order volume size, open both market and pending order.  Works on any symbol/instrument, account type or broker. Input fields: Order Size - as percentage of account free margin Take Profit - as percentage of account balance Stop Loss - as percentage of account balance Symbol Contract Size - needs to be manually entered
    FREE
    The Penta-O is a 6-point retracement harmonacci pattern which usually precedes big market movements. Penta-O patterns can expand and repaint quite a bit. To make things easier this indicator implements a twist: it waits for a donchian breakout in the right direction before signaling the trade. The end result is an otherwise repainting indicator with a very reliable trading signal. The donchian breakout period is entered as an input. [ Installation Guide | Update Guide | Troubleshooting | FAQ | A
    FREE
    このプロダクトを購入した人は以下も購入しています
    Trade Assistant MT5
    Evgeniy Kravchenko
    4.4 (171)
    取引 ごとのリスクの 計算、新規注文 の 簡単 な 設置、部分的 な 決済機能 を 持 つ 注文管理、 7 種類 のトレーリングストップなど 、便利 な 機能 を 備 えています 。 注意、アプリケーションはストラテジーテスターでは機能しません。 説明ページからデモ版をダウンロードできます  Manual, Description, Download demo ライン機能 チャート上にオープニングライン、ストップロス、テイクプロフィットを表示します。この機能により、新規注文を簡単に設定することができ、注文を出す前にその特徴を確認することができます。   リスク計算 リスク計算機能は、設定されたリスクとストップロス注文のサイズを考慮して、新規注文のボリュームを計算します。ストップロスの大きさを自由に設定できると同時に、設定したリスクを守ることができます。 Lot calc ボタン - リスク 計算 を 有効 / 無効 にします 。 Risk フィールドでは 、必要 なリスクの 値 を 0 から 100 までのパーセンテージまたは 預金通貨 で 設定 します 。 設定」 タブで 、
    価格が一瞬で変わる可能性のある市場では、注文はできるだけ簡単にすべきだと思いますか? Metatraderでは、注文を開くたびに、開始価格を入力し、損失を止めて利益を得るウィンドウと、取引サイズを開く必要があります。金融市場の取引では、初期預金を維持し、それを増やすために資本管理が不可欠です。それで、あなたが注文をしたいとき、あなたはおそらくあなたがどれくらいの大きさの取引を開くべきか疑問に思いますか?この単一の取引であなたの預金の何パーセントを危険にさらすべきですか?この取引からどれだけの利益を得ることができますか?また、リスクに対する利益の比率はどのくらいですか?トレードサイズを設定する前に、トレードサイズがどうあるべきかという質問に対する答えを得るために必要な計算を行います。 これらすべてを自動的に行うツールがあると想像してみてください。チャートを開き、市場分析を行い、エントリーポイント、ディフェンスポイント(ストップロス)、ターゲット(テイクプロフィット)を水平線でマークし、最後にリスクのレベルを定義します。利用可能な資本の%として、このトランザクションで負担することができ、こ
    TradePanel MT5
    Alfiya Fazylova
    4.86 (113)
    Trade Panel は、多機能の取引アシスタントです。 このアプリケーションには手動取引用に設計された 50 以上の機能が含まれており、ほとんどの取引アクションを自動化できます。 購入する前に、デモ アカウントでデモ バージョンをテストできます。 デモ版 こちら 。 詳細な説明は こちら 。 アプリケーションの主な機能: 任意のシンボル(外国為替、CFD、先物など)で機能します。 無制限の文字数での同時作業。 取引ごとのリスクの自動計算とストップロスとテイクプロフィットの比率の設定。 OCO注文を行うことができます(一方が他方をキャンセルします-1つの注文を実行すると別の注文がキャンセルされます)。 タスクを含む行を設定できます(ポジションを開く、保留中の注文を開く、またはグループごとに注文を閉じる)。 仮想テイクプロフィットとストップロスを設定できます。 成行注文を反転またはロックできます。 6種類のトレーリングストップ。 ストップロスを損益分岐点に設定する機能があります。 ポジションを部分的にクローズする機能があります(利益または損失の一部をクローズします)。 価格が特定のライ
    Local Trade Copier EA MT5
    Juvenille Emperor Limited
    5 (63)
    Local Trade Copier EA MT5 による、驚くほど高速な取引コピーを体験してください。1分で簡単にセットアップできるこの取引コピー機は、同じWindowsコンピュータまたはWindows VPS上の複数のMetaTrader端末間で取引をコピーすることができ、0.5秒未満の高速コピースピードを実現します。 初心者であろうとプロのトレーダーであろうと、 Local Trade Copier EA MT5 には、あなたの特定のニーズに合わせてカスタマイズするための幅広いオプションが用意されています。これは、利益の可能性を高めたい人にとって究極のソリューションです。 今すぐ試してみて、これが市場で最も速くて簡単なトレードコピー機である理由を理解してください。 ヒント: デモアカウントで Local Trade Copier EA MT5 デモバージョンをダウンロードして試すことができます: ここ ダウンロードした無料のデモ ファイルを MT5 >> ファイル >> データ フォルダを開く >> MQL5 >> Experts フォルダに貼り付けて、ターミナルを再起動し
    Trade Manager は、リスクを自動的に計算しながら、取引を迅速に開始および終了するのに役立ちます。 過剰取引、復讐取引、感情的な取引を防止する機能が含まれています。 取引は自動的に管理され、アカウントのパフォーマンス指標はグラフで視覚化できます。 これらの機能により、このパネルはすべてのマニュアル トレーダーにとって理想的なものとなり、MetaTrader 5 プラットフォームの強化に役立ちます。多言語サポート。 MT4バージョン  |  ユーザーガイド + デモ Trade Manager はストラテジー テスターでは機能しません。 デモについてはユーザーガイドをご覧ください。 危機管理 % または $ に基づくリスクの自動調整 固定ロットサイズを使用するか、ボリュームとピップに基づいた自動ロットサイズ計算を使用するオプション RR、Pips、または価格を使用した損益分岐点ストップロス設定トレーリングストップロス設定 目標に達したときにすべての取引を自動的に終了するための 1 日あたりの最大損失 (%)。 過度のドローダウンからアカウントを保護し、オーバートレードを防ぎます
    The product will copy all telegram signal to MT5 ( which you are member) , also it can work as remote copier.  Easy to set up, copy order instant, can work with almost signal formats, image signal,  s upport to translate other language to English Work with all type of channel or group, even channel have "Restrict Saving Content", work with  multi channel, multi MT5 Work as remote copier: with signal have ticket number, it will copy exactly via ticket number. Support to backtest signal. How to s
    Mentfx Mmanage mt5
    Anton Jere Calmes
    4.43 (7)
    The added video will showcase all functionality, effectiveness, and uses of the trade manager. Drag and Drop Trade Manager. Draw your entry and have the tool calculate the rest. Advanced targeting and close portions of a trade directly available in tool (manage trades while you sleep). Market order or limit order on either side with factored spread. Just draw the entry, the tool does the rest. Hotkey setup to make it simple. Draw where you want to enter, and the stop loss, the tool calculates al
    MT5 to Telegram Signal Provider は、Telegramのチャット、チャンネル、またはグループに 指定された シグナルを送信することができる、完全にカスタマイズ可能な簡単なユーティリティです。これにより、あなたのアカウントは シグナルプロバイダー になります。 競合する製品とは異なり、DLLのインポートは使用していません。 [ デモ ] [ マニュアル ] [ MT4版 ] [ Discord版 ] [ Telegramチャンネル ] セットアップ ステップバイステップの ユーザーガイド が利用可能です。 Telegram APIの知識は必要ありません。必要な全ては開発者から提供されます。 主な特長 購読者に送信する注文の詳細をカスタマイズする機能 例えば、Bronze、Silver、Goldといった階層型のサブスクリプションモデルを作成できます。Goldサブスクリプションでは、すべてのシグナルが提供されます。 id、シンボル、またはコメントによって注文をフィルターできます 注文が実行されたチャートのスクリーンショットが含まれます 追加の
    This is exactly what the name says. Visual strategy builder . One of a kind. Turn your trading strategies and ideas into Expert Advisors without writing single line of code. Generate mql source code files with a few clicks and get your fully functional Expert Advisors, which are ready for live execution, strategy tester and cloud optimization. There are very few options for those who have no programming skills and can not create their trading solutions in the MQL language. Now, with Bots Build
    Trade copier MT5
    Alfiya Fazylova
    4.35 (26)
    Trade Copierは、取引口座間の取引をコピーして同期するように設計された専門的なユーティリティです。 コピーは、同じコンピューターまたはvps にインストールされている、サプライヤーのアカウント/端末から受信者のアカウント/端末に行われます。 購入する前に、デモ アカウントでデモ バージョンをテストできます。 デモ版 こちら 。 詳細な説明は こちら 。 主な機能と利点: MT5ネッティングアカウントを含む、MT5> MT5、MT4> MT5、MT5> MT4のコピーをサポートします。 高いコピー速度(0.5秒未満)。 ベンダーモードと受信者モードは同じ製品内に実装されています。 チャートから直接リアルタイムでコピーを制御できる、簡単で直感的なインターフェイス。 接続が切断されたり、端末が再起動されたりしても、設定と位置が失われることはありません。 コピーするシンボルを選択できます。また、受信者のシンボルを置き換えることもできます(例:EURUSD> USDJPY)。 バックコピーをサポートします。 特定の注文のみのコピーを有効にする機能。 取引開始価格の最大差と最大遅延時間を
    -25% discount ($199 -> $149) Advanced trading tool: One click smart orders that execute under your conditions Developed by trader for trading community:  position size calculator (lot size), open position after price action, strategy builder, set and forget trading, mobile notifications... Risk Management -  Risk percentage position size calculator, gain percentage, target risk reward ratio, spread and commissions are included in calculations 7 Advanced order types  - Set and forget trading w
    The top-selling EAs on the market cost a lot and one day they are suddenly gone. This is because one strategy will not work in the forex market all the time. Our product is unique from all others in the MQL Marketplace because our EA comes with 34+ built-in indicators that allow develop strategies every time.  You build your strategy and keep updating it. If one strategy does not work, simply build another all using only one EA. This is All-In-One EA   in this market place. You can use as trade
    Tired of complex order placement and manual calculations? Trade Dashboard is your solution. With its user-friendly interface, placing orders becomes effortless, by a single click, you can open trades, set stop loss and take profit levels, manage trade lot size, and calculate risk to reward ratios, allowing you to only focus on your strategy. Say goodbye to manual calculations and streamline your trading experience with Trade Dashboard. Download   demo version   right now. You can find   deta
    OrderManager をご紹介:MT5用の革新的なユーティリティ 新しく設計されたOrder Managerユーティリティを使用して、MetaTrader 5での取引をプロフェッショナルなものにしましょう。シンプルさと使いやすさに焦点を当てたこのユーティリティは、各取引に関連するリスクを簡単に定義し、視覚化できます。これにより、情報に基づいた意思決定が可能になり、取引戦略を最適化できます。OrderManagerに関する詳細は、マニュアルをご参照ください。 [ マニュアル ] [ MT4 バージョン ] [ Telegram チャンネル ] 主な特長: リスク管理:取引のリスクを素早く簡単に定義し、より良い意思決定を行い、取引パフォーマンスを向上させます。 視覚表現:オープンなポジションとそれに関連するリスクをグラフィカルに表示し、明瞭かつ簡潔な理解が可能です。 注文変更:数回のクリックで注文を簡単に変更またはクローズし、取引プロセスを効率化し、貴重な時間を節約します。 手のひらの上の最新ニュース:ボタン一つで最新の市場ニュースに常にアクセスできます。 MT5トレーダーにと
    Botトークンや管理者権限の必要なしに、メンバーであるすべてのチャンネルからシグナルをコピーして、MT5に直接送信します。 多くの機能を提供しながら、ユーザーを考慮して設計されています この製品は、使いやすい視覚的に魅力的なグラフィカルインターフェースで提供されています。設定をカスタマイズして、数分で製品を使用開始できます! ユーザーガイド + デモ  | MT4バージョン | Telegramバージョン デモを試してみたい場合は、ユーザーガイドを参照してください。 DiscordからMT5への変換は、ストラテジーテスターで動作しません。 DiscordからMT5への変換の特長 メンバーである任意のチャンネルからコピーします。BotトークンやチャットIDは不要です リスク%または固定ロットを使用して取引 特定のシンボルを除外 すべてのシグナルをコピーするか、コピーするシグナルをカスタマイズします すべてのシグナルを認識するための単語やフレーズを設定します(デフォルトは99%のシグナルプロバイダーに適用されます) コピーするタイミングと日時の設定をカスタマイズします 一度に
    Adam FTMO MT5
    Vyacheslav Izvarin
    5 (1)
    ADAM EA Special Version for FTMO Please use ShowInfo= false for backtesting ! Our 1st EA created using ChatGPT technology Trade only GOOD and checked PROP FIRMS  Default parameters for Challenge $100,000 Tested on EURUSD and GBPUSD only  Use 15MIN Time Frame Close all deals and Auto-trading  before Weekend at 12:00 GMT+3  Friday For Prop Firms MUST use special Protector  https://www.mql5.com/en/market/product/94362 Signal using ADAM  https://www.mql5.com/en/signals/2190554 --------------------
    UTM Manager は、迅速かつ効率的な取引執行を提供する直感的で使いやすいツールです。際立った機能の 1 つは、「スプレッドを無視」モードです。これにより、スプレッドを完全に無視して、ローソク足の価格で取引できるようになります (たとえば、LTF でより高いスプレッドのペアを取引でき、スプレッドによって取引から除外されるのを回避できます)。 UTM Manager のもう 1 つの重要な側面は、独自のローカル取引コピー機であり、各ブローカーで異なる取引戦略と設定 (たとえば、さまざまな TP、BE、およびリスク ルール) を柔軟に実行できます。 取引執行: 迅速かつ効率的な取引執行: チャート上のエントリー価格とストップロス価格をクリックして簡単に取引を入力するか、ワンクリックの固定ストップロスサイズ機能を使用します。 自動ロットサイズ計算: ロットは事前定義されたリスク設定に基づいて計算され、ドラッグによってポジションが変更されると再計算されます。 1 つまたは複数のポジションを同時に処理できる能力。 利益確定と損益分岐点: 柔軟なテイクプロフィット設定: 特定のリスク対報
    あなたがメンバーである任意のチャネルから(プライベートおよび制限されたものを含む)シグナルを直接あなたのMT5にコピーします。  このツールは、トレードを管理し監視するために必要な多くの機能を提供しながら、ユーザーを考慮して設計されています。 この製品は使いやすく、視覚的に魅力的なグラフィカルインターフェースで提供されています。設定をカスタマイズして、数分で製品を使用を開始できます! ユーザーガイド + デモ  | MT4版 | Discord版 デモを試してみたい場合は、ユーザーガイドにアクセスしてください。 Telegram To MT5 受信機は、ストラテジーテスターで動作しません! Telegram To MT5の特徴 複数のチャネルから一度にシグナルをコピー プライベートおよび制限されたチャネルからシグナルをコピー BotトークンまたはChat IDは必要ありません   (必要に応じて使用することができます) リスク%または固定ロットを使用して取引 特定のシンボルを除外 すべてのシグナルをコピーするか、コピーするシグナルをカスタマイズするかを選択 すべてのシグナ
    Grid Manual MT5
    Alfiya Fazylova
    4.83 (12)
    「Grid Manual」は、注文のグリッドを操作するための取引パネルです。 ユーティリティはユニバーサルで、柔軟な設定と直感的なインターフェイスを備えています。 それは、損失を平均化する方向だけでなく、利益を増やす方向でも注文のグリッドで機能します。 トレーダーは注文のグリッドを作成して維持する必要はありません。 すべてが「Grid Manual」によって行われます。 注文を開くだけで十分であり、「Grid Manual」は注文のグリッドを自動的に作成し、非常に閉じるまでそれに付随します。 ユーティリティの主な機能と機能 ユーティリティは、モバイル端末から開かれた注文を含め、あらゆる方法で開かれた注文を処理します。 「制限」と「停止」の2種類のグリッドで機能します。 グリッド間隔の計算には、固定と動的(ATRインジケーターに基づく)の2つの方法で機能します。 オープンオーダーグリッドの設定を変更できます。 チャート上の各注文グリッドの損益分岐点を表示します。 各注文グリッドの利益率を表示します。 ワンクリックでグリッドから収益性の高い注文を閉じることができます。 ワンクリックで各注文
    Trade Assistant 38 in 1
    Makarii Gubaydullin
    4.87 (15)
    多機能ツール 搭載機能: ロット計算機、プライスアクション、リスク/リワードレシオ、トレードマネージャー、需要供給ゾーンなどをはじめ65以上の機能。 バージョ:デモ版   |   ユーザーマニュアル   |    MT5版 このユーティリティはストラテジー テスターでは機能しません。 ここからデモ   バージョンをダウンロードして製品をテストできます。 ご不明な点や改善提案、バグの発見などございましたら、 連絡してください 。 取引プロセスを簡素化、高速化、自動化します。このダッシュボードで標準端末機能を拡張します 1. 新しい取引を開始します : ロット / リスク / RR の計算 1. Lot計算機(リスクサイズに基づく取引量計算 2. リスク計算機(ロットサイズに基づくリスク量) 3. リスク/リワードレシオ (R/R) 4. 注文のアクティベーション トリガー + Buy StopLimit / Sell StopLimit 5. 仮想 SL / TP レベル (隠しSL、TP: ブローカーには見えない) 6.  Smart SL / エントリー レベル: バ
    Hedge Ninja
    Robert Mathias Bernt Larsson
    Make sure to join our Discord community over at www.Robertsfx.com , you can also buy the EA at robertsfx.com WIN NO MATTER IN WHICH DIRECTION THE PRICE MOVES This robot wins no matter in which direction the price moves by following changing direction depending on in which direction price moves. This is the most free way of trading to this date. So you win no matter which direction it moves (when price moves to either of the red lines as seen on the screenshot, it wins with the profit target yo
    ワンクリックで取引できるトレーディングパネル。ポジションと注文の操作!チャートまたはキーボードから取引。 当社の取引パネルを使用すると、チャートから直接シングルクリックで取引を実行でき、標準の MetaTrader コントロールよりも 30 倍高速に取引操作を実行できます。 パラメータと関数の自動計算により、トレーダーにとって取引がより速く、より便利になります。 グラフィックのヒント、情報ラベル、取引取引に関する完全な情報はチャート MetaTrader にあります。 MT4のバージョン 完全な説明   +DEMO +PDF 購入する方法 インストールする方法     ログファイルの取得方法     テストと最適化の方法     Expforex のすべての製品 手動取引用の取引パネル。チャート(チャートウィンドウ)またはキーボードから取引できます。  開閉、リバース、ロックポジションと注文を処理する МetaТrader5 のメインオーダーのトレーディングコントロールパネル:売買、売却、売却、売却、売却、閉じる、削除、修正、トレーリングストップ、ストップロス、takep
    The most advanced news filter and drawdown limiter on MQL market NEW: Take a Break can be backtested against your account history! Check the " What's new " tab for details. Take a Break has evolved from a once simple news filter to a full-fledged account protection tool. It pauses any other EA during potentially unfavorable market conditions and will continue trading when the noise is over. Typical use cases: Stop trading during news/high volatility (+ close my trades before). Stop trading when
    DrawDown Limiter
    Haidar, Lionel Haj Ali
    5 (17)
    Drawdown Limiter EA You are in the right place if you were searching for Drawdown control, Drawdown limiter, Balance protection, Equity Protection or Daily Drawdown Limit related to Prop Firm, FTMO, or Funded account trading, or if you want to protect your trading account. Have you suffered from controlling your drawdown when trading funded accounts? This EA is meant for you. Prop firms usually set a rule called “Trader Daily Drawdown”, and if it is not respected, you are disqualified.  I am an
    Basket EA MT5
    Juvenille Emperor Limited
    5 (6)
    バスケットEAMT5 は、最高の利益ハーベスターであり、究極のアカウントプロテクターであり、すべてが1つの非常に使いやすいソリューションです。   バスケットEAΜΤ5 の背後にある考え方は、すべてのオープンポジションを合わせて、バスケットレベルでトレーディングアカウント全体の利益および/または損失を制御できるようにすることです。 これは、すべての管理されたポジションについて、口座残高のパーセンテージまたは口座通貨(金銭)で、バスケットテイクプロフィット、ストップロス、損益分岐点、およびトレーリングストップロス設定を提供します。 マジックナンバーやシンボルに応じて、特定の取引の管理または管理からの除外を可能にします。 また、アカウント保護設定を備えており、アカウントが利益を得るかストップロスのエクイティに達したときに、すべてのオープントレードを閉じ、すべての保留中の注文を削除し、すべてのチャートを閉じ、それらに添付されている他のEAを削除します。 ヒント:Basket EA MT5 デモバージョンをダウンロードして、デモアカウントで試すことができます: こちら ダウンロードした無
    -25% discount ($149 -> $111) Everything for chart Technical Analysis indicator mt5 in one tool Draw your supply demand zone with rectangle and support resistance with trendline and get alerts to mobile phone or email alert -  Risk reward indicator mt5 Video tutorials, manuals, DEMO download   here .   Find contacts on my   profile . 1.   Extended rectangles and trendlines Object will be extended to the right edge of the chart when price will draw new candles on chart. This is rectangle extend
    Profit or Loss Pad
    Vladislav Andruschenko
    4.55 (11)
    利益追跡機能で総利益/損失に達したときにMetaTrader5のポジションをクローズします。   CloseIfProfitorLoss with Trailing 仮想停止(個別注文)を 有効にできます。 買いポジションと売りポジションを別々に 計算して閉じる(別々の買い売り)、 すべてのシンボルまたは現在のシンボルのみを 閉じて計算する(すべてのシンボル)、 利益のためにトレーリングを有効にする( トレーリング 利益) ポジションは、預金通貨、ポイント、%、およびドローダウンの 値に基づいてクローズされます。 このアプリケーションは、他のEAと一緒に、または手動取引と組み合わせて、任意のアカウントで使用するように設計されています。 MT4のバージョン 完全な説明   +DEMO +PDF 購入する方法 インストールする方法     ログファイルの取得方法     テストと最適化の方法     Expforex のすべての製品 一部またはすべてのペアの貿易収支の合計が設定で指定された値以上になるとすぐに、すべてのポジションがクローズされ、注文が削除されます。 このバージ
    Seconds Chart — timeframes in seconds for MetaTrader 5. The utility allows you to create charts in the MetaTrader 5 terminal with a timeframe in seconds. The timeframe on such a chart is set in seconds, not in minutes or hours. Thus, you can create charts with a timeframe less than M1. For example, S15 is a timeframe with a period of 15 seconds. You can apply indicators, Expert Advisors and scripts to the resulting chart. You get a fully functional chart on which you can work just as well as on
    YuClusters
    Yury Kulikov
    4.93 (43)
    Attention: You can view the program operation in the free version  YuClusters DEMO .  YuClusters is a professional market analysis system. The trader has unique opportunities to analyze the flow of orders, trade volumes, price movements using various charts, profiles, indicators, and graphical objects. YuClusters operates on data based on Time&Sales or ticks information, depending on what is available in the quotes of a financial instrument. YuClusters allows you to build graphs by combining da
    取引パネルは注文の管理に限定されています - ボタンを使用して開かれたものと、ユーザーによって開かれたものの両方です。 シンプルで便利なコレクション。 バイヤーを補完します。 Gold Stuff インジケーターと併用することをお勧めします。 単一注文として取引を設定し、距離のあるグリッドを構築します。 標準グリッドを作成するには、10000 などの大きな距離を設定するだけです。 リアルタイム結果はこちらからご覧いただけます。 設定と個人的なボーナスを得るために、購入後すぐに私に連絡してください!   設定 新しいシリーズを開く - 注文の新しいシリーズのオン/オフの開始。 Lot miltiplier - 次の注文のロット乗数。 TP - ピップで利益を得る。 SL - 最初の注文からのピップ単位のストップロス。 トレイル スタート - トレーリング ストップの有効化。 トレイル ステップ - トレーリング ストップを有効にしたときの価格からの距離。 DD 削減アルゴリズム - 利益のある最後の注文が損失のある最初の注文シリーズでクローズされる場合のドローダウン削減
    作者のその他のプロダクト
    The Market Structures MT5 indicator finds and shows the Break Of Structures (BoS) pattern on the chart. The pattern is an important part of the Smart Money Concepts (SMC) system. The appearance of a pattern means that the price breaks the last peak of an uptrend, or the last bottom of a downtrend. This indicates a change in the existing trend structure and the beginning of a new movement. BOS is a technical analysis tool used to identify trend reversals. The set of input parameters is simple
    FREE
    The Market Structures MT4 indicator finds and shows the Break Of Structures (BoS) pattern on the chart. The pattern is an important part of the Smart Money Concepts (SMC) system. The appearance of a pattern means that the price breaks the last peak of an uptrend, or the last bottom of a downtrend. This indicates a change in the existing trend structure and the beginning of a new movement. BOS is a technical analysis tool used to identify trend reversals. The set of input parameters is simple
    FREE
    The script allows to use the mouse for placing a grid of orders with fixed or variable step quickly and with as few mistakes as possible. Drag the script to the chart using the left mouse button and release. The grid will be plotted starting from that point. If the current price is lower than the grid start point, the grid will be placed "to the north" towards the buys, and if higher - towards the sells, "to the south". Setting take profit and stop loss is left to trader's discretion. Input Pa
    CloneChartMT5
    Andrei Novichkov
    5 (1)
    This utility clones the chart it is running on. It opens the same chart with the same graphical objects, set of indicators (saving the parameters) and the rest of the elements. In essence, it performs a deep copying of the original chart, transferring the template to the opened chart. The symbol and the timeframe of the original chart are also saved.
    FREE
    CloneChartMT4
    Andrei Novichkov
    5 (2)
    This utility clones the chart it is running on. It opens the same chart with the same graphical objects, set of indicators (saving the parameters) and the rest of the elements. In essence, it performs a deep copying of the original chart, transferring the template to the opened chart. The symbol and the timeframe of the original chart are also saved.
    FREE
    The script allows to use the mouse for placing a grid of orders with fixed or variable step quickly and with as few mistakes as possible. Drag the script to the chart using the left mouse button and release. The grid will be plotted starting from that point. If the current price is lower than the grid start point, the grid will be placed "to the north" towards the buys, and if higher - towards the sells, "to the south". Setting take profit and stop loss is left to trader's discretion. Input Pa
    Модифицируйте тейк профит и стоп лосс сети ордеров с помощью мыши. Перетащите скрипт на график левой кнопкой мыши и отпустите. Скрипт выставляет всем рыночным и отложенным ордерам раздельно, единый стоп лосс и единый тейк профит, используя величину цены в точке окончания перетаскивания. Входные параметры Buy or sell - Ордера какого типа подлежат модификации. Возможны два варианта: All BUY - все ордера на покупку All SELL - все ордера на продажу По умолчанию значение этого параметра All BUY. Wh
    If a complex grid with specified stop loss and take profit levels has been created in the wrong place by mistake, it is not necessary to remove it and start over again. The grid can be moved to a new place using the mouse. Drag the script to the chart and drop it where the grid should be moved. The grid will be moved, keeping the distance between orders, distances to stop loss and take profit. The script works exclusively with pending orders , market orders will be left unchanged. Input Parame
    The "VSA on the FLY" indicator is designed to quickly display various Volume Profile / Market Profile parameters.. The indicator takes the initial data for operation from the M1 timeframe. The indicator is installed on any timeframe and starts displaying data starting from the selected left border. This can be the beginning of a day, a week, a trading session, any hour, etc. The version of this indicator for MetaTrader 5 can be found here . The following input parameters are available: Show
    "Scalper Channel MT4" is a modern channel indicator that shows the trader the direction of the trade. For work, the indicator uses built-in and proprietary technical means and a new secret formula. Load it on the chart and the indicator will show you the entry direction in color: If the upper limit of the price channel of the indicator is blue, open a buy position. If the lower limit of the price channel of the indicator is red, open a sell position. If the border of the indicator is gray, ne
    Indicator ICT Implied Fair Value Gap (IFVG) is an important part of the Smart Money Concepts (SMC) system. It looks for and shows on the chart a modern pattern - the Fair Value Gap ( FVG ). This pattern is a three candlestick imbalance formation based on the discovery of a mismatch between supply and demand. This happens when the price moves quickly in one direction without encountering resistance. The result is a "gap", which can be filled in later. The indicator finds this pattern using the up
    The Market Structures Pro indicator finds and displays 5 (five) patterns of the Smart Money Concepts (SMC) system on the chart, namely: Break Of Structures (BoS)       Change of character (CHoCH) Equal Highs & Lows Premium, Equilibrium and Discount zones with Fibo grid High-high, Low-low, High-low and Low-high extremes Patterns are displayed for two modes - Swing and Internal and are easily distinguished by color on the chart. Internal mode features higher contrast colors, finer lines, and sm
    Modify the take profit and stop loss of orders grid using the mouse. Drag the script to the chart using the left mouse button and release. The script sets a single stop loss and take profit to all positions and pending orders separately, using the price value at the final point of dragging. Input Parameters Buy or sell - the type to be modified. There are two options: All BUY - all buy orders and positions (this parameter is set to All BUY by default.) All SELL - all sell orders and positions
    If a complex grid with specified stop loss and take profit levels has been created in the wrong place by mistake, it is not necessary to remove it and start over again. The grid can be moved to a new place using the mouse. Drag the script to the chart and drop it where the grid should be moved. The grid will be moved, keeping the distance between orders, distances to stop loss and take profit. The script works exclusively with pending orders , market orders will be left unchanged. Input Parame
    The "VSA on the FLY" indicator is designed to quickly display various Volume Profile / Market Profile parameters.. The indicator takes the initial data for operation from the M1 timeframe. The indicator is installed on any timeframe and starts displaying data starting from the selected left border. This can be the beginning of a day, a week, a trading session, any hour, etc. The version of this indicator for MetaTrader 4 can be found here . The following input parameters are available: Show
    "Scalper Channel MT5" is a modern channel indicator that shows the trader the direction of the trade. For work, the indicator uses built-in and proprietary technical means and a new secret formula. Load it on the chart and the indicator will show you the entry direction in color: If the upper limit of the price channel of the indicator is blue, open a buy position. If the lower limit of the price channel of the indicator is red, open a sell position. If the border of the indicator is gray, ne
    Indicator ICT Implied Fair Value Gap (IFVG) is an important part of the Smart Money Concepts (SMC) system. It looks for and shows on the chart a modern pattern - the Fair Value Gap ( FVG ). This pattern is a three candlestick imbalance formation based on the discovery of a mismatch between supply and demand. This happens when the price moves quickly in one direction without encountering resistance. The result is a "gap", which can be filled in later. The indicator finds this pattern using the up
    The Market Structures Pro indicator finds and displays 5 (five) patterns of the Smart Money Concepts (SMC) system on the chart, namely: Break Of Structures (BoS)       Change of character (CHoCH) Equal Highs & Lows Premium, Equilibrium and Discount zones with Fibo grid High-high, Low-low, High-low and Low-high extremes Patterns are displayed for two modes - Swing and Internal and are easily distinguished by color on the chart. Internal mode features higher contrast colors, finer lines, and sm
    フィルタ:
    vega17
    38
    vega17 2023.06.21 11:10 
     

    Работает, но при открытии новой позиции нет автопересчета, необходимо поновой привязывать к графику.

    Andrei Novichkov
    21360
    開発者からの返信 Andrei Novichkov 2023.06.21 19:43
    Нужно перекомпилить для новых билдов.
    削除済み 2019.01.14 07:35 
     

    ユーザーは評価に対して何もコメントを残しませんでした

    Gennadiy Voltornist
    11909
    Gennadiy Voltornist 2018.02.10 18:53 
     

    ユーザーは評価に対して何もコメントを残しませんでした

    Ali irwan
    5137
    Ali irwan 2017.07.25 07:12 
     

    ユーザーは評価に対して何もコメントを残しませんでした

    レビューに返信
    バージョン 2.0 2020.09.28
    Перекомпилировано под новые версии терминала