Zero Lag MACD Mr
- インディケータ
-
Bhavdip R Mangukiya -
 8 years of experience in Personal trading and 4 years of experience in Coding.
So I can read your strategy understand it and develop it. Trading is really very hard thing.
some times some minor parameters can boost the result of the EA trading. I m able to find out those minor parameters. - バージョン: 1.0
Zero-Lag MACD: Complete Guide & Effective Use Cases
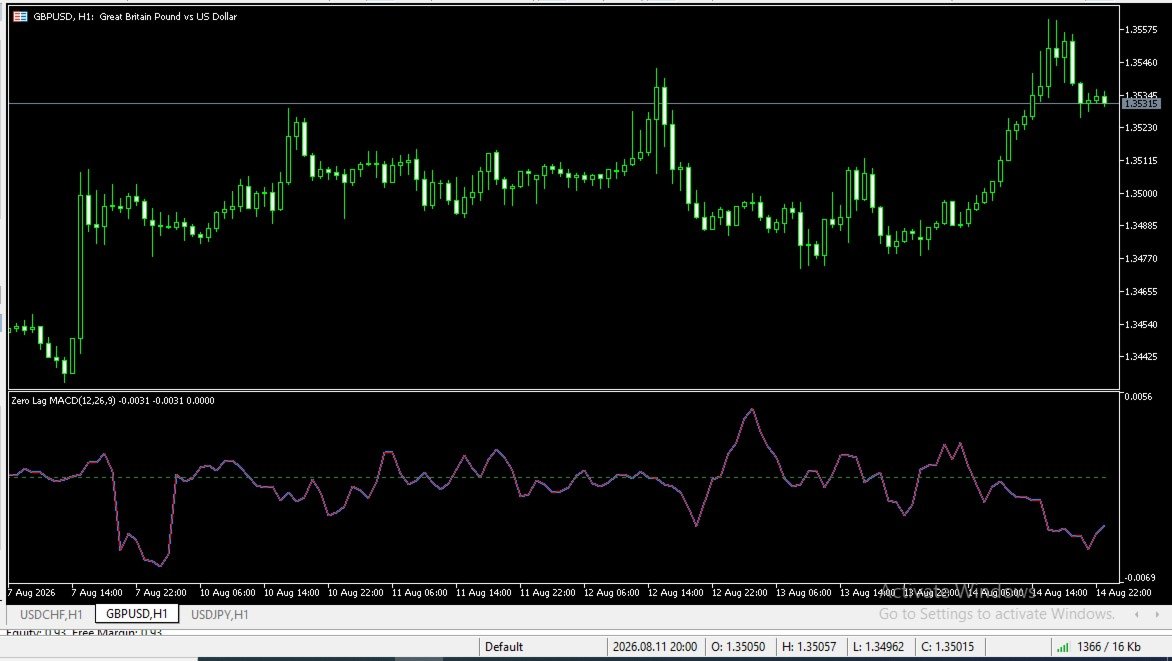
Traditional MACD indicators often suffer from "lag" (delay), meaning price movements have already occurred by the time the MACD generates a signal. To solve this problem, the Zero-Lag MACD is built using the ZLEMA (Zero-Lag Exponential Moving Average) formula. It reacts much faster to price action, providing traders with earlier and more accurate entry and exit points.
Key Components of the Indicator
-
Zero-Lag MACD Line (Blue Line): Represents the difference between the Fast ZLEMA and Slow ZLEMA, indicating overall trend direction and momentum.
-
Signal Line (Red Line): A smoothed average of the MACD line, used for identifying crossovers.
-
Histogram (Green & Crimson/Red): Visualizes the distance between the MACD line and the Signal line.
-
Green Bars: Indicate strong bullish momentum (uptrend).
-
Crimson Bars: Indicate strong bearish momentum (downtrend).
-
Best & Most Effective Trading Strategies
1. MACD & Signal Line Crossover Strategy (Most Popular)
This is the most common and effective way to trigger trades:
-
Bullish Entry (Buy): When the Blue Line (Zero-Lag MACD) crosses above the Red Line (Signal Line) and the histogram turns green, signaling upward momentum.
-
Bearish Entry (Sell): When the Blue Line crosses below the Red Line and the histogram turns crimson, signaling downward momentum.
2. Zero-Line Crossover Strategy (Trend Confirmation)
The center line ( 0.00 ) acts as the zero-line separator:
-
Uptrend Confirmation: When the MACD line and histogram move above the zero-line, buyer dominance is confirmed, favoring long positions.
-
Downtrend Confirmation: When the MACD line and histogram move below the zero-line, seller dominance is confirmed, favoring short positions.
3. Histogram Momentum Shift (Early Warning)
-
When histogram bars begin shrinking from larger to smaller sizes, it indicates that the current trend is losing momentum.
-
The histogram changes color ahead of a potential trend reversal, allowing you to lock in profits early or trail your stop loss.
4. Divergence Trading (Reversal Setup)
Divergence is a powerful tool for catching major reversals:
-
Bullish Divergence: When price action forms a lower low, but the Zero-Lag MACD prints a higher low, signaling an impending upward reversal.
-
Bearish Divergence: When price action forms a higher high, but the indicator prints a lower high, signaling a potential downward reversal.
Pro Tips for Best Results
-
Optimal Timeframes: This indicator performs exceptionally well on M15, M30, H1, and H4 timeframes, making it ideal for both day trading and swing trading.
-
Avoiding Fakeouts: Avoid taking every single crossover in a sideways or range-bound market. Combine it with support/resistance levels or volume indicators to filter out false signals.