Integrated Bloomberg Dashboard
- インディケータ
-
Marian Beceanu
 My Atlas Enterprise Matrix:
https://www.mql5.com/en/market/product/183575?source=Site+Profile+Seller - バージョン: 2.10
- アクティベーション: 10
Why It Matters
Every trader eventually runs into the same problem: too many charts, too many windows, too much fragmented information . You open 9 timeframes, apply 10 indicators to each, and try to keep track of what each one says, on each interval, in real time. It's exhausting, it's slow, and worst of all — it's easy to lose sight of exactly the combination of signals that mattered.
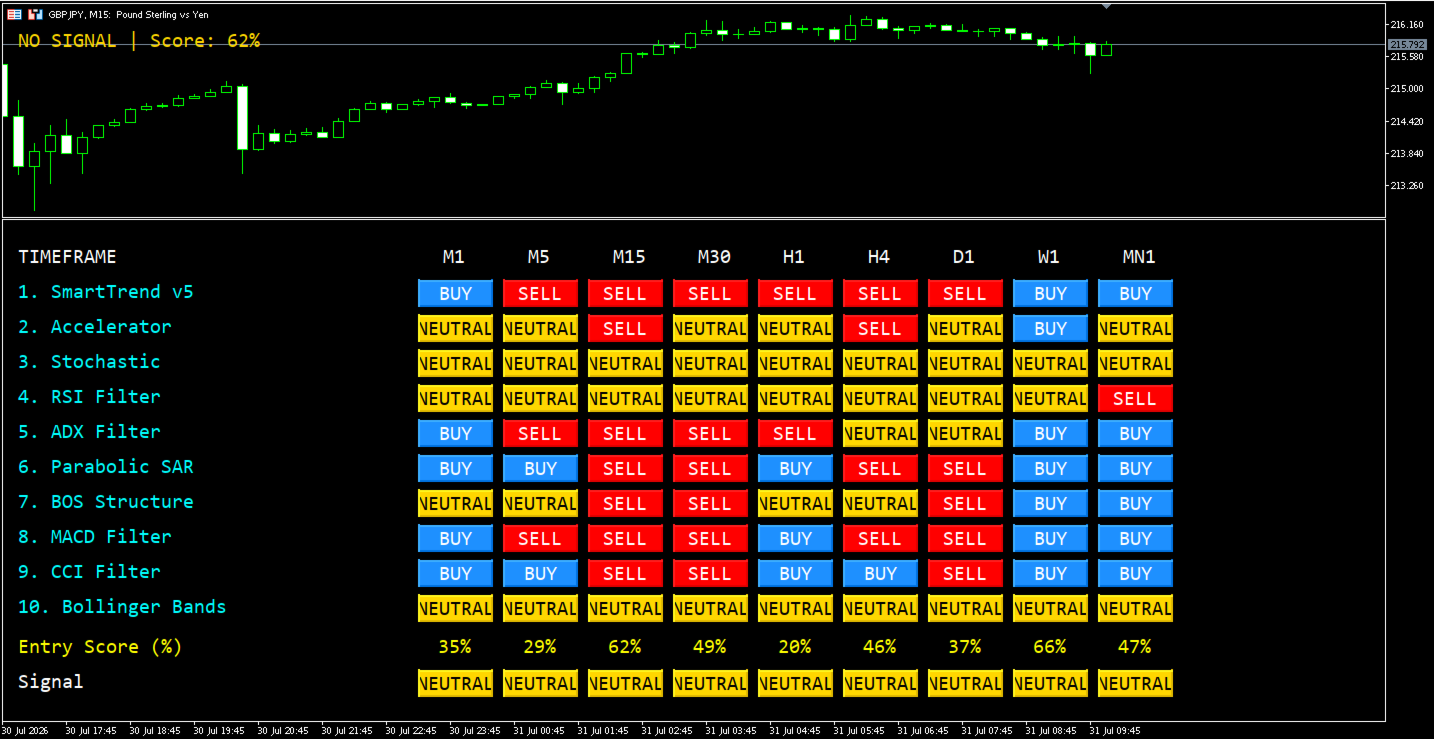
Integrated Bloomberg Dashboard solves exactly that: it turns multi-timeframe technical analysis into a single glance . You no longer search for confluence — it's shown to you. You no longer calculate Stop Loss, Take Profit, and the risk:reward ratio by hand — they appear already computed, updated live, right in the dashboard's header.
What It Adds on Top of "Just Another Indicator"
-
Instant complete overview : 9 timeframes (from M1 to MN1) and 10 technical methodologies, all synthesized on a single screen. What would otherwise take dozens of minutes of switching between charts is visible here in one look.
-
A single number that matters : instead of interpreting RSI, MACD, ADX, Bollinger, Stochastic, and the rest separately, the dashboard combines them into a single confluence score , weighted according to the importance you assign to each one. In practice, you decide what "weighs" more in your strategy, and the system does the math.
-
Built-in risk filter, not just a signal : many indicators tell you "buy" or "sell" and leave the rest of the calculations to you. Here, if the automatically calculated risk:reward ratio doesn't clear the threshold you've set, the system rejects the signal on its own — even if a BUY or SELL technically appeared. It's a form of discipline built directly into the tool, not something you have to manually enforce every time.
-
Adaptable to any trading style : because each methodology has its own adjustable weight, the same dashboard can be "reconfigured" — without a single line of code — to behave like a trend-following tool or a mean-reversion one. You're not buying 10 different indicators, you're buying a system that molds itself to your style.
-
Market structure confirmation , not just oscillators: alongside the classic indicators (RSI, MACD, Stochastic, ADX, CCI, Bollinger, Parabolic), the dashboard includes a dedicated component for identifying structure breaks (swing high/low), bringing a "price action" perspective alongside the classic oscillator-based analysis.
-
Stable, low-maintenance operation : built for continuous use — on a PC or a VPS — with automatic recovery if a connection or a data request temporarily fails, without needing to manually restart the indicator.
What a Trader Actually Gains From Using It
-
Time . Instead of manually analyzing 9 charts several times a day, you get a constantly updated summary, at a refresh rate you control.
-
Clarity . BUY/SELL/NEUTRAL signals, color-coded and displayed as buttons, remove interpretation ambiguity — you instantly see where timeframes align and where they don't.
-
Discipline . The risk:reward filter protects you from the impulse to enter on a technically "nice-looking" signal that carries an unfavorable risk/reward ratio.
-
Strategic flexibility . You can orient the same tool toward swing trading on higher timeframes, scalping on M1/M5, or position confirmation on medium-term trades — just by adjusting weights and thresholds.
-
Context, not just a signal . You don't just get a plain "buy now" — you get the full picture: what the small timeframes say, what the big ones say, where there's real confluence, and where it's just noise.
Trading Methods — Explained in Detail
1. Top-Down Confluence ("top-to-bottom" style) You first look at the higher timeframes — Daily and H4 — to establish the market's dominant direction, as a strategic backdrop. Only then do you move down to your execution timeframe (say, M15 or H1) and wait for the signal there to confirm the same direction. The advantage of this approach is that you trade with the bigger trend, not against it — significantly reducing the risk of getting caught in a corrective move.
2. Header Trading — Simple and Direct You attach the dashboard directly to the chart you trade on and use only the top line: the final signal, entry price, Stop Loss, and Take Profit, all already calculated. This is the ideal method for anyone who wants a fast workflow, without manually analyzing every row of the matrix.
3. Market Structure as a "Veto" You use the dedicated structure-break row (BOS) as a validation filter: if all the other methodologies show a signal but market structure doesn't confirm the same direction, you wait. This is a method preferred by traders who emphasize price action and want "real" confirmation, not just a statistical one.
4. Tracking the Entry Score (Momentum on Confluence) Instead of waiting for a firm BUY or SELL button to appear, you watch the evolution of the percentage entry score. A rapid rise toward your confluence threshold can function as an early signal — an "alert" that an opportunity is forming, even before the full signal is confirmed.
5. Timeframe Divergence as an Opportunity When the smaller timeframes show one direction while the larger ones show the opposite, you actually have two valid options: either interpret it as a temporary correction within the larger trend (and look for entries in the direction of that larger trend, on the price's return), or exploit the short-term move on the smaller timeframes, with closer profit targets.
6. Custom Configuration by Trading Style For a trend-oriented profile, you increase the weights given to market structure, ADX, and MACD, reducing the influence of reversion oscillators. For a mean-reversion-oriented profile, you do the opposite — emphasizing Stochastic, RSI, CCI, and Bollinger Bands. Without changing the tool itself, you completely change its "personality."
An honest note: this dashboard is an analysis and information-organization tool — not a guarantee of profit and not an automated execution system. Like any technical tool, it works best when combined with risk management, discipline, and an understanding of market conditions.