• 概要
  • レビュー (1)
  • コメント (4)
  • 最新情報

MarginGrid

3

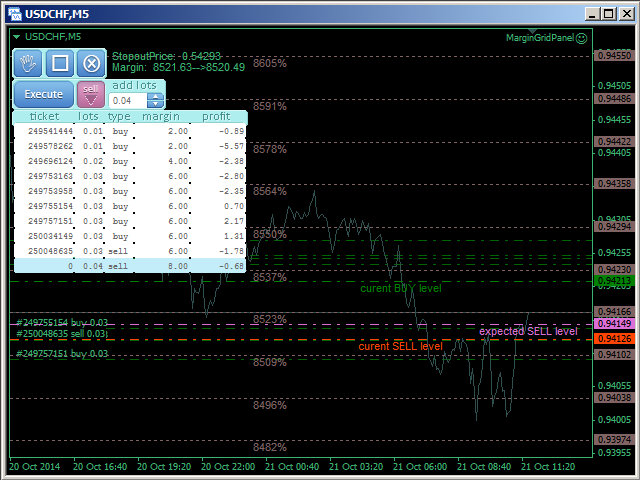
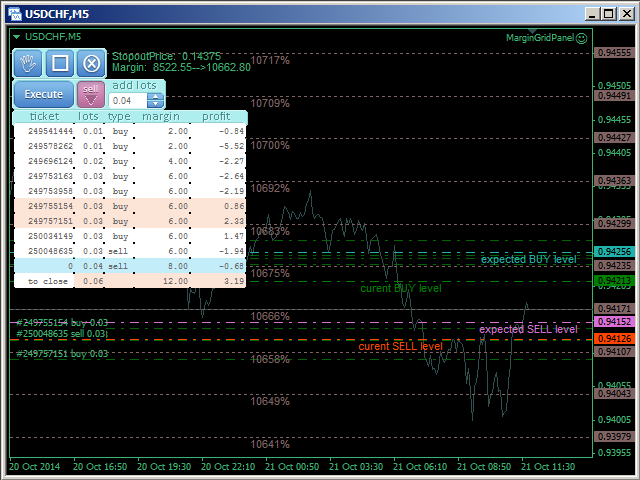
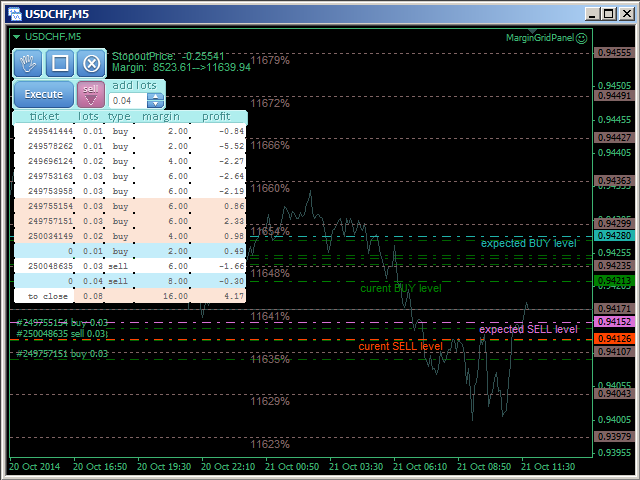
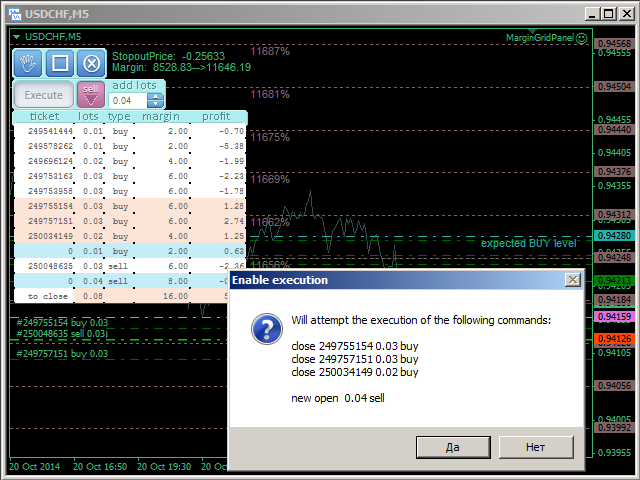
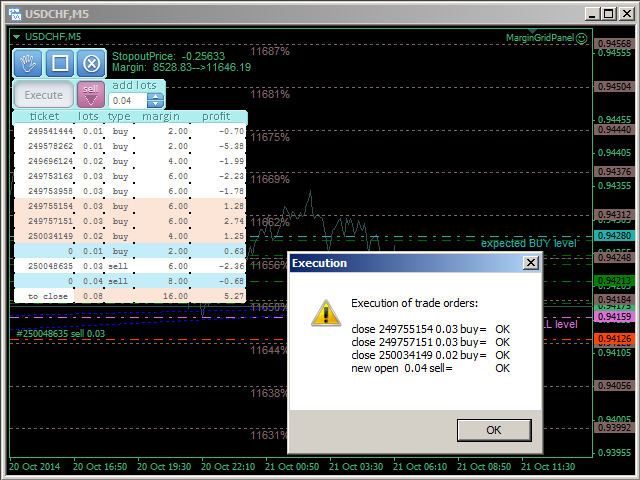
The analyzer allow estimating how the margin level changes when a position price or volume changes.

It also displays price level at which StopOut and MarginCall may occur.


Parameters:

  • volume position upgrading - the number of lot position changes.
  • number of levels on the chart - the number of levels plotted on the chart
  • levels color - color for drawing levels


おすすめのプロダクト
The utility displays the order book, as well as increases its depth, remembering the location of applications that have gone beyond the current "window" view. With the utility user can perform quick trading actions in one click - placing/cancelling/editing of explicit and hidden orders, and also opening/editing positions. Utility features The orders book display works only on those trading symbols for which it is broadcast by the broker. To reset the information about the rows that were record
CalendarFilter
Kiyoshi Mizu Miyabi Nori
Are you having trouble with too many events in the economic calendar? This reduces to the minimum number you need. You can filter by country code importance any key words and you can receive alerts before the set time of the event. ++++++++++++++ If country code is blank, display available code on the expert tab. You need to turn off the automatic calendar update setting in MT5. Any sound file of .wav format in Sounds directory. The length of keyword characters is limited by MT5.
FREE
A depth of market product is a powerful trading tool that provides a comprehensive view of the supply and demand levels for a particular financial instrument. It provides traders with a real-time display of all the buy and sell orders that are currently available in the market, allowing them to make more informed trading decisions based on the most up-to-date information available. With Valle Depth Of Market , traders can see not only the best bid and ask prices, but also the volume of orders at
Горячие клавиши плюс клик левой кнопки мыши на графике. Советник открывает сделки, выставляет лимитные и стоповые ордера, удаляет ордера и закрывает позиции, также  делает реверс  открытых позиций, выставляет прописанные в настройках стоп лосс и тейк профит. (реверс только на неттинговых счетах) При запуске советника можно посмотреть подсказку как действует советник при нажатии клавиши + клик на графике. Правее последнего бара, ниже цены Ctrl+ЛКМ  - OpenSell Правее последнего бара, выше цены
Making Charting simple! The Support/Resistance EA combines a sophisticated neural network algorithm with an Average Range computation to make your supply and demand zones easy to spot! The EA is very easy to use and can save you valuable time when charting through financial instruments. Areas of consolidation are highlighted according to your preference and timeframe, making it easier to identify areas of break-out or small regions to scalp.  Features :  Choose two Timeframes (From 1 Minute
Volume Calculator Botti
Guilherme Bitencourt Botti
2.33 (3)
Volume Calculator This indicator shows the volume to be used in an operation based on the maximum acceptable stop value and the size of the stop. That way you will not use a calculator to calculate the volume you are going to use every time. This indicator makes your life much easier and faster. Suitable for any type of trader: Scalper, DayTrader, SwingTrader.
FREE
Prior Lines
Ricardo Almeida Branco
This indicator shows on the current day some lines of interest, such as maximum, minimum and closing of the previous day, as well as the opening, maximum and minimum price of the current day. It can also show the GAP (closing of the previous day and opening of the current day) and projections of the amplitude of the previous day, according to the value you choose in the multiplier. Oh, I was going to forget. It is also possible to determine the time frame, which is daily by default. If th
ボリュームプロファイルは、特定の資産の取引ボリュームをさまざまな価格水準で表示するチャートツールです。これはトレーダーに、特定の価格間隔でのボリュームの分布に関する貴重な洞察を提供し、重要なサポートとレジスタンスレベル、高い取引活動の可能性のあるエリアを特定するのに役立ちます。 MT5のVolume Profile EAの入力パラメータは次のとおりです。 1. RangeMode:ボリュームプロファイルを計算するためのモードを決定します。利用可能なオプションには「VP_RANGE_MODE_BETWEEN_LINES」(指定された2つのライン内でプロファイルを計算する)などがあります。 2. RangeMinutes:RangeModeが時間ベースのモードに設定されている場合、ボリュームプロファイルを計算するための分単位の範囲を指定します。 3. ModeStep:ポイント単位のモードステップを表します。これはボリュームプロファイルの各モードレベルの範囲間隔を決定します。 4. HgPointScale:ボリュームプロファイルに表示される価格レベルのスケールを指定
FREE
Playback of previously saved data from the order book. Key features: Historical data navigation Adjusting the playback speed with the "---" and "+++" buttons, as well as with the mouse, you can by scrolling the wheel over the area of ​​these buttons and between them Turning Price Centering On and Off Time display accurate to thousandths of a second Attention: This product also needs a utility to save data: https://www.mql5.com/en/market/product/71642
FREE
Trading Utility for Forex Currency Pairs Only not for Gold  Functions Auto Lot Calculation based on Risk Auto stoploss  Auto TakeProfit Breakeven Auto Close Half % Close in percentage with respect to the PIPs Pending Orders BuyLimit Sell Limit with distances BuyStop Sell Stop    with distances Trading Informations Risk in percentage For Multiple trades Combine Takeprofit and Combine Stoplosses
This QuickClose help you to close all orders having profit immediately with only ONE CLICK, its work is very fast. You can choose which symbol you want or close all symbols so it will helpful for you in your trading to manage trading faster. This EA can quick close all Buy and Sell Orders by a selected symbol or total, And delete all pending orders. This SymbolButton is designed for closing orders. There is available Manual and Automatic closing functions. Automatic closing function will close t
Weis Waves
Flavio Javier Jarabeck
3.15 (26)
The original author is David Weis, an expert in the Wyckoff Method. The Weis Wave is a modern adaptation of the 1930's Wyckoff Method, another expert in Tape Reading techniques and Chart Analysis. Weis Waves takes market volume and stacks it into waves according to price conditions giving the trader valuable insights about the market conditions. If you want to learn more about this subject you can find tons of videos in YouTube. Just look for "The Wickoff Method", "Weis Wave" and "Volume Spread
FREE
The utility draws pivot levels based on a selection from day week month The previous candlestick of the selected timeframe is taken and the values for the levels are calculated using the following formulas: Pivot = (high + close + low) / 3 R1 = ( 2 * Pivot) - low S1 = ( 2 * Pivot) - high R2 = Pivot + (R1 -S1) R3 = high + ( 2 * (Pivot - low)) S2 = Pivot - (R1 - S1) S3 = low - ( 2 * (high - Pivot)); The style and thickness for all lines are adjusted. The colors for the R, Pivot and S line
FREE
Expansoes M
Marcus Vinicius Da Silva Miranda
The M Extensions are variations of the Golden Ratio (Fibonacci Sequence). It is the World's first technique developed for Candle Projections. Advantages: Easy to plot. Candle anchoring; High and accurate precision as support and resistance; Excellent Risk x Return ratio; Works in any timeframe; Works in any asset / market.   The M Extensions are classified into: M0: Zero point (starting candle) RC: Initial candle control region M1: Extension region 1 M2: Extension region 2 M3: Extension r
FREE
Order Book, known also as Market Book, market depth, Level 2, - is a dynamically updated table with current volumes of orders to buy and to sell specific financial instument at price levels near Bid and Ask. MetaTrader 5 provides the means for receiving market book from your broker, but in real time only, without access to its history. The indicator OrderBook Cumulative Indicator accumulates market book data online and visualizes them on the chart. In addition, the indicator can show the market
Partial Close Panel
Carter Kyle Capital Inc.
4 (1)
The Partial Close Panel is a very useful MQL5 trading tool designed to provide traders with granular control over their trading positions. Key features of this script include: Partial Closure: This functionality allows traders to partially close their positions, setting a custom percentage of lots to close. The volume is flexible, allowing for precision management of risk and profit. Stop Loss Adjustment: This script supports dynamic stop loss adjustment to break-even points. This function can a
Tick Volume Chart — fixed volume bars for MetaTrader 5. The utility creates charts on which each candle has a fixed tick volume. Data sampling is carried out not by time but by the tick volume. Each bar contains a given (fixed) tick volume. The tick volume can be adjusted by changing the value in a special field. You can apply indicators, Expert Advisors and scripts to the tick chart. You get a fully functional chart, on which you can work just as well as on a regular chart. The graph is built n
This indicator is especially for the binary trading. Time frame is 1 minutes and exp time 5 or 3 minutes only. You must be use martingale 3 step. So you must put lots size is 10 % at most. You should use Mt2 trading platform to connect with my indicator to get more signal without human working. This indicator wining rate is over 80% but you may get 100% of profit by using martingale 3 step. You should use MT2 Trading Platform to connect meta trader platform and binary platform . You can get mt2
FREE
Exclusive FOREX account HEDGE FuzzyLogicTrendEA is based on fuzzy logic strategy based on  analysis 5 indicators and filters. When the EA analysis all this indicators, it decides, based on its fuzzy strategy, which trade will be better: sell or buy. As additional functions, it´s possible defines spread maximum, stop loss and others. Recomm. Symbol: EURUSD, AUDUSD, GBPUSD, NZDUSD, USDCAD, AUDCAD, EURCAD e USDJPY Recomm. timeframe: H1. Backtest were done on EURUSD, H1, 01/07/2023 - 26/0
Индикатор для синхронизации и позиционировании графиков на одном и более терминалах одновременно. Выполняет ряд часто необходимых при анализе графиков функций: 1. Синхронизация графиков локально - в пределах одного терминала при прокрутке, изменении масштаба, переключении периодов графиков, все графики делают это одновременно. 2. Синхронизация графиков глобально - тоже самое, но на двух и более терминалах, как МТ5, так и МТ4. 3. Позиционирование графика на заданном месте при переключении периодо
FREE
Com este Expert Advisor tenha a possibilidade de fechar todas as posições de forma automatizada. Tenha em mãos o recurso de fechar as posições e ordens pendentes por ações, Dólar, Índice ou TODOS estes juntos, algo inovador no mercado. Ideal para quem quer uma segunda camada de segurança para suas operações automatizadas ou ainda que o próprio robô feche suas operações manuais em um horário programado. Promoção de 30 dólares para a três primeiras assinatura, posteriormente será cobrado 50
--- StudentK Ict Smc Structure --- 1. Inner Circle Trading 2. Smart Money Concept 3. Structure --- What are included in tool --- 1. Market Session Box 2. Kill Zone 3. High/Low 4. Imbalance 5. FU Candle 6. Thicker Wick + Doji Candlestick 7. StudentK's Structure Line 8. Pivot Point --- Context --- StudentK is not indicated as a master or K Sir for knowledgeable person who claims for winning all the time. (But lots of traders should know the fact that it is rarely truth, especially
| Fully-automated Smart Money Concept (ICT) inspired trading solution with multi-strategy capabilities | Built by a grid trader >> for grid traders.  This is MT5 version, click  here  for  Blue CARA MT4  (settings and logics are same in both versions)     Real monitoring signal  -->  Cara Gold Intro Blue CARA EA   ('CARA') - short for  C omprehensive  A lgorithmic   R esponsive   A dvisor is a next-gen  multi-currency    multi-timeframe  EA base on the widely known (and perhaps the most popul
OrderBook Utilities is a script, which performs several service operations on order book hob-files, created by OrderBook Recorder . The script processes a file for work symbol of the current chart. The file date is selected by means of the input parameter CustomDate (if it's filled in) or by the point where the script is dropped on the chart. Depending from the operation, useful information is written into the log, and optionally new file is created. The operation is selected by the input parame
FREE
MT5用バイナンス取引ツール 1. この製品には、WebSocket からのライブ チャート、履歴チャート、 mt5ターミナルの再起動時に自動更新され、手動介入なしでスムーズに動作し、バイナンスをスムーズに取引できるようになります。 スポットと先物で利用可能な取引、ライブチャート、履歴データ 使い方 : 1. このユーティリティの入力フィールドに API キーとシークレットを追加する必要があります。 API を作成するときは、必ず先物取引を有効にしてください。 3. [ツール] > [オプション] > [URL からの Web リクエストを許可] タブで説明されているように Binance API URL を追加し、Web リクエストを許可するチェックボックスにチェックを入れる必要があります。 バイナンススポット URL 1: api.binance.com URL 2: stream.binance.com バイナンス先物 URL 1: fapi.binance.com URL 2: fstream.binance.com これら
CloseAllPosition
Konstantin Chernov
4.67 (3)
A script for closing positions If you need to quickly close several positions, this script will make all the routine for you! The script does not have any input parameters. Allow AutoTrading before running the script. Usage: Run the script on a chart. If you need to specify the maximal deviation and the number of attempts to close positions, use the script with input parameters https://www.mql5.com/en/market/product/625 You can download MetaTrader 4 version here: https://www.mql5.com/en/market
FREE
Gold instrument scanner is the chart pattern scanner to detect the triangle pattern, falling wedge pattern, rising wedge pattern, channel pattern and so on. Gold instrument scanner uses highly sophisticated pattern detection algorithm. However, we have designed it in the easy to use and intuitive manner. Advanced Price Pattern Scanner will show all the patterns in your chart in the most efficient format for your trading. You do not have to do tedious manual pattern detection any more. Plus you
インディケータは、フィボナッチのサポートとレジスタンスのレベルを自動的に計算してプロットします。これは、市場分析に最も効果的なツールの1つです。 計算では、選択した期間と時間枠の平均価格データが使用されます。この期間の最小値と最大値は、移動の開始と終了と見なされます。 フィボナッチレベルを使用すると、価格の動きが遅くなったり逆転したりする可能性のある潜在的な参照ポイントを確認できます。つまり、フィボナッチレベルは、さらなる動きを予測したり、ストップ注文や指値注文を行うために使用されます。 パラメーター: PartsShow-現在のバーから表示された履歴レベルの数 CalcPeriod-価格平均期間 SmoothingMethod-価格平均化方法(26オプション) TF-計算に使用される時間枠 LevelColor-レベルラインの色 ZeroLevelColor-ゼロレベルの色 ShowVerticalLine-レベル間の垂直線の表示を有効/無効にします VLineStyle-垂直線のスタイル VLineColor-垂直線の色 ShowInfo-レベルパーセンテージの値に関する情報をラベ
Important Lines
Terence Gronowski
4.88 (26)
This indicator displays Pivot-Lines, preday high and low, preday close and the minimum and maximum of the previous hour. You just have to put this single indicator to the chart to have all these important lines, no need to setup many single indicators. Why certain lines are important Preday high and low : These are watched by traders who trade in a daily chart. Very often, if price climbs over or falls under a preday low/high there is an acceleration in buying/selling. It is a breakout out of
FREE
Was: $249  Now: $99   Market Profile defines a number of day types that can help the trader to determine market behaviour. A key feature is the Value Area, representing the range of price action where 70% of trading took place. Understanding the Value Area can give traders valuable insight into market direction and establish the higher odds trade. It is an excellent addition to any system you may be using. Inspired by Jim Dalton’s book “Mind Over Markets”, this indicator is designed to suit the
このプロダクトを購入した人は以下も購入しています
Trade Assistant MT5
Evgeniy Kravchenko
4.4 (171)
取引 ごとのリスクの 計算、新規注文 の 簡単 な 設置、部分的 な 決済機能 を 持 つ 注文管理、 7 種類 のトレーリングストップなど 、便利 な 機能 を 備 えています 。 注意、アプリケーションはストラテジーテスターでは機能しません。 説明ページからデモ版をダウンロードできます  Manual, Description, Download demo ライン機能 チャート上にオープニングライン、ストップロス、テイクプロフィットを表示します。この機能により、新規注文を簡単に設定することができ、注文を出す前にその特徴を確認することができます。   リスク計算 リスク計算機能は、設定されたリスクとストップロス注文のサイズを考慮して、新規注文のボリュームを計算します。ストップロスの大きさを自由に設定できると同時に、設定したリスクを守ることができます。 Lot calc ボタン - リスク 計算 を 有効 / 無効 にします 。 Risk フィールドでは 、必要 なリスクの 値 を 0 から 100 までのパーセンテージまたは 預金通貨 で 設定 します 。 設定」 タブで 、
価格が一瞬で変わる可能性のある市場では、注文はできるだけ簡単にすべきだと思いますか? Metatraderでは、注文を開くたびに、開始価格を入力し、損失を止めて利益を得るウィンドウと、取引サイズを開く必要があります。金融市場の取引では、初期預金を維持し、それを増やすために資本管理が不可欠です。それで、あなたが注文をしたいとき、あなたはおそらくあなたがどれくらいの大きさの取引を開くべきか疑問に思いますか?この単一の取引であなたの預金の何パーセントを危険にさらすべきですか?この取引からどれだけの利益を得ることができますか?また、リスクに対する利益の比率はどのくらいですか?トレードサイズを設定する前に、トレードサイズがどうあるべきかという質問に対する答えを得るために必要な計算を行います。 これらすべてを自動的に行うツールがあると想像してみてください。チャートを開き、市場分析を行い、エントリーポイント、ディフェンスポイント(ストップロス)、ターゲット(テイクプロフィット)を水平線でマークし、最後にリスクのレベルを定義します。利用可能な資本の%として、このトランザクションで負担することができ、こ
TradePanel MT5
Alfiya Fazylova
4.86 (113)
Trade Panel は、多機能の取引アシスタントです。 このアプリケーションには手動取引用に設計された 50 以上の機能が含まれており、ほとんどの取引アクションを自動化できます。 アプリケーションの主な機能: 任意のシンボル(外国為替、CFD、先物など)で機能します。 無制限の文字数での同時作業。 取引ごとのリスクの自動計算とストップロスとテイクプロフィットの比率の設定。 OCO注文を行うことができます(一方が他方をキャンセルします-1つの注文を実行すると別の注文がキャンセルされます)。 タスクを含む行を設定できます(ポジションを開く、保留中の注文を開く、またはグループごとに注文を閉じる)。 仮想テイクプロフィットとストップロスを設定できます。 成行注文を反転またはロックできます。 6種類のトレーリングストップ。 ストップロスを損益分岐点に設定する機能があります。 ポジションを部分的にクローズする機能があります(利益または損失の一部をクローズします)。 価格が特定のラインに達するとアラート機能があります。 自動および手動のスクリーンショット。 ワンクリックですべてのターミナルウィン
Local Trade Copier EA MT5
Juvenille Emperor Limited
5 (63)
Local Trade Copier EA MT5 による、驚くほど高速な取引コピーを体験してください。1分で簡単にセットアップできるこの取引コピー機は、同じWindowsコンピュータまたはWindows VPS上の複数のMetaTrader端末間で取引をコピーすることができ、0.5秒未満の高速コピースピードを実現します。 初心者であろうとプロのトレーダーであろうと、 Local Trade Copier EA MT5 には、あなたの特定のニーズに合わせてカスタマイズするための幅広いオプションが用意されています。これは、利益の可能性を高めたい人にとって究極のソリューションです。 今すぐ試してみて、これが市場で最も速くて簡単なトレードコピー機である理由を理解してください。 ヒント: デモアカウントで Local Trade Copier EA MT5 デモバージョンをダウンロードして試すことができます: ここ ダウンロードした無料のデモ ファイルを MT5 >> ファイル >> データ フォルダを開く >> MQL5 >> Experts フォルダに貼り付けて、ターミナルを再起動し
Trade Manager は、リスクを自動的に計算しながら、取引を迅速に開始および終了するのに役立ちます。 過剰取引、復讐取引、感情的な取引を防止する機能が含まれています。 取引は自動的に管理され、アカウントのパフォーマンス指標はグラフで視覚化できます。 これらの機能により、このパネルはすべてのマニュアル トレーダーにとって理想的なものとなり、MetaTrader 5 プラットフォームの強化に役立ちます。多言語サポート。 MT4バージョン  |  ユーザーガイド + デモ Trade Manager はストラテジー テスターでは機能しません。 デモについてはユーザーガイドをご覧ください。 危機管理 % または $ に基づくリスクの自動調整 固定ロットサイズを使用するか、ボリュームとピップに基づいた自動ロットサイズ計算を使用するオプション RR、Pips、または価格を使用した損益分岐点ストップロス設定トレーリングストップロス設定 目標に達したときにすべての取引を自動的に終了するための 1 日あたりの最大損失 (%)。 過度のドローダウンからアカウントを保護し、オーバートレードを防ぎます
The product will copy all telegram signal to MT5 ( which you are member) , also it can work as remote copier.  Easy to set up, copy order instant, can work with almost signal formats, image signal,  s upport to translate other language to English Work with all type of channel or group, even channel have "Restrict Saving Content", work with  multi channel, multi MT5 Work as remote copier: with signal have ticket number, it will copy exactly via ticket number. Support to backtest signal. How to s
Mentfx Mmanage mt5
Anton Jere Calmes
4.43 (7)
The added video will showcase all functionality, effectiveness, and uses of the trade manager. Drag and Drop Trade Manager. Draw your entry and have the tool calculate the rest. Advanced targeting and close portions of a trade directly available in tool (manage trades while you sleep). Market order or limit order on either side with factored spread. Just draw the entry, the tool does the rest. Hotkey setup to make it simple. Draw where you want to enter, and the stop loss, the tool calculates al
MT5 to Telegram Signal Provider は、Telegramのチャット、チャンネル、またはグループに 指定された シグナルを送信することができる、完全にカスタマイズ可能な簡単なユーティリティです。これにより、あなたのアカウントは シグナルプロバイダー になります。 競合する製品とは異なり、DLLのインポートは使用していません。 [ デモ ] [ マニュアル ] [ MT4版 ] [ Discord版 ] [ Telegramチャンネル ] セットアップ ステップバイステップの ユーザーガイド が利用可能です。 Telegram APIの知識は必要ありません。必要な全ては開発者から提供されます。 主な特長 購読者に送信する注文の詳細をカスタマイズする機能 例えば、Bronze、Silver、Goldといった階層型のサブスクリプションモデルを作成できます。Goldサブスクリプションでは、すべてのシグナルが提供されます。 id、シンボル、またはコメントによって注文をフィルターできます 注文が実行されたチャートのスクリーンショットが含まれます 追加の
This is exactly what the name says. Visual strategy builder . One of a kind. Turn your trading strategies and ideas into Expert Advisors without writing single line of code. Generate mql source code files with a few clicks and get your fully functional Expert Advisors, which are ready for live execution, strategy tester and cloud optimization. There are very few options for those who have no programming skills and can not create their trading solutions in the MQL language. Now, with Bots Build
Trade copier MT5
Alfiya Fazylova
4.35 (26)
Trade Copierは、取引口座間の取引をコピーして同期するように設計された専門的なユーティリティです。 コピーは、同じコンピューターまたはvps にインストールされている、サプライヤーのアカウント/端末から受信者のアカウント/端末に行われます。 購入する前に、デモ アカウントでデモ バージョンをテストできます。 デモ版 こちら 。 詳細な説明は こちら 。 主な機能と利点: MT5ネッティングアカウントを含む、MT5> MT5、MT4> MT5、MT5> MT4のコピーをサポートします。 高いコピー速度(0.5秒未満)。 ベンダーモードと受信者モードは同じ製品内に実装されています。 チャートから直接リアルタイムでコピーを制御できる、簡単で直感的なインターフェイス。 接続が切断されたり、端末が再起動されたりしても、設定と位置が失われることはありません。 コピーするシンボルを選択できます。また、受信者のシンボルを置き換えることもできます(例:EURUSD> USDJPY)。 バックコピーをサポートします。 特定の注文のみのコピーを有効にする機能。 取引開始価格の最大差と最大遅延時間を
-25% discount ($199 -> $149) Advanced trading tool: One click smart orders that execute under your conditions Developed by trader for trading community:  position size calculator (lot size), open position after price action, strategy builder, set and forget trading, mobile notifications... Risk Management -  Risk percentage position size calculator, gain percentage, target risk reward ratio, spread and commissions are included in calculations 7 Advanced order types  - Set and forget trading w
The top-selling EAs on the market cost a lot and one day they are suddenly gone. This is because one strategy will not work in the forex market all the time. Our product is unique from all others in the MQL Marketplace because our EA comes with 34+ built-in indicators that allow develop strategies every time.  You build your strategy and keep updating it. If one strategy does not work, simply build another all using only one EA. This is All-In-One EA   in this market place. You can use as trade
Tired of complex order placement and manual calculations? Trade Dashboard is your solution. With its user-friendly interface, placing orders becomes effortless, by a single click, you can open trades, set stop loss and take profit levels, manage trade lot size, and calculate risk to reward ratios, allowing you to only focus on your strategy. Say goodbye to manual calculations and streamline your trading experience with Trade Dashboard. Download   demo version   right now. You can find   deta
OrderManager をご紹介:MT5用の革新的なユーティリティ 新しく設計されたOrder Managerユーティリティを使用して、MetaTrader 5での取引をプロフェッショナルなものにしましょう。シンプルさと使いやすさに焦点を当てたこのユーティリティは、各取引に関連するリスクを簡単に定義し、視覚化できます。これにより、情報に基づいた意思決定が可能になり、取引戦略を最適化できます。OrderManagerに関する詳細は、マニュアルをご参照ください。 [ マニュアル ] [ MT4 バージョン ] [ Telegram チャンネル ] 主な特長: リスク管理:取引のリスクを素早く簡単に定義し、より良い意思決定を行い、取引パフォーマンスを向上させます。 視覚表現:オープンなポジションとそれに関連するリスクをグラフィカルに表示し、明瞭かつ簡潔な理解が可能です。 注文変更:数回のクリックで注文を簡単に変更またはクローズし、取引プロセスを効率化し、貴重な時間を節約します。 手のひらの上の最新ニュース:ボタン一つで最新の市場ニュースに常にアクセスできます。 MT5トレーダーにと
Botトークンや管理者権限の必要なしに、メンバーであるすべてのチャンネルからシグナルをコピーして、MT5に直接送信します。 多くの機能を提供しながら、ユーザーを考慮して設計されています この製品は、使いやすい視覚的に魅力的なグラフィカルインターフェースで提供されています。設定をカスタマイズして、数分で製品を使用開始できます! ユーザーガイド + デモ  | MT4バージョン | Telegramバージョン デモを試してみたい場合は、ユーザーガイドを参照してください。 DiscordからMT5への変換は、ストラテジーテスターで動作しません。 DiscordからMT5への変換の特長 メンバーである任意のチャンネルからコピーします。BotトークンやチャットIDは不要です リスク%または固定ロットを使用して取引 特定のシンボルを除外 すべてのシグナルをコピーするか、コピーするシグナルをカスタマイズします すべてのシグナルを認識するための単語やフレーズを設定します(デフォルトは99%のシグナルプロバイダーに適用されます) コピーするタイミングと日時の設定をカスタマイズします 一度に
Adam FTMO MT5
Vyacheslav Izvarin
5 (1)
ADAM EA Special Version for FTMO Please use ShowInfo= false for backtesting ! Our 1st EA created using ChatGPT technology Trade only GOOD and checked PROP FIRMS  Default parameters for Challenge $100,000 Tested on EURUSD and GBPUSD only  Use 15MIN Time Frame Close all deals and Auto-trading  before Weekend at 12:00 GMT+3  Friday For Prop Firms MUST use special Protector  https://www.mql5.com/en/market/product/94362 Signal using ADAM  https://www.mql5.com/en/signals/2190554 --------------------
UTM Manager は、迅速かつ効率的な取引執行を提供する直感的で使いやすいツールです。際立った機能の 1 つは、「スプレッドを無視」モードです。これにより、スプレッドを完全に無視して、ローソク足の価格で取引できるようになります (たとえば、LTF でより高いスプレッドのペアを取引でき、スプレッドによって取引から除外されるのを回避できます)。 UTM Manager のもう 1 つの重要な側面は、独自のローカル取引コピー機であり、各ブローカーで異なる取引戦略と設定 (たとえば、さまざまな TP、BE、およびリスク ルール) を柔軟に実行できます。 取引執行: 迅速かつ効率的な取引執行: チャート上のエントリー価格とストップロス価格をクリックして簡単に取引を入力するか、ワンクリックの固定ストップロスサイズ機能を使用します。 自動ロットサイズ計算: ロットは事前定義されたリスク設定に基づいて計算され、ドラッグによってポジションが変更されると再計算されます。 1 つまたは複数のポジションを同時に処理できる能力。 利益確定と損益分岐点: 柔軟なテイクプロフィット設定: 特定のリスク対報
あなたがメンバーである任意のチャネルから(プライベートおよび制限されたものを含む)シグナルを直接あなたのMT5にコピーします。  このツールは、トレードを管理し監視するために必要な多くの機能を提供しながら、ユーザーを考慮して設計されています。 この製品は使いやすく、視覚的に魅力的なグラフィカルインターフェースで提供されています。設定をカスタマイズして、数分で製品を使用を開始できます! ユーザーガイド + デモ  | MT4版 | Discord版 デモを試してみたい場合は、ユーザーガイドにアクセスしてください。 Telegram To MT5 受信機は、ストラテジーテスターで動作しません! Telegram To MT5の特徴 複数のチャネルから一度にシグナルをコピー プライベートおよび制限されたチャネルからシグナルをコピー BotトークンまたはChat IDは必要ありません   (必要に応じて使用することができます) リスク%または固定ロットを使用して取引 特定のシンボルを除外 すべてのシグナルをコピーするか、コピーするシグナルをカスタマイズするかを選択 すべてのシグナ
Grid Manual MT5
Alfiya Fazylova
4.83 (12)
「Grid Manual」は、注文のグリッドを操作するための取引パネルです。 ユーティリティはユニバーサルで、柔軟な設定と直感的なインターフェイスを備えています。 それは、損失を平均化する方向だけでなく、利益を増やす方向でも注文のグリッドで機能します。 トレーダーは注文のグリッドを作成して維持する必要はありません。 すべてが「Grid Manual」によって行われます。 注文を開くだけで十分であり、「Grid Manual」は注文のグリッドを自動的に作成し、非常に閉じるまでそれに付随します。 ユーティリティの主な機能と機能 ユーティリティは、モバイル端末から開かれた注文を含め、あらゆる方法で開かれた注文を処理します。 「制限」と「停止」の2種類のグリッドで機能します。 グリッド間隔の計算には、固定と動的(ATRインジケーターに基づく)の2つの方法で機能します。 オープンオーダーグリッドの設定を変更できます。 チャート上の各注文グリッドの損益分岐点を表示します。 各注文グリッドの利益率を表示します。 ワンクリックでグリッドから収益性の高い注文を閉じることができます。 ワンクリックで各注文
Trade Assistant 38 in 1
Makarii Gubaydullin
4.87 (15)
多機能ツール 搭載機能: ロット計算機、プライスアクション、リスク/リワードレシオ、トレードマネージャー、需要供給ゾーンなどをはじめ65以上の機能。 バージョ:デモ版   |   ユーザーマニュアル   |    MT5版 このユーティリティはストラテジー テスターでは機能しません。 ここからデモ   バージョンをダウンロードして製品をテストできます。 ご不明な点や改善提案、バグの発見などございましたら、 連絡してください 。 取引プロセスを簡素化、高速化、自動化します。このダッシュボードで標準端末機能を拡張します 1. 新しい取引を開始します : ロット / リスク / RR の計算 1. Lot計算機(リスクサイズに基づく取引量計算 2. リスク計算機(ロットサイズに基づくリスク量) 3. リスク/リワードレシオ (R/R) 4. 注文のアクティベーション トリガー + Buy StopLimit / Sell StopLimit 5. 仮想 SL / TP レベル (隠しSL、TP: ブローカーには見えない) 6.  Smart SL / エントリー レベル: バ
Hedge Ninja
Robert Mathias Bernt Larsson
Make sure to join our Discord community over at www.Robertsfx.com , you can also buy the EA at robertsfx.com WIN NO MATTER IN WHICH DIRECTION THE PRICE MOVES This robot wins no matter in which direction the price moves by following changing direction depending on in which direction price moves. This is the most free way of trading to this date. So you win no matter which direction it moves (when price moves to either of the red lines as seen on the screenshot, it wins with the profit target yo
ワンクリックで取引できるトレーディングパネル。ポジションと注文の操作!チャートまたはキーボードから取引。 当社の取引パネルを使用すると、チャートから直接シングルクリックで取引を実行でき、標準の MetaTrader コントロールよりも 30 倍高速に取引操作を実行できます。 パラメータと関数の自動計算により、トレーダーにとって取引がより速く、より便利になります。 グラフィックのヒント、情報ラベル、取引取引に関する完全な情報はチャート MetaTrader にあります。 MT4のバージョン 完全な説明   +DEMO +PDF 購入する方法 インストールする方法     ログファイルの取得方法     テストと最適化の方法     Expforex のすべての製品 手動取引用の取引パネル。チャート(チャートウィンドウ)またはキーボードから取引できます。  開閉、リバース、ロックポジションと注文を処理する МetaТrader5 のメインオーダーのトレーディングコントロールパネル:売買、売却、売却、売却、売却、閉じる、削除、修正、トレーリングストップ、ストップロス、takep
The most advanced news filter and drawdown limiter on MQL market NEW: Take a Break can be backtested against your account history! Check the " What's new " tab for details. Take a Break has evolved from a once simple news filter to a full-fledged account protection tool. It pauses any other EA during potentially unfavorable market conditions and will continue trading when the noise is over. Typical use cases: Stop trading during news/high volatility (+ close my trades before). Stop trading when
DrawDown Limiter
Haidar, Lionel Haj Ali
5 (17)
Drawdown Limiter EA You are in the right place if you were searching for Drawdown control, Drawdown limiter, Balance protection, Equity Protection or Daily Drawdown Limit related to Prop Firm, FTMO, or Funded account trading, or if you want to protect your trading account. Have you suffered from controlling your drawdown when trading funded accounts? This EA is meant for you. Prop firms usually set a rule called “Trader Daily Drawdown”, and if it is not respected, you are disqualified.  I am an
-25% discount ($149 -> $111) Everything for chart Technical Analysis indicator mt5 in one tool Draw your supply demand zone with rectangle and support resistance with trendline and get alerts to mobile phone or email alert -  Risk reward indicator mt5 Video tutorials, manuals, DEMO download   here .   Find contacts on my   profile . 1.   Extended rectangles and trendlines Object will be extended to the right edge of the chart when price will draw new candles on chart. This is rectangle extend
Profit or Loss Pad
Vladislav Andruschenko
4.5 (10)
利益追跡機能で総利益/損失に達したときにMetaTrader5のポジションをクローズします。   CloseIfProfitorLoss with Trailing 仮想停止(個別注文)を 有効にできます。 買いポジションと売りポジションを別々に 計算して閉じる(別々の買い売り)、 すべてのシンボルまたは現在のシンボルのみを 閉じて計算する(すべてのシンボル)、 利益のためにトレーリングを有効にする( トレーリング 利益) ポジションは、預金通貨、ポイント、%、およびドローダウンの 値に基づいてクローズされます。 このアプリケーションは、他のEAと一緒に、または手動取引と組み合わせて、任意のアカウントで使用するように設計されています。 MT4のバージョン 完全な説明   +DEMO +PDF 購入する方法 インストールする方法     ログファイルの取得方法     テストと最適化の方法     Expforex のすべての製品 一部またはすべてのペアの貿易収支の合計が設定で指定された値以上になるとすぐに、すべてのポジションがクローズされ、注文が削除されます。 このバージ
YuClusters
Yury Kulikov
4.93 (43)
Attention: You can view the program operation in the free version  YuClusters DEMO .  YuClusters is a professional market analysis system. The trader has unique opportunities to analyze the flow of orders, trade volumes, price movements using various charts, profiles, indicators, and graphical objects. YuClusters operates on data based on Time&Sales or ticks information, depending on what is available in the quotes of a financial instrument. YuClusters allows you to build graphs by combining da
This EA Utility allows you to manage (with advanced filtering) unlimited open orders (manual or EA) with 16 trailing stop methods: fixed, percent, ATR Exit, Chandelier Exit, Moving Average, Candle High Low Exit, Bollinger Bands, Parabolic, Envelope, Fractal, Ichimoku Kijun-Sen, Alligator, Exit After X Minutes or Bars, RSI and Stochastic. The trailing stop can be either real or virtual, and you can exit fully or with a partial close percent on touch or bar close.  Moreover, you can add (overri
あなたの外国為替ポートフォリオを管理してください。あなたが立っている場所、何が働いているのか、そして何があなたに痛みを引き起こしているのかを即座に見てください! ここで利用可能なMT4バージョン:https:// www.mql5.com/en/market/product/58375 Trade Managerダッシュボードは、外国為替市場での現在の各ポジションが一目でわかるように設計されており、リスク管理と通貨へのエクスポージャーを理解しやすくします。 複数のポジションで徐々に市場に参入するトレーダー、またはそれらのトレーディンググリッドとバスケット戦略にとって、これは重要な情報です。ターミナル内の複数の位置を監視することは、管理が難しいことがよくあります。 不十分なリスクの活用と使用:報酬は、新しいトレーダーや一部の経験豊富なトレーダーが直面する主要な問題です。トレードマネージャーは、各通貨へのエクスポージャーを個別に示し、一度に両方向に取引しないようにします。 特徴: オープントレード-通貨ペアでソートされた現在のオープントレードをすべて表示します。ペアだけでなく
MT5 to Discord Signal Provider は、Discord へ直接トレーディングシグナルを送信するために設計された、使いやすく完全にカスタマイズ可能なユーティリティです。このツールは、あなたのトレーディングアカウントを効率的なシグナルプロバイダーに変えます。 スタイルに合わせてメッセージフォーマットをカスタマイズ!利便性を考え、事前にデザインされたテンプレートから選択し、メッセージのどの要素を含めるか除外するかを選択できます。 [ デモ ] [ マニュアル ] [ MT4 バージョン ] [ Telegram バージョン ] セットアップ 簡単なセットアップのために、私たちの詳細な ユーザーガイド に従ってください。 Discord API の事前知識は必要ありません。必要なツールはすべて提供されます。 主な特徴 購読者の更新のための注文詳細をカスタマイズ。 ブロンズ、シルバー、ゴールドなど、各レベルで異なるシグナルアクセスを提供する階層的サブスクリプションモデルを実装。 注文が実行されたチャートのスクリーンショットを添付。 これらのスクリーンショットに表
作者のその他のプロダクト
The script creates account summary report in a separate window. The report can be created for all deals and for deals on selected financial instruments. It is possible to specify a time interval of calculation and save report to an htm file. Script inputs report starting date - initial report generation date. symbols selection for report - select a method of choosing tools for a report generation. allSymbol - report is generated for deals performed on all symbols. onlyCurrentSymbol - report
Ticks
Andrej Nikitin
4 (6)
A simple tick indicator of Bid and Ask prices. The period separator (1 minute) is displayed as a histogram. Parameters Show Bid Line - show/hide the Bid line; Show Ask Line - show/hide the Ask line; Show Labels - show/hide the last price values.
FREE
This utility is used to visually choose an indicator for trailing stop and select its parameters. The Expert Advisor modifies the Stop Loss order position opened for the instrument of the current chart based on indicator values. Uses indicators Parabolic SAR , NRTR (Nick Rypock Trailing Reverse) , Moving Average or linear regression channel. The indicators are added to or removed from the chart using the 'show' checkbox. The following options are available: Parabolic - trailing stop based on t
Ticks Bars
Andrej Nikitin
4 (6)
This tick indicator draws synthetic bars/candlesticks that contain a definite number of ticks. Parameters: option prices - price option. It can be Bid, Ask or (Ask+Bid)/2. the number of ticks to identify Bar - number of ticks that form OHLC. price levels count - number of displayed price levels (no levels are displayed if set to 0 or a lower value). calculated bar  - number of bars on the chart. Buffer indexes: 0 - OPEN, 1 - HIGH, 2 - LOW, 3 - CLOSE.
FREE
Tick
Andrej Nikitin
4.33 (3)
A simple tick indicator of Bid and Ask prices. The period separator (1 minute) is displayed as a histogram. Parameters Price_levels_count - number of price levels to be displayed. Bar_under_calculation - number of bars of the indicator to be displayed on the chart.
FREE
The script creates account summary report in a separate window. The report can be created for all deals and on deals for selected financial instruments. It is possible to specify a time interval of calculation and save report to htm-file. The script creates account summary report in a separate window. The report can be created for all deals and for deals of the selected financial instruments. It is possible to specify a time interval of calculation and save report to htm-file. Input paramet
The indicator draws two simple moving averages using High and Low prices. The MA_High line is displayed when the moving average is directed downwards. It can be used for setting a stop order for a sell position. The MA_Low line is displayed when the moving average is directed upwards. It can be used for setting a stop order for a buy position. The indicator is used in the TrailingStop Expert Advisor. Parameters Period - period of calculation of the moving average. Deviation - rate of convergence
FREE
The Relative Strength Index indicator drawn using a tick chart. After launching it, wait for enough ticks to come. Parameters: RSI Period - period of averaging. overbuying level - overbought level. overselling level - oversold level. calculated bar - number of bars on the chart for the indicator calculation. The following parameters are intended for adjusting the weight of RSI signals (from 0 to 100). You can find their description in the Signals of the Oscillator Relative Strength Index section
The Envelopes indicator drawn using a tick chart. After launching it, wait for enough ticks to come. Parameters: Averaging period - period of averaging. Smoothing type - type of smoothing. Can have any values of the enumeration ENUM_MA_METHOD . Option prices - price to be used. Can be Ask, Bid or (Ask+Bid)/2. Deviation of boundaries from the midline (in percents) - deviation from the main line in percentage terms. Price levels count - number of displayed price levels (no levels are displayed if
The Stochastic Oscillator indicator is drawn on the tick price chart. After launching it, wait for enough ticks to come. Parameters: K period - number of single periods used for calculation of the stochastic oscillator; D period - number of single periods used for calculation of the %K Moving Average line; Slowing - period of slowing %K; Calculated bar - number of bars in the chart for calculation of the indicator. The following parameters are intended for adjusting the weight of signals of the
The Moving Average Convergence/Divergence(MACD) indicator drawn using a tick chart. After launching it, wait for enough ticks to come. Parameters: Fast EMA period - indicator drawn using a tick chart. Slow EMA period - slow period of averaging. Signal SMA period - period of averaging of the signal line. calculated bar - number of bars on the chart for the indicator calculation. The following parameters are intended for adjusting the weight of MACD signals (from 0 to 100). You can find their desc
The Bollinger Bands indicator drawn using a tick chart. After launching it, wait for enough ticks to come. Parameters: Period - period of averaging. Deviation - deviation from the main line. Price levels count - number of displayed price levels (no levels are displayed if set to 0). Bar under calculation - number of bars on the chart for the indicator calculation. Buffer indexes: 0 - BASE_LINE, 1 - UPPER_BAND, 2 - LOWER_BAND, 3 - BID, 4 - ASK.
The Moving Average of Oscillator(OsMA) indicator drawn using a tick chart. After launching it, wait for enough ticks to come. Parameters: Fast EMA period - fast period of averaging. Slow EMA period - slow period of averaging. Signal SMA period - period of averaging of the signal line. calculated bar - number of bars for the indicator calculation.
The Commodity Channel Index(CCI) indicator drawn using a tick chart. After launching it, wait for enough ticks to come. Parameters: period - number of single periods used for the indicator calculation. calculated bar - number of bars for the indicator calculation. The following parameters are intended for adjusting the weight of CCI signals (from 0 to 100). You can find their description in the Signals of the Commodity Channel Index section of MQL5 Reference. The oscillator has required directio
The Average Directional Movement Index indicator drawn using a tick chart. After launching it, wait for enough ticks to come. Parameters: Period - period of averaging. Сalculated bar - number of bars on the chart for the indicator calculation. Buffer indexes: 0 - MAIN_LINE, 1 - PLUSDI_LINE, 2 - MINUSDI_LINE.
The Standard Deviation (StdDev) indicator drawn using a tick chart. After launching it, wait for enough ticks to come. Parameters: Period - period of averaging. Method - method of averaging. calculated bar - number of bars for the indicator calculation.
The Momentum indicator drawn using a tick chart. After launching it, wait for enough ticks to come. Parameters: period - period of the indicator calculation. levels count - number of displayed levels (no levels are displayed if set to 0) calculated bar - number of bars for the indicator calculation.
The Bulls Power indicator drawn using a tick chart. After launching it, wait for enough ticks to come. Parameters: Period - period of averaging. The number of ticks to identify high/low - number of single ticks for determining high/low. Calculated bar - number of bars for the indicator calculation. The following parameters are intended for adjusting the weight of Bulls Power signals (from 0 to 100). You can find their description in the Signals of the Bulls Power oscillator section of MQL5 Refer
The  Bears Power indicator drawn using a tick chart. After launching it, wait for enough ticks to come. Parameters: Period - period of averaging. The number of ticks to identify high/low - number of single ticks for determining high/low. Calculated bar - number of bars for the indicator calculation. The following parameters are intended for adjusting the weight of Bears Power signals (from 0 to 100). You can find their description in the Signals of the Bears Power oscillator section of MQL5 Refe
The  Average True Range (ATR)  indicator drawn using a tick chart. After launching it, wait for enough ticks to come. Parameters: ATR Period  - number of single periods used for the indicator calculation. The number of ticks to identify Bar  - number of single ticks that form OHLC. Price levels count  - number of displayed price levels (no levels are displayed if set to 0 or a lower value). price mode  - choice of prices under calculation (can be bid, ask or average). Сalculated bar  - number of
The  Williams' Percent Range (%R)  indicator drawn using a tick chart. After launching it, wait for enough ticks to come. Parameters: WPR Period  - period of the indicator. Overbuying level  - overbought level. Overselling level  - oversold level. price mode  - choice of prices under calculation (can be bid, ask or average). Сalculated bar  - number of bars for the indicator calculation. The following parameters are intended for adjusting the weight of WPR signals (from 0 to 100). You can find t
The  Price Channel  indicator drawn using a tick chart. After launching it, wait for enough ticks to come. Parameters: Period  - period for determining the channel boundaries. Price levels count  - number of displayed price levels (no levels are displayed if set to 0). price mode  - choice of prices under calculation (can be bid, ask or average). Bar under calculation  - number of bars on the chart for the indicator calculation. Buffer indexes: 0 - Channel upper, 1 - Channel lower, 2 - Channel m
Description: Abigail is a medium-term trading system making profit during the price rollback. The Expert Advisor has been optimized for working on EURUSD. However, it can successfully work with other currency pairs as well. You can examine the Expert Advisor's trading statistics for different brokers and symbols at MetaTrader 4 and MetaTrader 5 Trading Signals sections. Parameters: Risk management: enter volume - market entry volume. If the value is greater than 0 - number of lots, if less than
TimeFilter indicator allows you to visually select bit masks (GoodHourOfDay, BadHoursOfDay, GoodDayOfWeek, BadDaysOfWeek) for the  Intraday Time Filter  module of trading signals of the Standard Library. The use of time filters allows you to take into account the particulars of each trading session in performing trading operations.
The indicator is an inter-week hourly filter. When executing trading operations, the indicator allows considering time features of each trading session. Permissive and restrictive filter intervals are set in string form. The used format is [first day]-[last day]:[first hour]-[last hour]. See the screenshots for examples. Parameters: Good Time for trade - intervals when trading is allowed. Bad Time for trade - intervals when trading is forbidden. time filter shift (hours) - hourly shift. percent
TrailingStop 4
Andrej Nikitin
4.83 (6)
The Expert Advisor modifies the Stop Loss order position opened for the instrument of the current chart based on indicator values. Uses indicators Parabolic SAR ,  NRTR (Nick Rypock Trailing Reverse) ,  Moving Average  or linear regression channel. Switchable modes: Trailing stop only when in profit; Trailing stop only following the price; On every teak or on formed bars; Trailing for each order separately or for a total position. Has an option of "hidden stop", also you can exclude individual
The EA performs trade operations of closing position groups. Positions are grouped by type. It is possible to select orders by the profit (loss) value. It is possible to form the closure groups manually. You can set a value for automatic closure of a positions group after reaching a certain profit/loss level or price level. The additional functions of the EA are called using the hot keys: SHIFT+A - show/hide Auto exit options. SHIFT+S - show/hide Settings panel. SHIFT+V - sound ON/OFF. SHIFT+I -
The Expert Advisor for increasing (or opening) market positions. Allows specifying the desired risk, target and searching for the best open price and trade volume. Configurable Parameters: lots - directly the volume of the position increase. % equity - the amount of growth as a percentage of the amount of funds. stop loss - directly the level of the stop loss order. loss - the level of the stop loss order depending on the allowable loss. take profit - directly the take profit level of
The Expert Advisor notifies that a price has crossed a line on the chart. It handles two types of lines - horizontal line and a trendline. The number of lines is unlimited. Parameters: prefix of signal line - prefix of object (line) names processed by the indicator. If the parameter is empty, it handles all object types: horizontal lines and trendlines. price Mode - price type (bid or ask). timeout - crossing alert timeout. number of repeats - the limit of crossing alert repeats. number of comme
フィルタ:
Aleks S
683
Aleks S 2020.05.10 21:57 
 

Very Useful tool for anticipating the margin levels.. but not working on all brokers from my experience

レビューに返信
バージョン 1.22 2020.06.09
Update
バージョン 1.21 2020.06.03
Update
バージョン 1.20 2020.06.03
Update
バージョン 1.1 2013.10.07
добавлен функционал