PZ Wolfe Waves
- インディケータ
- PZ TRADING SLU
- バージョン: 6.0
- アップデート済み: 9 5月 2019
- アクティベーション: 20
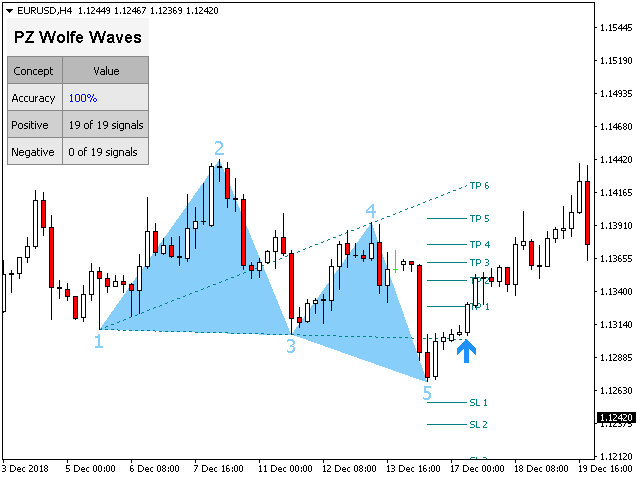
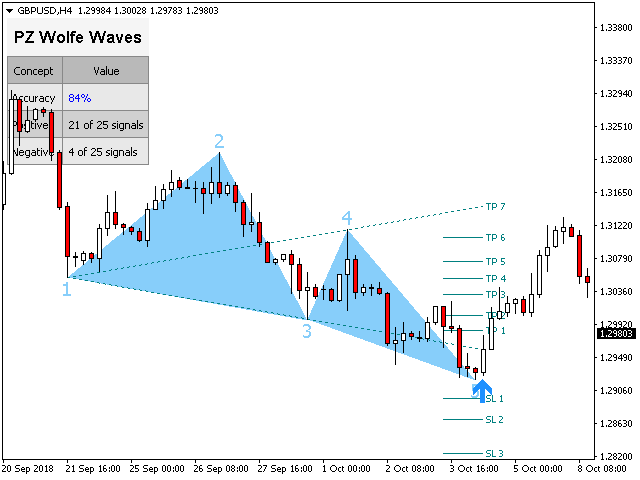
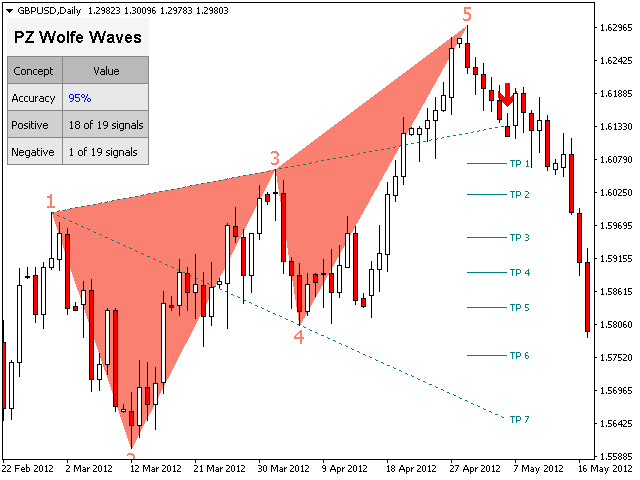
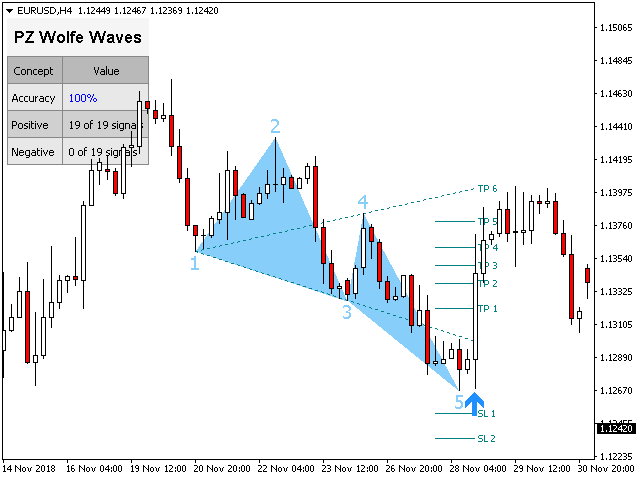
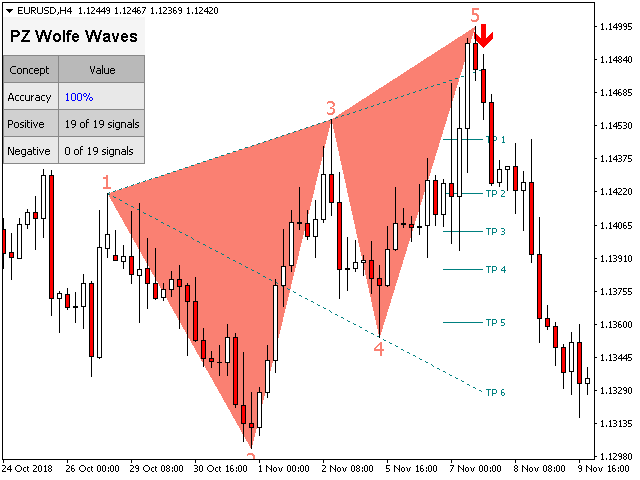
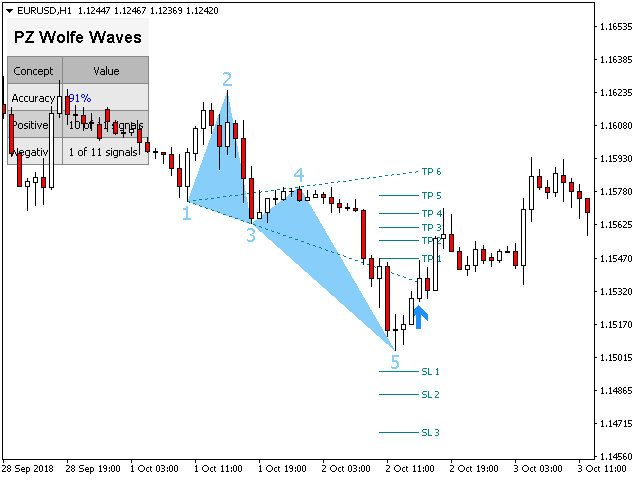
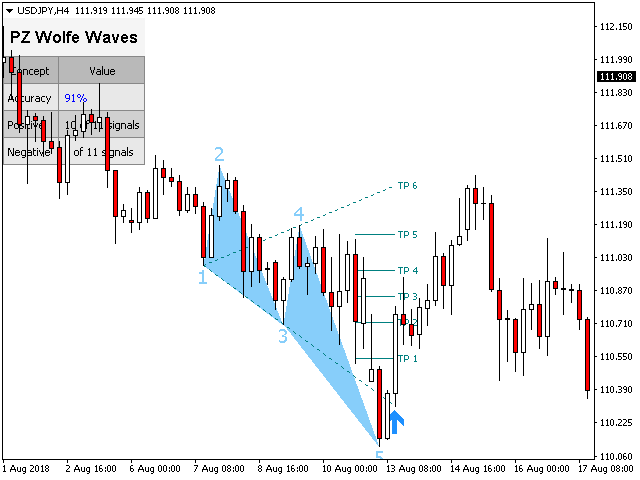
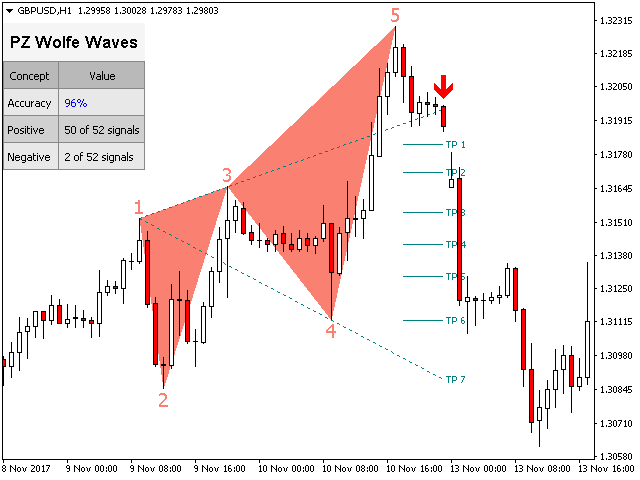
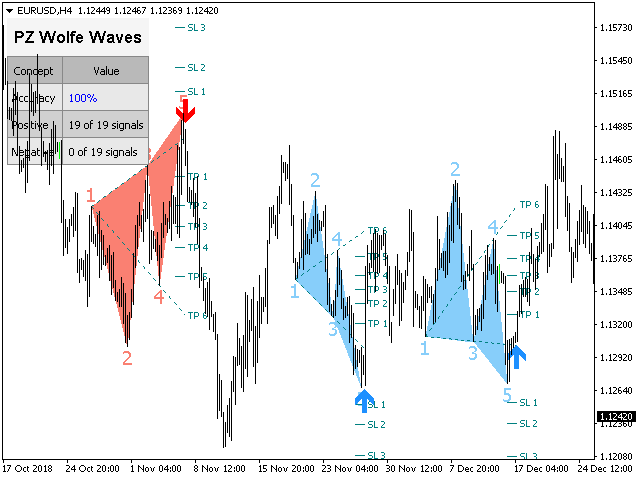
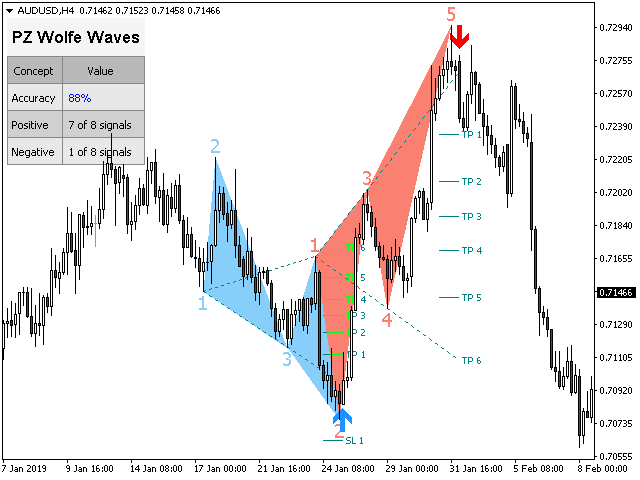
Wolfe Wavesは、すべての金融市場に存在する自然に発生する取引パターンであり、均衡価格への戦いを表しています。これらのパターンは、短期および長期の時間枠で発生する可能性があり、現在の最も信頼性の高い予測反転パターンの1つであり、通常は強い長期の価格変動に先行します。
[ インストールガイド | 更新ガイド | トラブルシューティング | よくある質問 | すべての製品 ]
- クリアな取引シグナル
- 驚くほど簡単に取引できます
- カスタマイズ可能な色とサイズ
- パフォーマンス統計を実装します
- 適切なストップロスおよび利益レベルを表示します
- 電子メール/音声/視覚アラートを実装します
インジケーターはパターンとブレイクアウト矢印を同時に描画し、インジケーターが展開するときにパターンが再描画されないようにします。ただし、エントリのブレイクアウトが何度も発生し、インジケータが再描画される場合、あまり頻繁にではなく控えめに再描画される可能性があります。インジケータは非バックペインティングです。
オオカミの定義
ウルフ波には、次の特性が必要です。 ( 例を見るにはここをクリック )- ウェーブ3〜4は、1-2で作成されたチャネル内に留まる必要があります。
- 波4は波1-2によって作成されたチャネル内にあります
- ウェーブ5は、ウェーブ1および3によって作成されたトレンドラインを超えています
入力パラメータ
- 振幅-振幅は、代替価格ポイント間のバーの最小量を表します。大きなパターンを見つけるには、振幅パラメーターを大きくします。小さなパターンを見つけるには、振幅パラメーターを小さくします。インジケーターをチャートに何度もロードして、異なるサイズの重複パターンを見つけることができます。
- ブレイクアウト期間-ウルフ波ブレイクアウトを確認するためのドンチャンブレイクアウト期間。ゼロは使用されないことを意味します。
- 最大履歴バー-インジケーターがチャートに読み込まれたときに評価する過去のバーの量。
- 統計の表示-統計ダッシュボードとパフォーマンスデータを表示または非表示にします。
- SL / TPレベルの表示-各信号に適したSLおよびTPレベルを表示または非表示にします。
- 価格ラベルの表示-パターン価格ラベルを表示または非表示にします。
- 描画オプション-強気または弱気の線とラベルの色とサイズ、およびフォントサイズ。
- ブレイクアウト-ブレイクアウト矢印の色とサイズ。
- アラート-アラートを自由に有効または無効にします。
著者
ArturoLópezPérez、個人投資家および投機家、ソフトウェアエンジニア、Point Zero Trading Solutionsの創設者。

Well, for the moment doens't work as it should