Elder SafeZone Long Entries
- インディケータ
- Financial Trading Seminars Inc.
- バージョン: 2.0
- アップデート済み: 17 11月 2021
- アクティベーション: 5
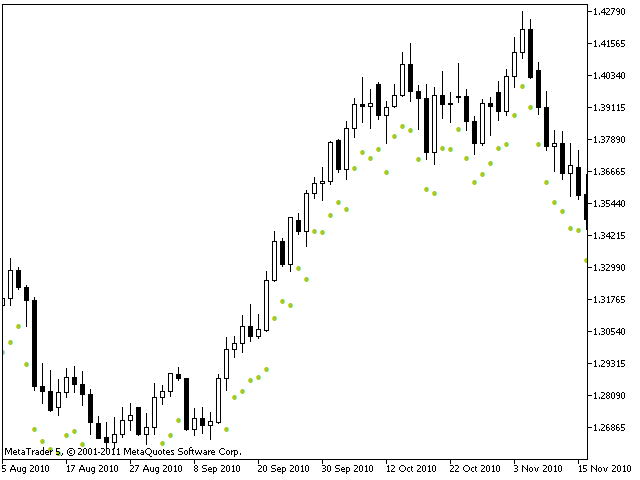
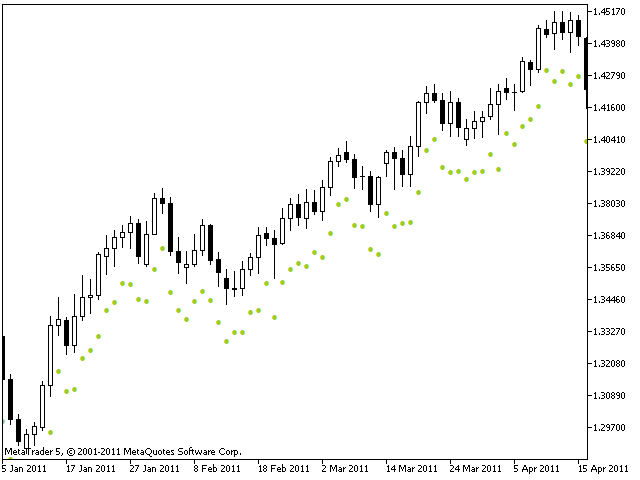
One of the key rules in trading is never move your stops in such a way that your risk increases. Our stop sequence shows the automatic tightening of stops. They appear as a series of decreasing risk points until the trade is eventually stopped out.
The problem is that if you enter a trade at any other point than the initial dot of the sequence, you may be placing the stop too close. Stop-entry plots show you the initial value for the stop for each bar. You can use them when you put on a trade, and increase the value each day until you eventually hit a stop.
Remember that you may never change a stop so that it would increase your risk.
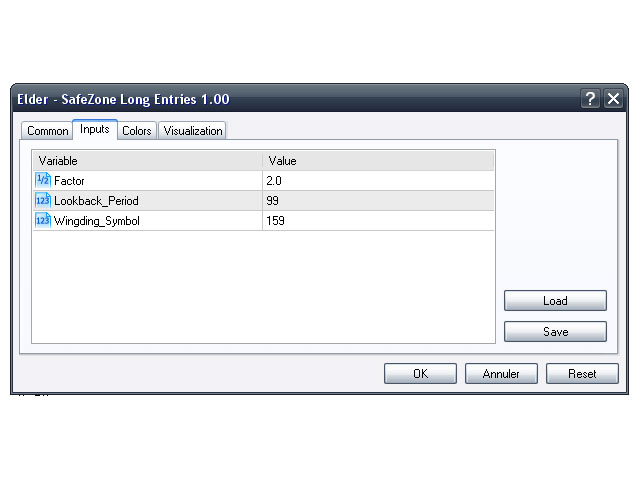
Parameters
- Factor (3) – This is the factor for multiplying the average market noise. You may use fractions – this does not need to be an integer.
- ATR_Days (22) – Number of days for computing the average market noise.
- Wingding_Symbol (159) – Symbol to be displayed.