SX Impulse MACD MT5
- インディケータ
- Mojtaba Sarikhani
- バージョン: 1.0
- アクティベーション: 7
MACD is probably one of the most popular technical indicators out there. When the market is trending, it actually does a pretty good job, but when the market starts consolidating and moving sideways, the MACD performs not so well.
SX Impulse MACD for MT4 is available here.
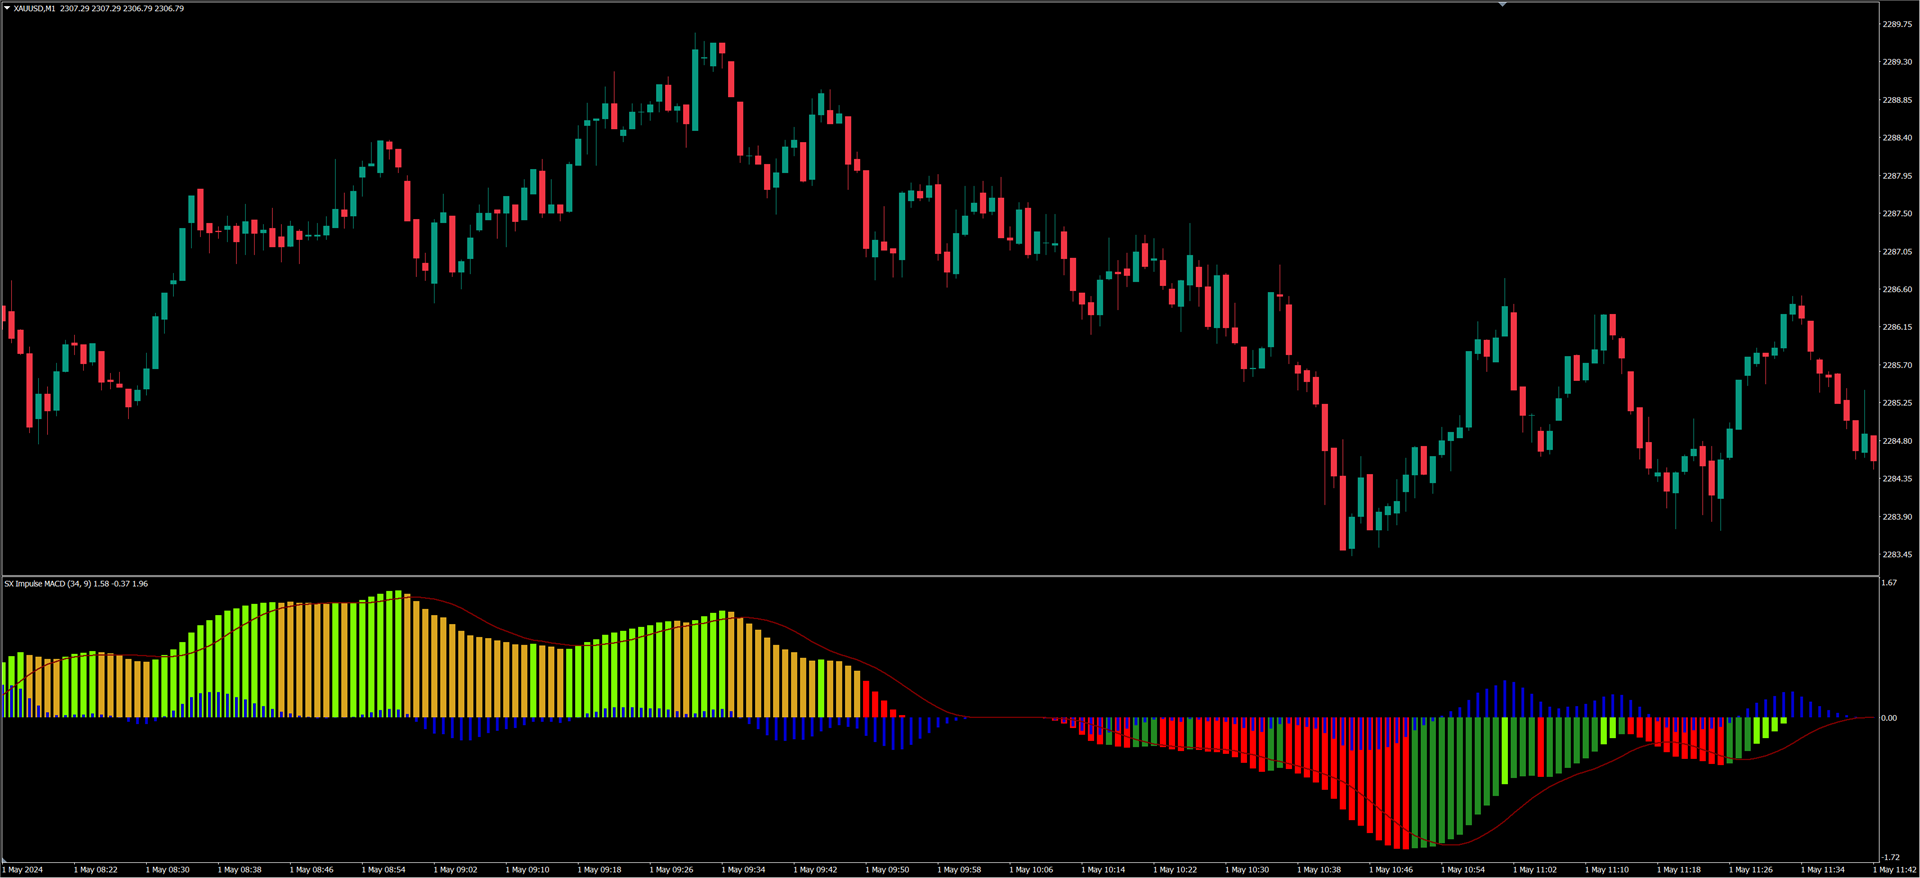
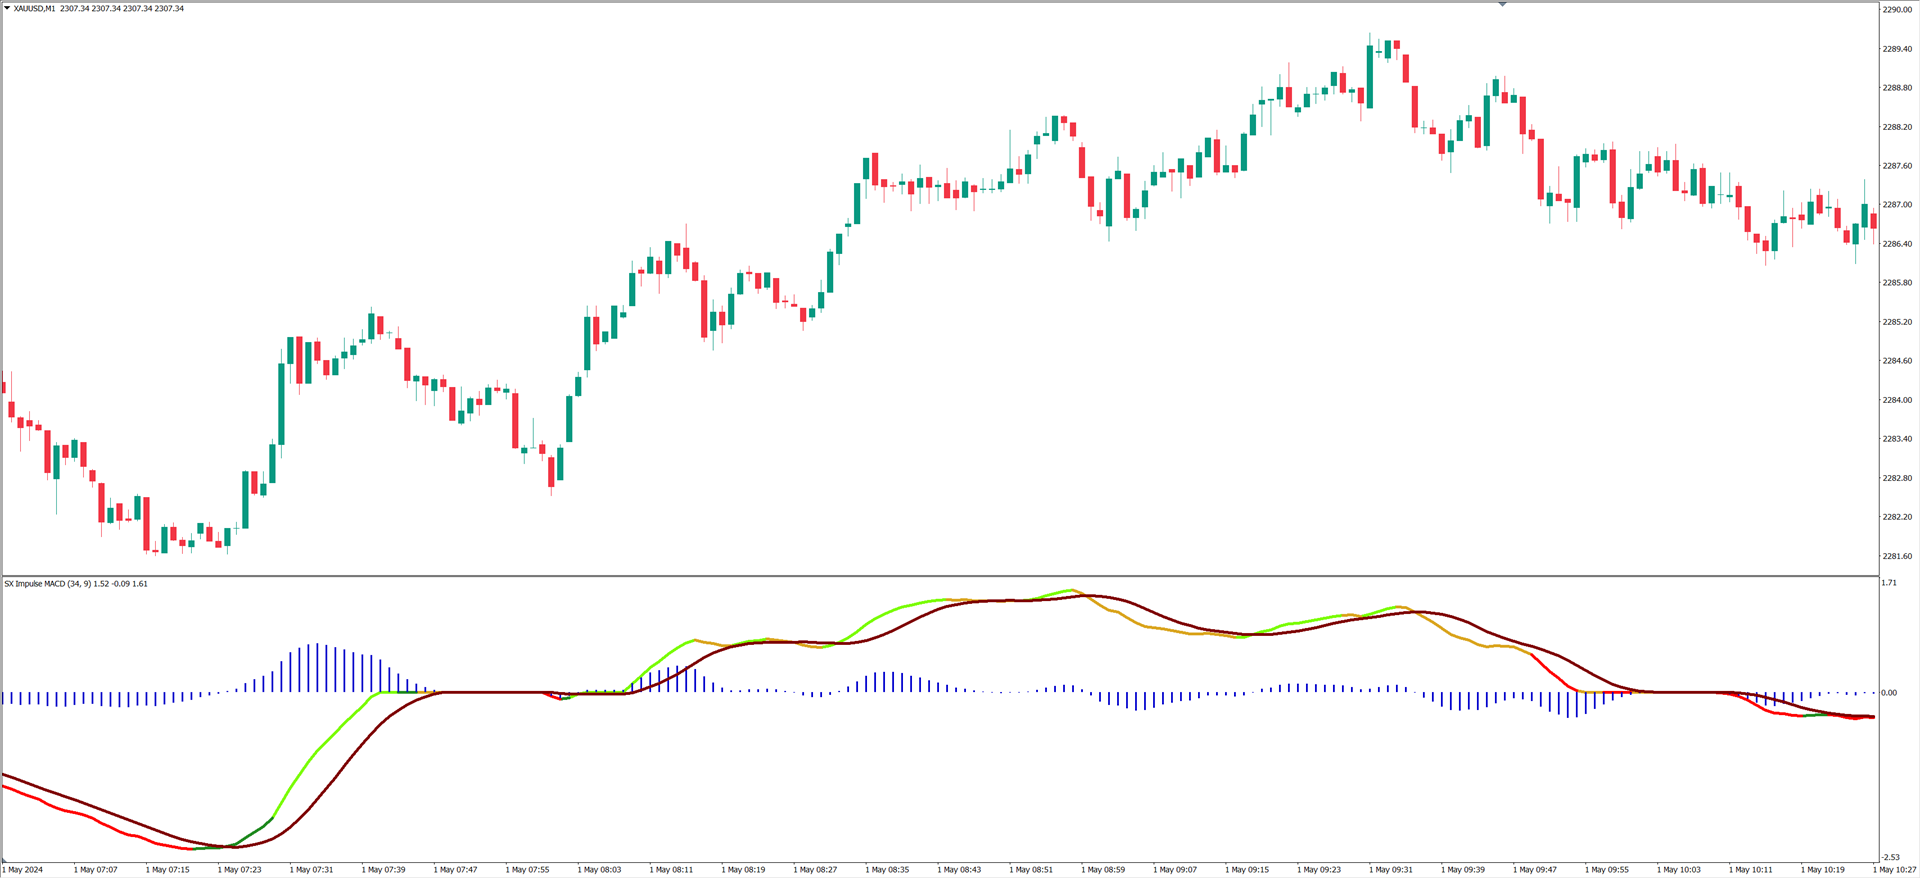
Impulse MACD is a modified version of MACD that works very well for trading Forex, stocks, and cryptocurrencies. It has its own unique feature which perfectly filters out the values in a moving average range and enables it to eliminate those false signals when the market is ranging, therefore minimizing your loss. When the price starts moving sideways, the Histogram of the indicator and its Signal line become flat. This way you have full confidence that you should not be opening any trades during this time.
How to use Impulse MACD:
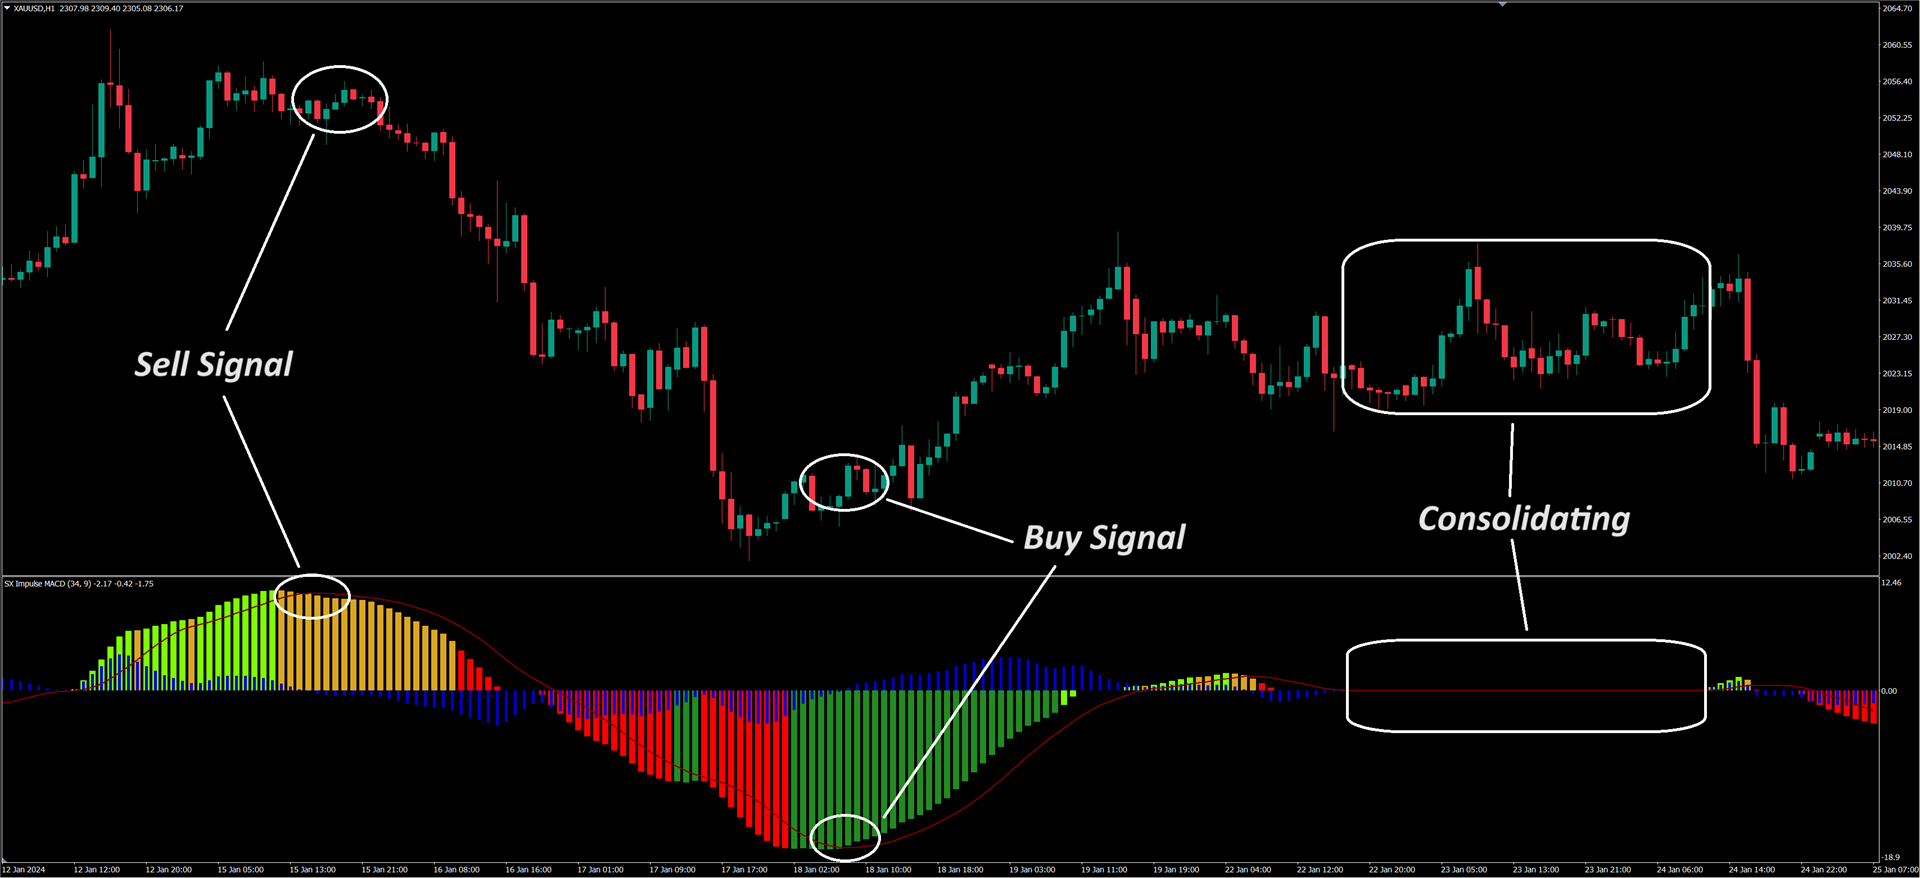
Similar to the classic MACD, by looking at the crossovers between the Impulse MACD Histogram (which can be changed to a line) and the Signal line, you can identify trends. The difference is that it won't give you signals at all when the market is consolidated. It will only give you signals when the market is trending, making it perform way better than the classic MACD indicator. The trading strategy is simple: when the Histogram crosses above the Signal line, that indicates there is bullish momentum and you should buy. When the Histogram crosses below the Signal line, this signals there is bearish momentum and you should sell. When the Histogram and Signal line go flat, that indicates the market is consolidating and you should not be taking any trades.
#Tags: Impulse MACD, MACD, Moving Average Convergence Divergence, Buy Signal, Sell Signal, Signal Line, Momentum Indicator, Momentum, Range Trading, Up trending, Down trending, Bullish Momentum, Bearish Momentum
DISCLAIMER: Please notice that we do not provide any financial advice. We only provide tools for anyone interested in improving their trading.