• 概要
  • レビュー
  • コメント

AI Non Repaint Entry Pro

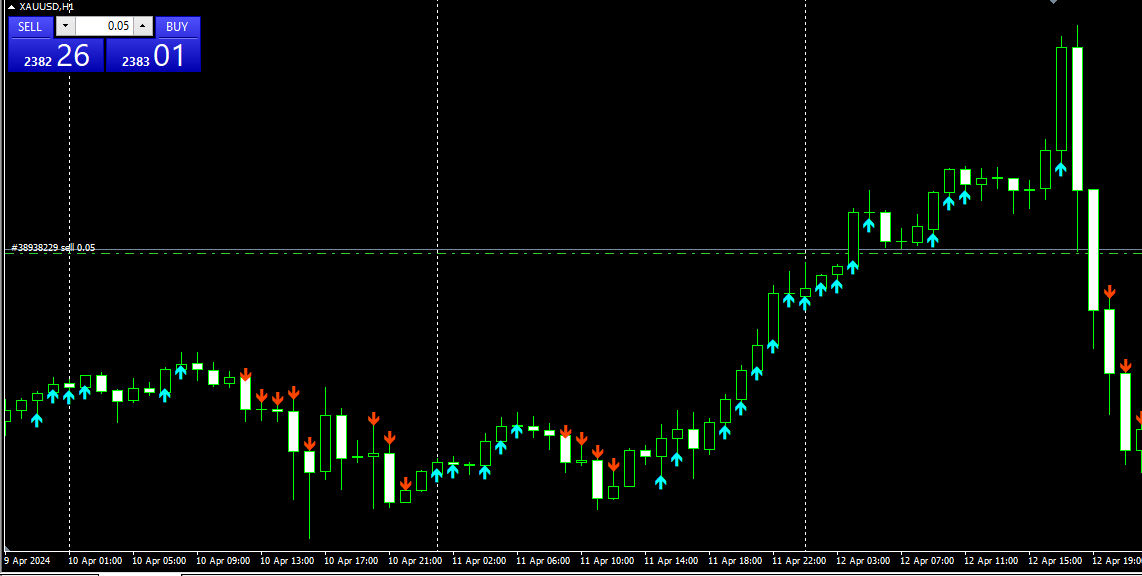
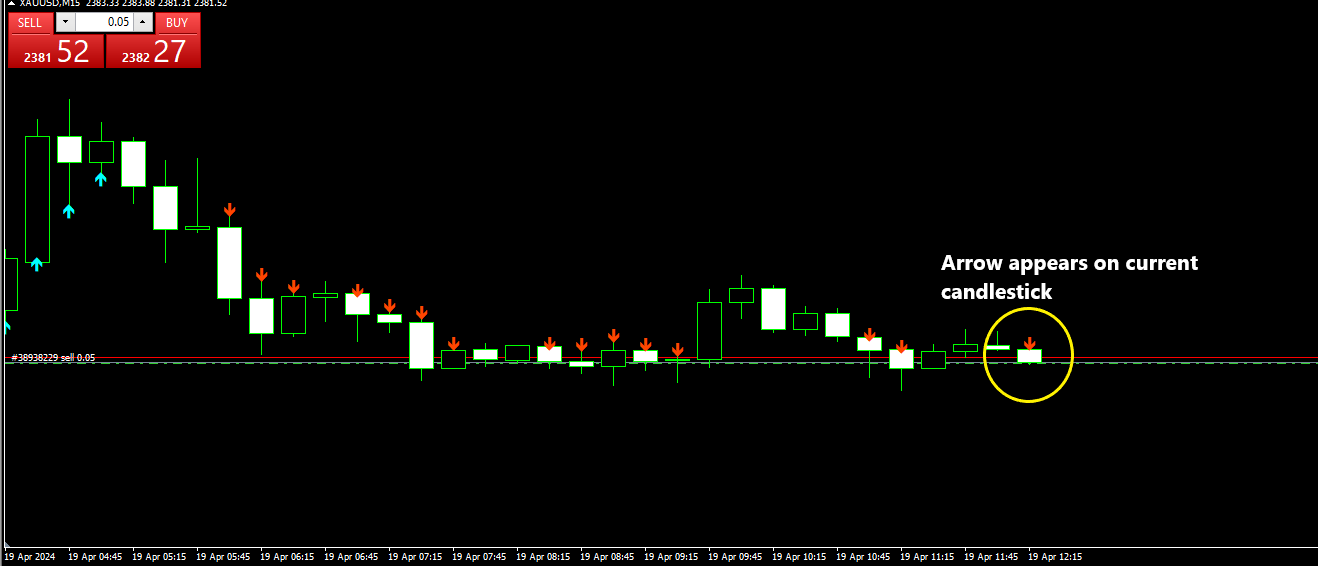
Advanced artificial intelligence indicator that is 100% non-repaint and appears on current candlestick.

The indicator is based on arrows which serve as your entry points.

Buy arrow is your buy signal and orange arrow are your sell signal as more arrows appear the stronger the trend and you can add more entries.

The indicator works on all timeframe from the one-minute timeframe to the monthly timeframe.

The AI Non-repaint indicator works on all forex pairs.


おすすめのプロダクト
The perfect tool for Scalng in the Forex markets You can trade both from signal to signal and using take profit  The algorithm does not use Zigzag!  No redrawing!  This is a channel instrument that uses a moving average as a filter. Moving Average  There are 2 parameters for the settings Ma Period = 5 period Moving Average  Channel 1.0 distance of channel lines from the chart Price Signal Filter - calculation of signal opening and filter There is a complete set of Alert There is a multi-timefram
VR Cub
Vladimir Pastushak
VR Cub は、質の高いエントリーポイントを獲得するためのインジケーターです。このインジケーターは、数学的計算を容易にし、ポジションへのエントリーポイントの検索を簡素化するために開発されました。このインジケーターが作成されたトレーディング戦略は、長年にわたってその有効性が証明されてきました。取引戦略のシンプルさはその大きな利点であり、初心者のトレーダーでもうまく取引することができます。 VR Cub はポジション開始ポイントとテイクプロフィットとストップロスのターゲットレベルを計算し、効率と使いやすさを大幅に向上させます。取引の簡単なルールを理解するには、以下の戦略を使用した取引のスクリーンショットを見てください。 設定、設定ファイル、デモ版、説明書、問題解決方法は、以下から入手できます。 [ブログ] レビューを読んだり書いたりすることができます。 [リンク] のバージョン [MetaTrader 5] エントリーポイントの計算ルール ポジションをオープンする エントリーポイントを計算するには、VR Cub ツールを最後の高値から最後の安値までストレッチする必要があります。
This is a trend indicator without redrawing Developed instead of the binary options strategy (by the color of the Martingale candlestick) Also works well in forex trading When to open trades (binary options) A signal will appear in the place with a candle signaling the current candle It is recommended to open a deal for one candle of the current timeframe M1 and M5 When a blue dot appears, open a deal up When a red dot appears, open a trade down. How to open trades on Forex. When a signal is rec
これは、キャンドルの終値を予測する指標です。 このインジケータは、主にD1チャートでの使用を目的としていますが. この指標は、従来の外国為替取引とバイナリオプション取引の両方に適しています。 インジケーターは、スタンドアロンのトレーディングシステムとして使用することも、既存のトレーディングシステムへの追加として機能させることもできます。 このインジケーターは、現在のキャンドルを分析し、キャンドル自体の内部の特定の強度係数と、前のキャンドルのパラメーターを計算します。 したがって、この指標は、市場の動きのさらなる方向性と現在のキャンドルの終値を予測します。 この方法のおかげで、この指標は、短期の日中取引だけでなく、中期および長期の取引にも適しています。 インジケーターを使用すると、市場の状況の分析中にインジケーターが生成する潜在的な信号の数を設定できます。 インジケーターの設定には、このための特別なパラメーターがあります。 また、インジケーターは、チャート上のメッセージの形式で、電子メールで、およびPUSH通知の形式で、新しい信号について通知することができます。 購入後は必ず私に書いて
This is the FXTraderariel-TakeProfit - Stop Loss Indicator . It provides you 3 potential Take Profits and 1 Stop Loss. These potential targets are computed based on several methods . The indicator can be used on every time frame, but we advise to use it on H1, H4 and D1. Especially if you are a novice trader. Pro Traders can also you use it for scalping in smaller time frames (M1, M5 and M15). This indicator is not a complete trading system. It doesn't provide you a Signal nor can predict the m
まず第一に、この取引インジケーターは再描画されず、再描画されず、遅延しないことを強調する価値があります。これにより、手動取引とロボット取引の両方に理想的なものになります。 ユーザーマニュアル:設定、入力、戦略。 アトミックアナリストは、価格の強さとモメンタムを利用して市場でより良いエッジを見つけるためのPA価格アクションインジケーターです。ノイズや誤ったシグナルを除去し、取引ポテンシャルを高めるための高度なフィルターを備えています。複雑なインジケーターの複数のレイヤーを使用して、アトミックアナリストはチャートをスキャンし、複雑な数学的計算をシンプルなシグナルと色に変換します。これにより、どのような初心者トレーダーでも理解して使用し、一貫した取引の決定を行うことができます。 「アトミックアナリスト」は、新規および経験豊富なトレーダー向けにカスタマイズされた包括的な取引ソリューションです。プレミアムインジケーターとトップノッチの機能を1つの取引戦略に組み合わせ、すべてのタイプのトレーダーにとって汎用性のある選択肢にします。 デイリートレーディングとスキャルピング戦略:高
Was: $249  Now: $99   Market Profile defines a number of day types that can help the trader to determine market behaviour. A key feature is the Value Area, representing the range of price action where 70% of trading took place. Understanding the Value Area can give traders valuable insight into market direction and establish the higher odds trade. It is an excellent addition to any system you may be using. Blahtech Limited presents their Market Profile indicator for the MetaTrader community. Ins
This unique multi-currency strategy simultaneously determines the strength of trends and market entry points, visualizing this using histograms on the chart. The indicator is optimally adapted for trading on the timeframes М5, М15, М30, Н1. For the convenience of users, the indicator renders the entry point (in the form of an arrow), recommended take profit levels (TP1, TP2 with text labels) and the recommended Stop Loss level. The take profit levels (TP1, TP2) are automatically calculated for
Noize Absorption Index - is the manual trading system that measures the difference of pressure between bears forces and bulls forces. Green line - is a noize free index that showing curent situation. Zero value of index shows totally choppy/flat market.Values above zero level shows how powerfull bullish wave is and values below zero measures bearish forces.Up arrow appears on bearish market when it's ready to reverse, dn arrow appears on weak bullish market, as a result of reverse expectation. S
フィボナッチリトレースと拡張ラインツール DiNapoliポイント取引方法とゴールデンセクション取引を使用するトレーダーにとって理想的なMT4プラットフォームのフィボナッチリトレースと拡張ラインツール 主な特長: あなたはフィボナッチリトレースメントの複数のセットを直接描くことができ、重要なリターンポイント間の関係は一目瞭然です。 2.フィボナッチ拡張を描画することができます。 3.フィボナッチフォールドバックとラインの延長は、簡単な観察と数値表示のために左右に動かすことができます。 4.チャートは非常に爽やかな 5.数字キーでサイクルを切り替えることができます。 ファンクションキー: 1。 [戻るを押す、要求に応じて描画する、最大8つのグループにする 2。拡張]を描くには[押す] 3。 \を押すと、現在のサイクルの下にあるすべての拡張機能と折り畳みが削除されます 4。フォールドバックを移動して削除して展開する (1)最初のフォールドバックセットのF5行をクリックします。 一度クリックすると(黄色に変わります)、キーボードのDel
We present you the indicator "Candle closing counter", which will become your indispensable assistant in the world of trading. That’s why knowing when the candle will close can help: If you like to trade using candle patterns, you will know when the candle will be closed. This indicator will allow you to check if a known pattern has formed and if there is a possibility of trading. The indicator will help you to prepare for market opening and market closure. You can set a timer to create a p
An indicator of pattern #31 ("Long Island") from Encyclopedia of Chart Patterns by Thomas N. Bulkowski. The second gap is in the opposite direction. Parameters: Alerts - show alert when an arrow appears   Push - send a push notification when an arrow appears (requires configuration in the terminal) GapSize - minimum gap size in points ArrowType - a symbol from 1 to 17 ArrowVShift - vertical shift of arrows in points   ShowLevels - show levels ColUp - color of an upward line ColDn - color of
Trade with Gann on your side!! MASTER CIRCLE 360 CIRCLE CHART, originally created by Gann admitted that this is “The Mother of all charts”. It is one of the last studies that this great trader left for us. The numeric tab le is apparently quite simple like all the tables and is based on square numbers, the SQUARE OF 12 and is by evolution, one of the most important square numbers. Here we can find CYCLE, PRICE AND TIME thanks to angles and grades, to show past and future support and resistance.
TWO PAIRS SQUARE HEDGE METER INDICATOR Try this brilliant 2 pairs square indicator It draws a square wave of the relation between your two inputs symbols when square wave indicates -1 then it is very great opportunity to SELL pair1 and BUY Pair2 when square wave indicates +1 then it is very great opportunity to BUY pair1 and SELL Pair2 the inputs are : 2 pairs of symbols         then index value : i use 20 for M30 charts ( you can try other values : 40/50 for M15 , : 30 for M30 , : 10 for H1 ,
The Th3Eng PipFinite indicator is based on a very excellent analysis of the right trend direction with perfect custom algorithms. It show the true direction and the best point to start trading. With StopLoss point and Three Take Profit points. Also it show the right pivot of the price and small points to order to replace the dynamic support and resistance channel, Which surrounds the price. And Finally it draws a very helpful Box on the left side on the chart includes (take profits and Stop loss
This indicator is a must have tool that scans the active chart for candlestick patterns. It labels each bar according the candlestick pattern(s) that it finds enabling you to more easily analyze price action and be more informed about your trading decision. There are 103 common and uncommon possible patterns plus 6 new patterns based on research that the indicator can identify. If a candlestick(s) meets the requirements for multiple patterns, the bar will be labeled with up to 4 patterns names f
Owl smart levels
Sergey Ermolov
4.63 (54)
MT5版  |   FAQ Owl Smart Levels Indicator   は、 Bill Williams   の高度なフラクタル、市場の正しい波構造を構築する Valable ZigZag、エントリの正確なレベルをマークする Fibonacci レベルなどの一般的な市場分析ツールを含む 1 つのインジケーター内の完全な取引システムです。 利益を得るために市場と場所に。 戦略の詳細な説明 インジケータを操作するための指示 顧問-取引助手 プライベートユーザーチャット ->購入後に私に書いて、私はプライベートチャットにあなたを追加し、あなたはそこにすべてのボーナスをダウンロードすることができます 力はシンプルさにあります! Owl Smart Levels   取引システムは非常に使いやすいので、専門家にも、市場を勉強し始めて自分で取引戦略を選択し始めたばかりの人にも適しています。 戦略と指標に秘密の数式や計算方法が隠されているわけではなく、すべての戦略指標は公開されています。 Owl Smart Levels を使用すると、取引を開始するためのシグナルをすばやく確認し、
MT4用FXインジケーター「モーニングスターパターン」 インジケーター「モーニング スター パターン」は、プライス アクション取引にとって非常に強力なインジケーターです。再描画や遅延はありません。 インジケーターがチャート上の強気モーニングスターパターンを検出: チャート上の青い矢印シグナル (写真を参照) PC、モバイル、電子メールのアラートが含まれています その兄弟である弱気の「イブニングスターパターン」インジケーターも利用できます(以下のリンクに従ってください) インジケーター「モーニングスターパターン」はサポート/レジスタンスレベルと組み合わせるのに最適です: https://www.mql5.com/en/market/product/100903 // さらに優れたエキスパートアドバイザーとインジケーターはここから入手できます: https://www.mql5.com/en/users/def1380/seller // また、収益性が高く、安定していて信頼できるシグナル https://www.mql5.com/en/signals/1887493 に参加する
For this set of indicators 1. General information     - Calculates with high performance mathematical algorithms.     - Calculated from the price of candles     - The entry point of this order is filtered by the train EMA and the oscillator.     - Calculate the integrity of the candle 2. How does it work?     - You can see two types of order entry points: the notification on the monitor and the arrow.     - You can trust 75-95 percent of this entry point. 3. Settings     - Retracement is re
All Symbols   AND  All Time frames Scan                                                                                                                 Document Introduction   The ABCD is a basic harmonic pattern. The ABCD pattern is a visual, geometric chart pattern comprised of three consecutive price swings. It looks like a diagonal lightning bolt and can indicate an upcoming trading opp
MT4用FXインジケーター「流れ星パターン」 インジケーター「シューティング スター パターン」は、プライス アクション取引にとって非常に強力なインジケーターです。再描画や遅延はありません。 インジケーターがチャート上で弱気の流れ星パターンを検出: チャート上の赤い矢印シグナル (写真を参照) PC、モバイル、電子メールのアラートが含まれています インジケーター「Shooting Star pattern」はサポート/レジスタンスレベルと組み合わせるのに最適です: https://www.mql5.com/en/market/product/100903 // さらに優れたエキスパートアドバイザーとインジケーターはここから入手できます: https://www.mql5.com/en/users/def1380/seller // また、収益性が高く、安定していて信頼できるシグナル https://www.mql5.com/en/signals/1887493 に参加することも歓迎します。 当MQL5サイトのみでご提供しているオリジナル商品です。
Super Gator
Agustinus Biotamalo Lumbantoruan
This indi shows the following 1. Supertrend 2. Alligator (Not a regular alligator) 3. ZigZag 4. Moving Average 5. Trend Continuation/Mini correction Signal (plotted in X) (See screenshots in green background color 6. Early Signal Detection (See screenshots in green background color) You may treat Alligator as the lagging indicator The leading indicator is the supertrend. The zig zag is based on the leading indicator where it gets plotted when the leading indicator got broken to the opposite.
Awesome Oscillator by Bill Williams with the ability to fine-tune and replace the averaging algorithms of the indicator, which significantly expands the possibilities of using this oscillator in algorithmic trading and brings it closer in its properties to such an indicator as the MACD. To reduce price noise, the final indicator is processed with an additional Smooth averaging. The indicator has the ability to give alerts, send mail messages and push signals when the direction of movement of th
の紹介     Quantum平均足PRO チャート 市場のトレンドに対する明確な洞察を提供するように設計された平均足キャンドルは、ノイズを除去し、誤ったシグナルを排除する能力で知られています。混乱を招く価格変動に別れを告げ、よりスムーズで信頼性の高いチャート表現を導入しましょう。 Quantum Heiken Ashi PRO を真にユニークなものにしているのは、従来のローソク足データを読みやすい色のバーに変換する革新的なフォーミュラです。赤と緑のバーはそれぞれ弱気トレンドと強気トレンドをエレガントに強調し、潜在的なエントリーポイントとエグジットポイントを驚くほど正確に見つけることができます。 量子EAチャネル:       ここをクリック MT5のバージョン:       ここをクリック この注目すべき指標には、いくつかの重要な利点があります。 明確性の向上: 価格変動を平滑化することで、平均足バーは市場トレンドをより明確に表現し、有利な取引機会を特定しやすくします。 ノイズの削減: 誤ったシグナルを引き起こすことが多い不安定な価格変動に別れを告げます。 Quan
The Point61 indicator is the result of many years of monitoring of price behavior of currency pairs and metals. It is not a secret, that in times of uncertainty, traders are looking for possible levels of support and resistance - the point, where price should stop its movement. There are 2 possible scenarios at these points: 1. Reverse (correction) to the opposite direction; 2. Breakthrough to continue movement. Very often these points are used to set stop orders - TakeProfit or
Insider Scalper Binary This tool is designed to trade binary options. for short temporary spends. to make a deal is worth the moment of receiving the signal and only 1 candle if it is m1 then only for a minute and so in accordance with the timeframe. for better results, you need to select well-volatile charts.... recommended currency pairs eur | usd, usd | jpy .... the indicator is already configured, you just have to add it to the chart and trade .... The indicator signals the next can
PZ 123 Pattern
PZ TRADING SLU
3.75 (4)
123パターン は、最も人気のある強力で柔軟なチャートパターンの1つです。このパターンは、3つの価格ポイントで構成されています。ボトム、ピークまたはバレー、および38.2%〜71.8%のフィボナッチリトレースメントです。パターンは、価格が最後のピークまたは谷、インディケーターが矢印をプロットし、アラートを上昇させ、取引を行うことができる瞬間を超えたときに有効と見なされます。 [ インストールガイド | 更新ガイド | トラブルシューティング | よくある質問 | すべての製品 ] クリアな取引シグナル カスタマイズ可能な色とサイズ パフォーマンス統計を実装します カスタマイズ可能なフィボナッチリトレースメントレベル 適切なストップロスおよび利益レベルを表示します インジケーターを使用して、継続パターンまたは反転パターンを見つけることができます 再描画および非再描画ではありません 電子メール/音声/視覚アラートを実装します 123パターン は、継続パターンまたは反転パターンとして現れます。物事を簡単にするために、このインジケーターを使用して、検索するパターンのタイプを選択でき
This indicator predicts rate changes based on the chart display principle. It uses the idea that the price fluctuations consist of "action" and "reaction" phases, and the "reaction" is comparable and similar to the "action", so mirroring can be used to predict it. The indicator has three parameters: predict - the number of bars for prediction (24 by default); depth - the number of past bars that will be used as mirror points; for all depth mirroring points an MA is calculated and drawn on the ch
インジケーターは、可能な限り最小のラグで 再描画せず にチャートに高調波パターンを表示します。インディケータトップの検索は、価格分析の波動原理に基づいています。 詳細設定では、取引スタイルのパラメータを選択できます。ろうそく(バー)のオープニングで、新しいパターンが形成されると、価格変動の可能性のある方向の矢印が固定され、変更されません。 インジケーターは、次のパターンとその種類を認識します:ABCD、Gartley(Butterfly、Crab、Bat)、3Drives、5-0、Batman、SHS、One2One、Camel、Triangles、WXY、Fibo、Vibrations。デフォルトでは、ABCDとGartleyの数字のみが設定に表示されます。多くの追加の構成可能なパラメーター。 主なパラメータ: ShowUpDnArrows-予想される方向矢印を表示/非表示 ArrowUpCode-上矢印コード ArrowDnCode-下矢印コード Show old history patterns-古いパターンの表示を有効/無効にします Enable alert messages,
このプロダクトを購入した人は以下も購入しています
Gann Made Easy は、ミスター・ギャンの理論を使用した取引の最良の原則に基づいた、プロフェッショナルで使いやすい外国為替取引システムです。 W・D・ガン。このインジケーターは、ストップロスとテイクプロフィットレベルを含む正確な買いと売りのシグナルを提供します。 PUSH通知を利用して外出先でも取引可能です。 購入後はご連絡ください!私の取引のヒントと素晴らしいボーナスインジケーターを無料で共有します! おそらく、ギャンの取引手法についてはすでに何度も聞いたことがあるでしょう。通常、ギャンの理論は初心者のトレーダーだけでなく、すでにある程度の取引経験がある人にとっても非常に複雑なものです。なぜなら、ギャンの取引手法は理論的にはそれほど簡単に適用できるものではないからです。私はその知識を磨き、最良の原則を私の外国為替インジケーターに組み込むために数年を費やしました。 このインジケーターは非常に簡単に適用できます。必要なのは、それをチャートに添付し、簡単な取引推奨事項に従うだけです。このインジケーターは常に市場分析の仕事を行い、取引の機会を探します。適切なエントリーポイントを検出
現在26%オフ 初心者やエキスパートトレーダーに最適なソリューション! このインジケーターは、独自の機能と新しい計算式を取り入れた、ユニークで高品質、かつ手頃な価格のトレーディングツールです。たった1枚のチャートで28の為替ペアの通貨強度を読み取ることができます。新しいトレンドやスキャルピングチャンスの引き金となるポイントを正確に特定することができるので、あなたのトレードがどのように改善されるか想像してみてください。 ユーザーマニュアルはこちら  https://www.mql5.com/en/blogs/post/697384 これが最初の1本、オリジナルだ! 価値のないクローンを買わないでください。 特別な サブウィンドウの矢印で強い通貨の勢いを表示 GAPがあなたのトレードを導く! 基準通貨や気配値が売られすぎ・買われすぎのゾーン(外相フィボナッチレベル)にあるとき、個別チャートのメインウィンドウに警告表示。 通貨がレンジの外側から反落した場合、プルバック/リバーサルのアラート。 クロスパターンの特別なアラート 複数の時間枠を選択可能で、トレンドを素早く
74% discount for the next 10 buyers (original price $605): 1 left Get a 50% bonus by buying (or even renting) any of our products. After buying (or renting), send a message for more information. 3 Indicators in 1 indicator Strategy based on price action Made specifically for the best forex currency pairs Can be used in the best time frame of the market at a very reasonable price This indicator is basically 3 different indicatos . But we have combined these 3 indicators in 1 indicator so th
A key element in trading is zones or levels from which decisions to buy or sell a trading instrument are made. Despite attempts by major players to conceal their presence in the market, they inevitably leave traces. Our task was to learn how to identify these traces and interpret them correctly. Reversal First Impulse levels (RFI)   -  Version MT5                INSTRUCTIONS                 RUS                 ENG                                       R ecommended to use with an indicator   -  
TPSpro TRENDPRO  - is a trend indicator that automatically analyzes the market and provides information about the trend and each of its changes, as well as giving signals for entering trades without redrawing! The indicator uses each candle, analyzing them separately. referring to different impulses - up or down impulse. Exact entry points into transactions for currencies, crypto, metals, stocks, indices!  -  Version MT5               DETAILED DESCRIPTION        /       TRADING SETUPS           
ご紹介   クォンタム トレンド スナイパー インジケーターは 、トレンド反転を特定して取引する方法を変革する画期的な MQL5 インジケーターです。 13年以上の取引経験を持つ経験豊富なトレーダーのチームによって開発されました。     クォンタムトレンドスナイパーインジケーター   は、非常に高い精度でトレンドの反転を識別する革新的な方法で、あなたのトレーディングの旅を新たな高みに押し上げるように設計されています。 ***Quantum Trend Sniper Indicatorを購入すると、Quantum Breakout Indicatorを無料で入手できます!*** クォンタム ブレイクアウト インジケーターは、トレンドの反転を特定するとアラートを発し、矢印を示し、3 つのテイクプロフィットレベルを提案します。 初心者トレーダーにもプロのトレーダーにも適しています。 量子EAチャネル:       ここをクリック MT5のバージョン:       ここをクリック 推奨事項: 期間: すべての時間枠。最良の結果を得るには、
‍You can visually backtest Break & Retest to see how it behaved in the past!     Manual guide:   Click here $65  for only 2  copies left! Next price is $120 .  This Indicator only places quality trades when the market is really in your favor with a clear break and retest. Patience is key with this price action strategy! Recommended timeframes: M1 for Scalpers.  M5 for Intraday traders. H1 & H4 for Day traders. Other timeframes are also excellent! After many months of hard
FX Volume
Daniel Stein
4.6 (35)
mql5と Telegramの モーニング・ブリーフィングで、詳細とスクリーンショットを含む毎日のマーケット・アップデートをご覧 ください! FX Volumeは、ブローカーの視点から市場のセンチメントをリアルに洞察する、最初で唯一の出来高インジケーターです。 ブローカーのような機関投資家が外国為替市場でどのようなポジションをとっているか、COTレポートよりもはるかに速く、素晴らしい洞察を提供します。 この情報をチャート上で直接見ることは、あなたの取引にとって真のゲームチェンジャーであり、画期的なソリューションです。 以下のようなユニークなマーケットデータ洞察から利益を得てください。 比率は 、通貨のロングポジションとショートポジションの比率をパーセントで表示します。 比率の変化は 、選択した期間内のロング比率とその変化率を表示します。 Volumes Totalは 、通貨の取引量(ロングとショート)の合計をロット単位で表示します。 Volumes Long :全通貨のロングポジションの取引量を表示します。 Volumes(ショート )は、全通貨のショートポジションの取引量を表示
An exclusive indicator that utilizes an innovative algorithm to swiftly and accurately determine the market trend. The indicator automatically calculates opening, closing, and profit levels, providing detailed trading statistics. With these features, you can choose the most appropriate trading instrument for the current market conditions. Additionally, you can easily integrate your own arrow indicators into Scalper Inside Pro to quickly evaluate their statistics and profitability. Scalper Inside
Advanced Supply Demand
Bernhard Schweigert
4.92 (310)
現在33%オフ 初心者にもエキスパートトレーダーにも最適なソリューション このインジケーターは独自の機能と新しい公式を多数内蔵しており、ユニークで高品質かつ手頃な取引ツールです。このアップデートでは、2つの時間枠ゾーンを表示できるようになります。より長いTFだけでなく、チャートTFとより長いTF(ネストゾーンを表示)の両方を表示できます。すべてのSupply Demandトレーダーの皆さんのお気に召すはずです。:) 重要情報の公開 Advanced Supply Demandの可能性を最大化するには、 https://www.mql5.com/ja/blogs/post/720245 にアクセスしてください。   エントリーまたはターゲットの正確なトリガーポイントを正確に特定できれば取引がどのように改善されるか想像してみてください。新しい基盤となるアルゴリズムに基づいて構築されているため、買い手と売り手の間の潜在的な不均衡をさらに簡単に特定できます。これは、最も強い需要と供給のゾーンと、過去のパフォーマンス(古いゾーンを表示)がグラフィカルに表現されるためです。これらの機能は、最適
カスタムMT4インジケーターで外国為替取引を成功させるための秘密を発見してください! 外国為替市場で成功を達成し、リスクを最小限に抑えながら一貫して利益を得る方法を疑問に思ったことはありますか? これがあなたが探している答えです! 取引へのアプローチに革命をもたらす独自のMT4インジケーターを導入できるようにします。 ユニークな汎用性 私たちのインジケータは、RenkoとRangeBarのろうそくのフォーメーションを好むユーザー向けに特別に設計されています。 これらのチャートタイプは多くの経験豊富なトレーダーに好まれていることを理解しています。そのため、私たちのインジケーターはそれらとシームレスに統合され、比類のない市場分析を提供します。 クリアトレンドシグナル 複雑な分析を忘れてください! 私たちのインジケーターは、鮮やかな色と明確なドット構造を利用して、市場の動向を明確に示しています。 赤と青の点は、価格の動きの方向性について疑いの余地がなく、取引の迅速な意思決定を可能にします。 HH/HL HL/LL戦略とのアライメント HH/HLおよびHL/LL構
ご紹介     Quantum Breakout PRO は 、ブレイクアウト ゾーンの取引方法を変革する画期的な MQL5 インジケーターです。 13年以上の取引経験を持つ経験豊富なトレーダーのチームによって開発された Quantum Breakout PROは 、革新的でダイナミックなブレイクアウトゾーン戦略により、あなたの取引の旅を新たな高みに押し上げるように設計されています。 クォンタム ブレイクアウト インジケーターは、5 つの利益ターゲット ゾーンを備えたブレイクアウト ゾーン上のシグナル矢印と、ブレイクアウト ボックスに基づいたストップロスの提案を提供します。 初心者トレーダーにもプロのトレーダーにも適しています。 量子EAチャネル:       ここをクリック MT5バージョン:   ここをクリック 重要!購入後、インストールマニュアルを受け取るためにプライベートメッセージを送ってください。 推奨事項: 時間枠: M15 通貨ペア: GBPJPY、EURJPY、USDJPY、NZDUSD、XAUUSD アカウントの種類: ECN、Raw、また
Scalper Vault は、スキャルピングを成功させるために必要なすべてを提供するプロフェッショナルなスキャルピング システムです。このインジケーターは、外国為替およびバイナリー オプションのトレーダーが使用できる完全な取引システムです。推奨される時間枠は M5 です。 システムは、トレンドの方向に正確な矢印シグナルを提供します。また、トップとボトムのシグナルとギャン マーケット レベルも提供します。 インジケーターは、プッシュ通知を含むすべてのタイプのアラートを提供します。 インジケータの購入後にご連絡ください。私の個人的な取引の推奨事項と素晴らしいボーナス指標を無料で共有します! 幸せで有益な取引をお祈りします!
mql5と Telegramの モーニング・ブリーフィングで、詳細とスクリーンショットを含む毎日のマーケット・アップデートをご覧 ください! FX Power MT4 NGは 、長年の人気を誇る通貨強度計FX Powerの次世代モデルです。 この次世代ストレングスメーターは何を提供するのでしょうか?初代FXパワーの魅力すべて プラス GOLD/XAUの強さ分析 より正確な計算結果 個別に設定可能な分析期間 カスタマイズ可能な計算上限値により、さらに優れたパフォーマンスを実現 もっと見たい人のための特別なマルチインスタンス設定 すべてのチャートでお好みの色を無限に設定可能 数え切れないほどの通知オプションにより、重要なことを見逃すことはありません。 Windows 11とmacOSのスタイルで角を丸くした新しいデザイン 魔法のように動くインジケーターパネル FXパワーの主な機能 すべての主要通貨の強さの完全な履歴 すべての時間枠における通貨の強さの履歴 すべてのブローカーとチャートで同一の計算結果 100%信頼できるリアルタイム計算 -> リペイントなし ドロップダウン・リストから
まず第一に、この取引ツールはノンリペイント、ノンリドロー、ノンラグの指標であり、プロの取引に理想的ですことを強調する価値があります。 オンラインコース、ユーザーマニュアル、デモ。 スマートプライスアクションコンセプトインジケーターは、新米から経験豊富なトレーダーまで、非常 に強力なツールです。Inner Circle Trader AnalysisやSmart Money Concepts Trading Strategiesなど、20以上の有用な指標を1つに組み合わせています。このインジケーターはスマートマネーコンセプトに焦点を当て、大手機関の取引方法を提供し、彼らの動きを予測するのに役立ちます。 特に、流動性分析に優れており、機関がどのように取引しているかを理解しやすくしています。市場のトレンドを予測し、価格の動きを慎重に分析するのに優れています。機関の戦略とトレードを合わせることで、市場の動向についてより正確な予測ができます。このインジケーターは多目的であり、市場構造を分析し、重要な注文ブロックを特定し、さまざまなパターンを認識するのに優れています。 このインジケー
Trend Screener
STE S.S.COMPANY
4.83 (88)
トレンドインジケーター、1つのツールに組み込まれたすべての重要なトレンド機能を備えたトレンドトレーディングとフィルタリングのための画期的なユニークなソリューション! これは、すべてのシンボル/商品(外国為替、商品、暗号通貨、インデックス、株式)で使用できる100%再描画されていないマルチタイムフレームおよびマルチ通貨インジケーターです。 トレンドスクリーナーは、チャート内のドットで矢印トレンドシグナルを提供するインジケーターに続く効率的なインジケーターです。 トレンド分析インジケーターで使用できる機能: 1.トレンドスキャナー。 2.最大利益分析を備えたトレンドライン。 3.トレンド通貨強度メーター。 4.アラート付きのトレンド反転ドット。 5.アラート付きの強いトレンドドット。 6.トレンド矢印 毎日の分析例、毎日のシグナルパフォーマンス...など、トレンドスクリーナーインジケーターを使用して、ここで見つけることができます: ここをクリックしてください 期間限定オファー:トレンドスクリーナーインジケーターは、50ドルと生涯でのみご利用いただけます。 (元の価格125 $) MQ
ブレーカートレーダーになり、価格が反転すると市場構造からの利益が変化します。 注文ブロックブレーカーインジケーターは、トレンドまたは価格の動きが枯渇に近づいており、逆転の準備ができていることを識別します。通常、反転または大規模なプルバックが発生しようとしているときに発生する市場構造の変化について警告します。 この指標は、ブレイクアウトと価格の勢いを識別する独自の計算を使用します。使い果たされる可能性のあるポイントの近くで新しい高値が形成されるたびに、インディケーターはその高値の作成を担当する最後の注文ブロックを描きます。次に、移動する価格とともに注文ブロックを追跡します。その後、価格が反対方向にシフトし、その注文ブロックを突破すると、新しい市場構造を作成し、トレンドまたは大きな後退の可能性のある反転の開始を警告します。 注文ブロックは、高値/安値が作成される前の最後の反対色のろうそくであり、価格がこれらの重要な領域を下抜けすると、トレンドの短期的ま​​たは長期的な反転の兆候です。 特徴 重要な枯渇点での市場構造の変化を警告します 価格が使い果たされるレベルに近づくと、
通貨強さウィザードは、取引を成功させるためのオールインワン ソリューションを提供する非常に強力な指標です。このインジケーターは、複数の時間枠のすべての通貨のデータを使用して、このまたはその外国為替ペアのパワーを計算します。このデータは、使いやすい通貨インデックスと通貨パワーラインの形式で表され、特定の通貨のパワーを確認するために使用できます。 必要なのは、取引したいチャートにインジケーターを接続することだけです。インジケーターは、取引する通貨の実際の強さを示します。このインジケーターは、トレンドに合わせて取引するときに有利に利用できる売買高の圧力の極値も示します。このインジケーターには、フィボナッチに基づく可能なターゲットも表示されます。 このインジケーターは、PUSH 通知を含むあらゆるタイプのアラートを提供します。 購入後ご連絡下さい。私の取引のヒントをあなたと共有し、素晴らしいボーナスインジケーターを無料で提供します! 幸せで有益な取引をお祈りします。
現在20%OFF! 初心者やエキスパートトレーダーのためのベストソリューション! このダッシュボードソフトウェアは、28の通貨ペアで動作しています。それは私達の主要な指標(高度な通貨の強さ28と高度な通貨インパルス)の2に基づいています。それは全体の外国為替市場の大きい概観を与えます。それは、すべての(9)時間枠で28の外国為替ペアのための高度な通貨の強さの値、通貨の動きの速度と信号を示しています。チャート上で1つのインディケータを使用して市場全体を観察し、トレンドやスキャルピングの機会をピンポイントで見つけることができたら、あなたのトレードがどのように改善されるか想像してみてください。 このインディケータには、強い通貨と弱い通貨の識別、潜在的な取引の識別と確認がより簡単になるような機能が搭載されています。このインディケータは、通貨の強さや弱さが増加しているか減少しているか、また、すべての時間枠でどのように機能しているかをグラフィカルに表示します。 新機能として、現在の市場環境の変化に適応するダイナミックなマーケットフィボナッチレベルが追加され、すでに当社のAdvan
このインジケータは、手動および自動的な方法でチャートに描かれたハーモニックパターンを検出します。ユーザーマニュアルは、このリンクから参照できます: あなたのレビューを追加し、入手するために私たちに連絡してください。 この製品をmt4で試すための無料版があります。 GartleyおよびNenstarパターンを検出するために使用できます。 https://www.mql5.com/en/market/product/30181 完全なMT4バージョンを購入するには、次の場所から購入できます。 https://www.mql5.com/en/market/product/15212 注 インジケータにはコントロールパネルがあり、すべての(チャート&時間枠)設定が保存されます。チャート上でスペースをより多く確保するために、最小化することができ、他の分析ツールで作業する場合は、すべてのインジケータデータを非表示にするために閉じるボタンを押すことができます。 このインジケータを使用して設定を変更し、移動平均やボリンジャーバンドなどのインジケータを追加すると、編集のテンプレートが自動的に保存され、必
TrendDecoder Premium
Christophe, Pa Trouillas
5 (3)
レンジと次の動きを特定    |  トレンドの最も早いシグナルと強さを得る   |  反転の前に明確な出口を得る   |  価格がテストするフィボ・レベルを見つける。 非リペイント、非遅延インディケータ - マニュアルおよび自動売買に最適 - すべての資産、すべての時間単位に対応 期間限定キャンペーン   >> 50%OFF 購入後、 推奨セッティングについては、このチャンネルで私に連絡してください。 MT5 バージョン: ここをクリック BladeSCALPER   と   PowerZONES   を使った完全な方法を入手する どのようなものですか? TrendDECODERは、トレンド監視をシンプルかつ簡単にするための複数のイノベーションを集約したものです。 Projective TrendLine (投影トレンドライン) - 今後のトレンドのスピードリファレンス。 RealTime TrendLine vs. Projective TrendLine (リアルタイムトレンドライン vs. Projective TrendLine) - 市場が同じ方
このインディケータは、当社の2つの製品 Advanced Currency IMPULSE with ALERT  +   Currency Strength Exotics . のスーパーコンビネーションです。 このインジケーターは全ての時間枠で作動し、8つの主要通貨と1つのシンボルの強弱のインパルスをグラフで表示します。 このインジケータは、金、エキゾチックペア、商品、インデックス、先物など、あらゆるシンボルの通貨強度の加速度を表示することに特化されています。金、銀、原油、DAX、US30、MXN、TRY、CNHなどの通貨強度の加速度(インパルスまたは速度)を表示するために、任意のシンボルを9行目に追加できる、この種の最初のものです。 新しいアルゴリズムに基づいて構築され、潜在的な取引の特定と確認がさらに容易になりました。これは、通貨の強さや弱さが加速しているかどうかをグラフィカルに表示し、その加速の速度を測定するためです。加速すると物事は明らかに速く進みますが、これはFX市場でも同じです。つまり、反対方向に加速している通貨をペアリングすれば、潜在的に利益を生む取
TrendMaestro
Stefano Frisetti
5 (2)
note: this indicator is for METATRADER4, if you want the version for METATRADER5 this is the link:  https://www.mql5.com/it/market/product/108106 TRENDMAESTRO ver 2.4 TRENDMAESTRO recognizes a new TREND in the bud, he never makes mistakes. The certainty of identifying a new TREND is priceless. DESCRIPTION TRENDMAESTRO identifies a new TREND in the bud, this indicator examines the volatility, volumes and momentum to identify the moment in which there is an explosion of one or more of these data a
このダッシュボードは、市場構造反転インジケーターで使用するためのアラートツールです。主な目的は、特定の時間枠での取消の機会と、インジケーターと同様にアラートの再テスト(確認)についてアラートを出すことです。ダッシュボードは、それ自体でチャート上に配置され、バックグラウンドで動作して、選択したペアと時間枠でアラートを送信するように設計されています。多くの人々が1つのMT4の複数のチャートで市場反転インジケーターを実行するのではなく、一度に複数のペアと時間枠を監視するためにダッシュを要求した後に開発されました。 M5、M15、M30、H1、H4、およびD1の時間枠でアラートを出します。もちろん、取引の場合と同様に、より高い時間枠が最も効果的です。 このダッシュボードは、市場構造反転インジケーターのアドオンとして設計されています。それは独立して機能し、マーケットリバーサルアラートインジケーターによって与えられたパターンと信号にアラートを出します。 ここでマーケットリバーサルアラートインジケーターを取得します:https:// www.mql5.com/en/market/produ
支持線と抵抗線、そしてローソク足のギャップをチャート上に自動的に表示するため、価格が次に向かう可能性のある場所や反転する可能性のある場所を確認することができます。 このインジケーターは、私のウェブサイト(The Market Structure Trader)で教えているポジショントレード手法の一部として使用するように設計されており、ターゲットとエントリーの可能性のための重要な情報を表示します。 このインジケーターには、2つのコア機能と4つの追加機能があります: コア機能1 - 日足、週足、月足のサポートラインとレジスタンスラインの自動表示 このインジケーターは、直近2日間、最大6週間前、数ヶ月前のサポートレベルとレジスタンスレベルを自動的に引き込みます。これらのレベルの見た目は完全にカスタマイズすることができ、いくつ表示されるかを表示することもできます。これらの重要な水準は、しばしば主要な支持線と抵抗線として機能し、価格が転換して引き戻されたり反転したりする場所です。また、価格が向かうターゲットでもあるため、価格が転換する前に、取引に利用できる潜在的な距離を素早く確認するこ
‍You can visually backtest Elliot Wave Impulse   to see how it behaved in the past!     Manual guide:   Click here Starting price of  $45  for the first 25 copies ( 2  left)! -- Next price is   $99 .  This indicator is unstoppable when combined with our other indicator called Katana . After purchase, send us a message and you could get  it  for  FREE as a BONUS!  The Elliot Wave Impulse is a pattern  identified in the Elliott Wave Theory, a form of technical analysis used to an
ADR反転インジケーターは、通常の1日の平均レンジに関連して価格が現在取引されている場所を一目で示します。価格が選択した平均範囲とレベルを超えると、ポップアップ、電子メール、またはプッシュを介して即座にアラートを受け取るため、プルバックと逆転にすばやくジャンプできます。インディケータは、チャート上に1日の平均レンジの極値で水平線を描画し、それらを超える価格の数学的確率が付加されているレベルを超える延長も描画します。詳細については、以下をご覧ください... インジケーターとモニターを補完するADRアラートダッシュボードここでも利用可能なすべてのペア:https:// www.mql5.com/en/market/product/62756 MT5バージョンはこちらからも入手できます:https:// www.mql5.com/en/market/product/64477/ 通常の1日平均レンジ(ADR)内で価格が取引され、これらのレベルを上回っている時間の約60%は、通常、その後の引き戻し(利益確定)の動きを伴う急激な価格の動きの指標です。毎日の範囲の上部または下部からの
PRO Renko Systemは、特別にRENKOチャートを取引するために設計された高精度の取引システムです。 これは、様々な取引商品に適用することができる普遍的なシステムです。 システムは効果的に正確な逆転信号へのアクセスを与えるいわゆる市場の騒音を中和する。 表示器は非常に使いやすく、信号の生成に責任がある1つの変数だけがあります。 あなたは簡単にお好みの任意の取引ツールとレンコバーのサイズにツールを適応させることができます。 私はいつもあなたが私のソフトウェアで収益性の高い取引を支援するために余分なサポートを提供する準備ができています! 私はあなたに幸せで収益性の高い取引をしたいです! ご購入後にご連絡ください! 私はあなたに私のレンコチャートジェネレータを送信します。 私はまた、私の個人的な推奨事項やシステムの他のモジュールを無料で共有します!
Volatility Trend System - a trading system that gives signals for entries. The volatility system gives linear and point signals in the direction of the trend, as well as signals to exit it, without redrawing and delays. The trend indicator monitors the direction of the medium-term trend, shows the direction and its change. The signal indicator is based on changes in volatility and shows market entries. The indicator is equipped with several types of alerts. Can be applied to various trading
現在31%オフ! 初心者やエキスパートトレーダーに最適なソリューション! このインジケータは、独自の機能と秘密の数式を組み込んだ、ユニークで高品質かつ手頃な価格のトレーディングツールです。たった1枚のチャートで28の通貨ペアのアラートを表示します。新しいトレンドやスキャルピングチャンスの引き金となるポイントを正確に把握することができるので、あなたのトレードがどのように改善されるか想像してみてください! 新しい基本的なアルゴリズムに基づいて構築されているため、潜在的な取引の特定と確認がより簡単になります。これは、通貨の強さや弱さが加速しているかどうかをグラフィカルに表示し、その加速のスピードを測定するためです。加速すると物事は明らかに速く進みますが、これはFX市場でも同じです。つまり、反対方向に加速している通貨をペアにすれば、利益を生む可能性のある取引を特定することができるのです。 通貨の勢いを示す縦の線と矢印は、あなたの取引の指針となるでしょう。 ダイナミックマーケットフィボナッチ23レベルはアラートトリガーとして使用され、市場の動きに適応します。もしインパルスが黄色
作者のその他のプロダクト
Boom and crash smasher
Lesedi Oliver Seilane
4.53 (38)
Boom and crash smasher free indicator that works on all timeframe from the one minute to the monthly timeframe. the indicator is 100% non-repaint. the indicator come with sound alerts and email push notification the indicator appears on the current candle stick for faster entries can be used on all charts and renko charts orange dot is your sell signal blue dot is your buy signal
FREE
Nasdaq Explosion
Lesedi Oliver Seilane
3.67 (3)
Nasdaq Explosion Non-repaint Specially made for indices Such As Nasdaq, US30, GER30 and SPX500 works on all time frames for scalping 5 minutes to 30 minutes timeframe (recommended) for swing trading 1 hour timeframe to the monthly time frame (recommended) Red dot signal plus red colour candles is a strong sell signal. Blue dot signal plus blue colour candles is a strong buy signal.
SMC Traders
Lesedi Oliver Seilane
5 (7)
SMC Traders is a non-repaint indicator that is based on Price Action The indicator uses current market structure to predict future reversals. The indicator can be used with our free Market structure zig zag which can be found here:  https://www.mql5.com/en/market/product/91579 Please note to find the HH AND HL CLINK ON LINK ABOVE Timeframes: 15 minutes for scalping 1 Hour for swing trading Purple Arrow look for sells in conjunction with LL White Arrow look for buys in conjunction with HL
FREE
Market Structure Zig Zag
Lesedi Oliver Seilane
4.8 (25)
Free Market structure zig zag to assist in price action trading the screenshots describe how to use and how to spot patterns new version comes with alerts, email alert and  push notification alert can be used on all pairs  can be used on all timeframes  you can add additional confirmation indicators the indicator shows you your higher high and low highs as well as your lower lows and lower highs  the indication makes price action analysis easier to spot.
FREE
Boom and crash Gold Miner v2 trend histogram which works in conjunction with the indicator above that has arrows as shown in the video. PLEASE Note: That the top indicator and the bottom indicator are two separate indicators. the top indicator is  https://www.mql5.com/en/market/product/98066 the bottom one is free. which is the histogram at the bottom.  the trend histogram trading tool that helps to easy detect the trend blue color indicates an uptrend. Orange color is a down trend. 
FREE
non-repaint free MT5 technical indicator works on all timeframes 1 minute to the monthly timeframe  the trade vision buy and sell arrow is a multi currency and synthetic indicator Trade vision buy and sell arrow comes with Push Alerts purple arrow look for selling opportunities white arrow look for buying opportunities.  wait for candle to close and arrow to appear before taking any trades.
FREE
Boom and Crash Gold miner v2 Trading indicator based on market momentum works on m1 for boom and crash 1000 and M5 time frame for normal trading pairs wait for blue arrow to appear plus change of candle stick color and candlesticks must be above the 2 modified moving averages then you can buy the market. wait for orange arrow to appear plus change of candle stick color and candlesticks must be below the 2 modified moving averages  then you can sell the market.
US30 Revolt
Lesedi Oliver Seilane
4.8 (5)
US30 Revolt a Technical indicator that is 100% non-repaint and appears on the current candlestick  works on all timeframes (recommended M15,M30,H1) The indicator is made for US30 but it can be used on other pairs as well When a blue arrow appears look for buying opportunities  When a orange arrow appears look for selling opportunities Please watch the YouTube video on how to properly set up and use the indicator
FREE
Nas100 killer V2 (See video of how we test the indicator live) 1000% non-repaint indicator appears on current candlestick. Timeframes: M5, M15, M30, H1, H4. Works on pairs such as (NAS100, US30, SPX500, and Gold) The indicator is strictly for scalping do not hold trades for too long. Orange arrows look for selling opportunities. Light Blue arrows look for buying opportunities. 
Volality Index scalper indicator  Meant for Volality pairs such as Volality 10, 25, 50, 75 and 100 The indicator works on all timeframes from the 1 minute to the monthly timeframe the indicator is non repaint the indicator has 3 entry settings 1 color change on zero cross 2 color change on slope change 3 color change on signal line cross Orange line is your sell signal Blue line is your buy signal.
Non-repaint price action pattern based indicator works on all timeframe  the indicator is based on a 123 Triangle pattern that happens everyday on the market  the indicator will point out the pattern for you and you can turn on Fib level to see your take profit. Blue triangle is a buy signal Red triangle is a sell signal horizonal blue and red lines is an indication to place your trail stop loss one price has reached that area only entry when the triangle has fully formed
updated hidden market support and resistance. this indicator is made for new current market that has new support and resistance that some traders struggle to see. The indicator works on all timeframes from the 1-minute timeframe to the monthly One Trading tip to use When price is at resistance and the indicator appears wait for a bearish candle to close then enter a sell trade. Same applies for a buy trade when price reaches support level, and the indicator appears wait for the bullish candle
FREE
1000% non-repaint high accuracy signal technical indicator. Solar wind Predator work on all pairs with high and low volatility Solar wind Predator work from the 1 minute timeframe to the Monthly timeframe Swing trading H1 to W1 Scalping M1 to M30 Blue arrows above the zero line look for buying(bullish) opportunities. Orange arrows below zero line look for selling(bearish) opportunities.
Nasdaq Savages Non-repaint indicator  works on all timeframes 1 minute to 15 minutes timeframe for scalpers. 30 Minutes to Monthly timeframe for swing traders The Nasdaq Savages indicator comes with a top right info tab which tells you about the current buy or sell signal, Profit in pips, Stop loss and Target Red arrow is your sell entry signal the white right tick is your exit signal and take profit hit signal Light blue arrow is your buy entry signal the white right tick is your exit signal an
Volality 75 Fractal Scalper Non-repaint The arrows appear on the current candle.  momentum and trend based strategy Works on all timeframes from the 1 Minute to the Monthly timeframe Bollinger bands have been added to show the trend direction whether its bullish or bearish Blue fractal arrow is your buy entry Orange fractal arrow is your sell entry you can use the Vix 75 fractal scalper in combination with other indicators.   
Here is the boom and crash crazy Ma scalper a secretly coded color MA that is 1000% NON-REPAINT Works best on boom and crash 1000 Can be used on all timeframes from the 1 Minute timeframe to the Monthly timeframe  The indicator is also a multi-time frame indicator you can select which timeframe to use The indicator is made for scalping purposes. as the trend changes the color of the indicator changes all well  
Boom and Crash Buy and Sell Trend. Non-repaint. Can be used on all timeframes 1 minute for scalpers. 5 minute to monthly timeframe for swing trading. works on all boom and crash pairs Crash300, Crash500, Crash1000. Boom300, Boom500, Boom1000. Green histogram colour means the trend is up(bullish) Buy signal. Dark orange histogram colour means the trend is down(bearish) Sell signal.
Here is the Double Arrow ArrZZx2 indicator that works best on 5 minutes time frame with Alerts. Good for pairs like NAS100, US30, GER30 and XAUUSD Your buy entry or Sell entry is on the second arrow of the Arr zzz  You can confirm your second arrow with Fibonacci retracement levels the 50% level and the 61.8% which is the golden zone The double is good on strong trending markets look for the breakout on the second arrow  Look at the screenshots for examples. 
Median Renko Terminator works best with renko charts if you do not have a renko chart generator I will email it to you for free and give you the correct settings for scalping or to swing trade NON-REPAINT  COMES WITH ALERTS WHEN THERE IS A SIGNAL Conditions to sell: big purple arrow shows you the direction first then you take the small purple arrow to enter the same direction of the purple arrow. Conditions to buy: big white arrow shows you the up direction first then you take small white arrow
フィルタ:
レビューなし
レビューに返信