Trend Master Histogram MT5
- インディケータ
- Frederic Jacques Collomb
- バージョン: 1.0
- アクティベーション: 5
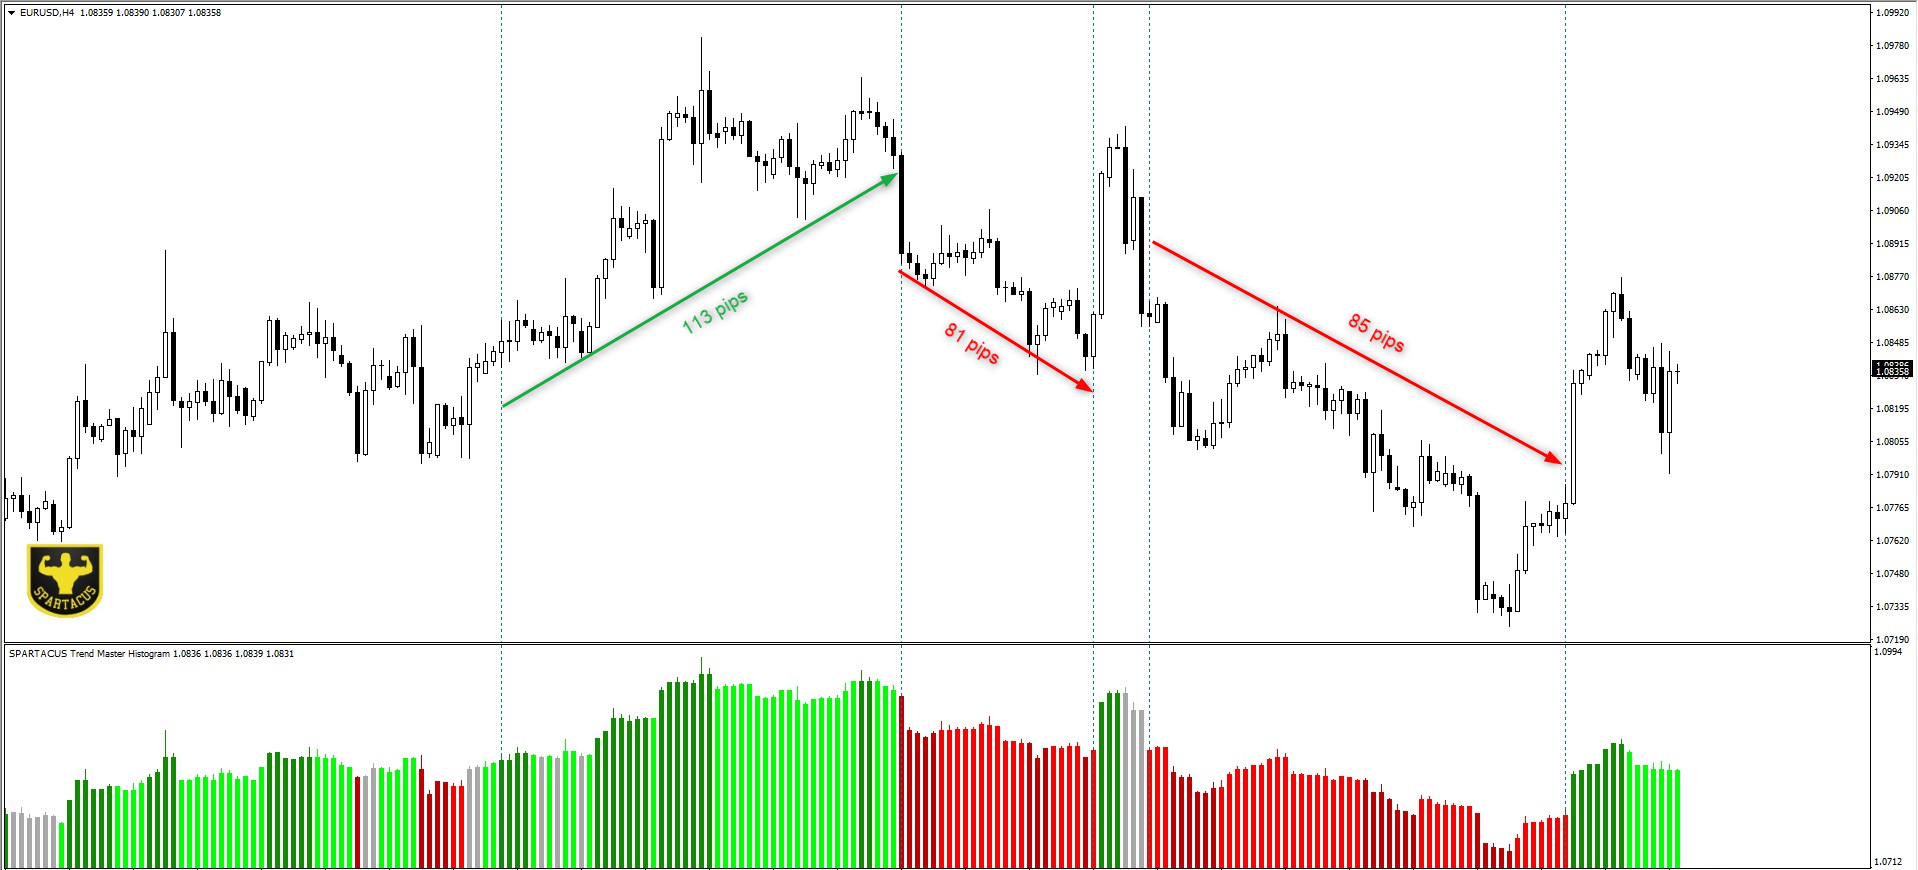
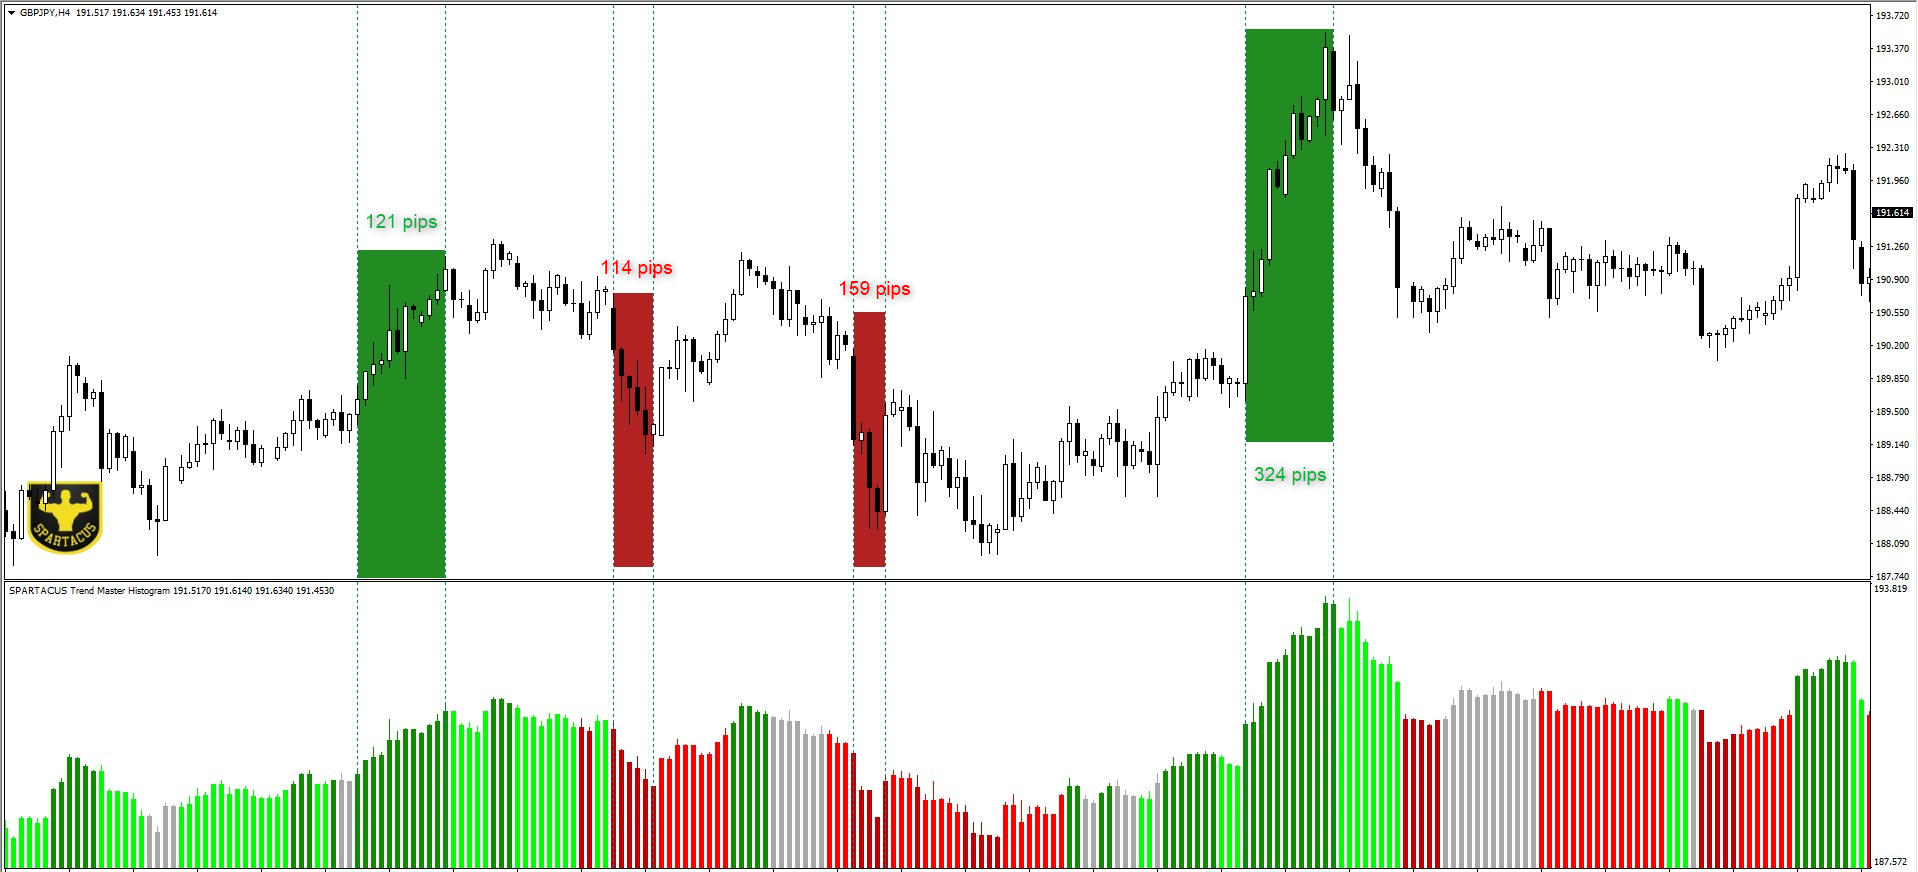
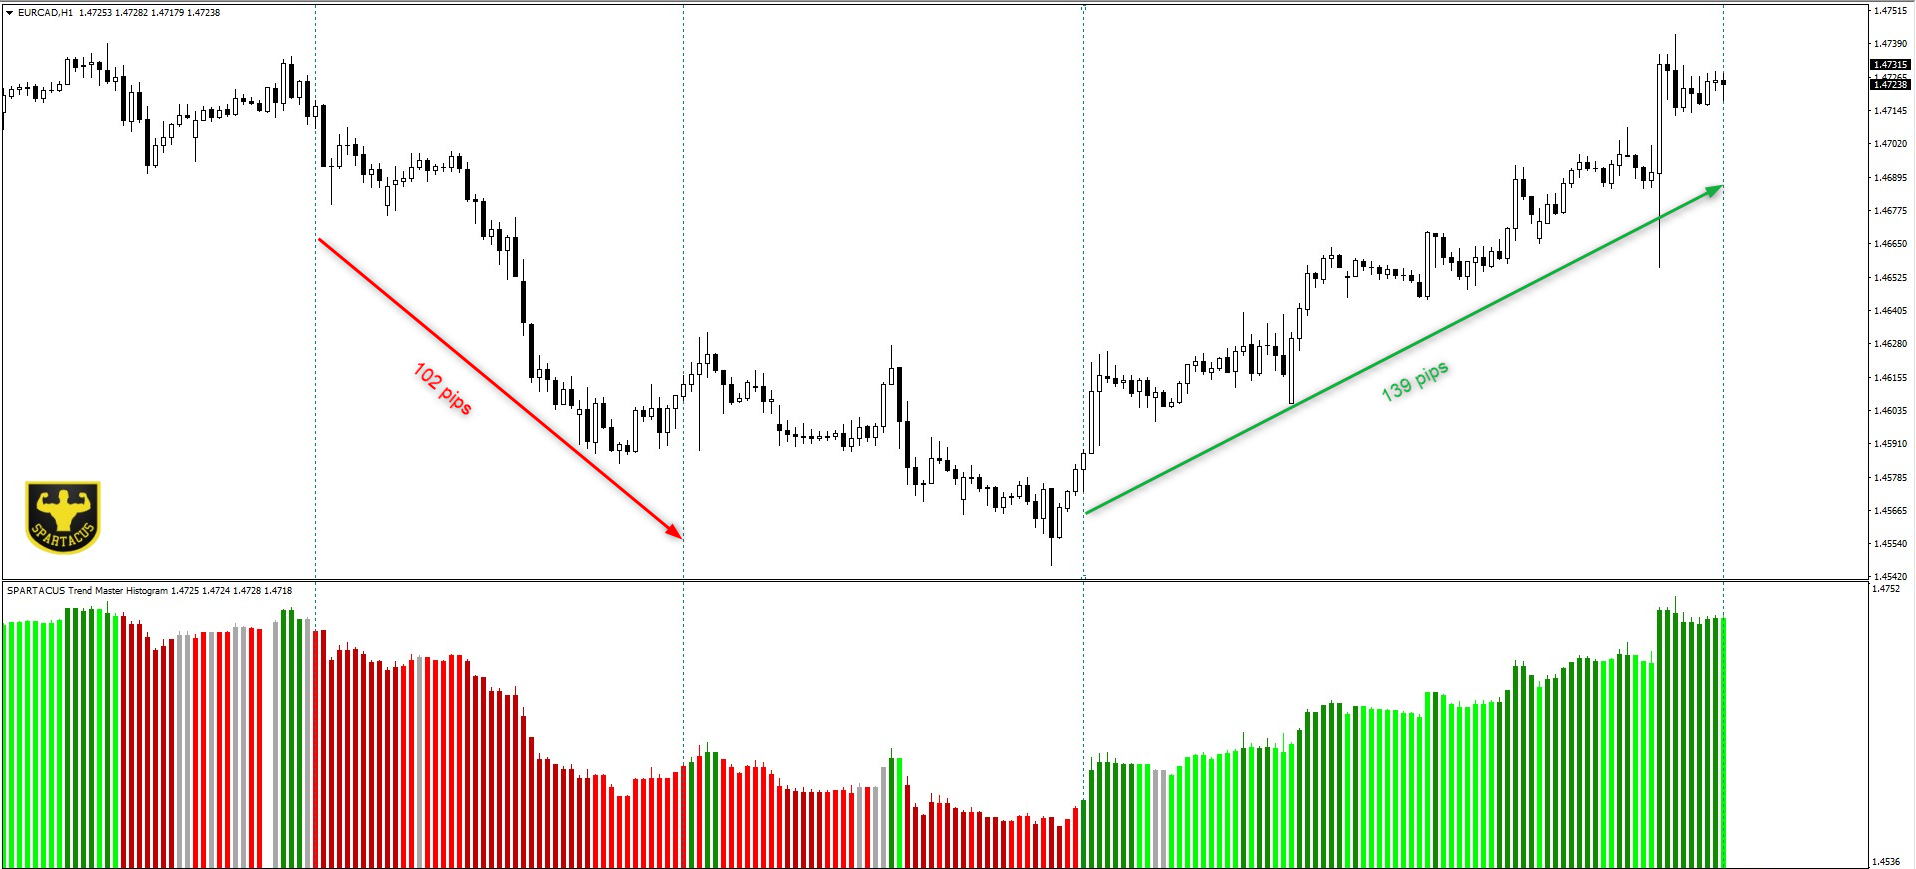
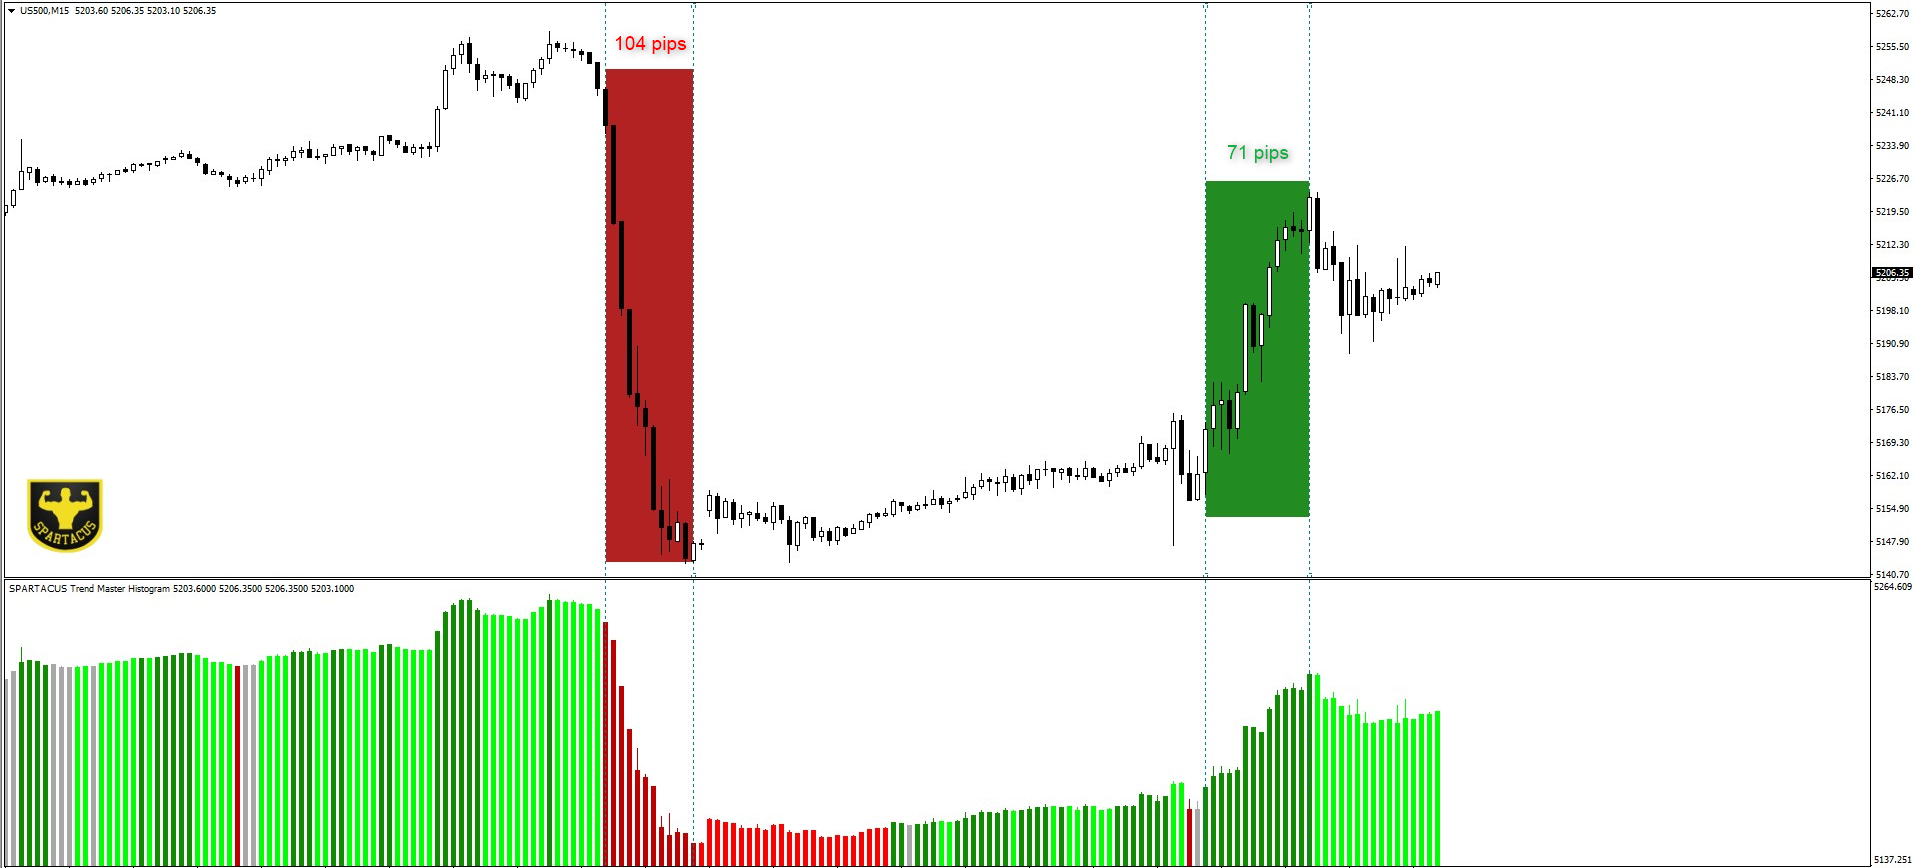
トレンド チャート ヒストグラムは、2 つの移動平均と複数のオシレーターを使用するアルゴリズムに基づくインジケーターです。 カラーコードのおかげで、トレンドを素早く特定し、市場の最大の衝動を利用することができます。
明るい色はトレンドを示し、暗い色は衝動を示し、灰色は市場に参入すべきではないことを示します。
MT4版はこちら。
入力パラメータ:
- 期間 1 (高速期間)
- 期間 2 (低速期間)
- 発振器周期
次の 2 種類のアラートを有効にできます。
- 弱気/強気アラート (市場のトレンドが変化したとき)。
- 売買アラート(強い衝動がある場合)。
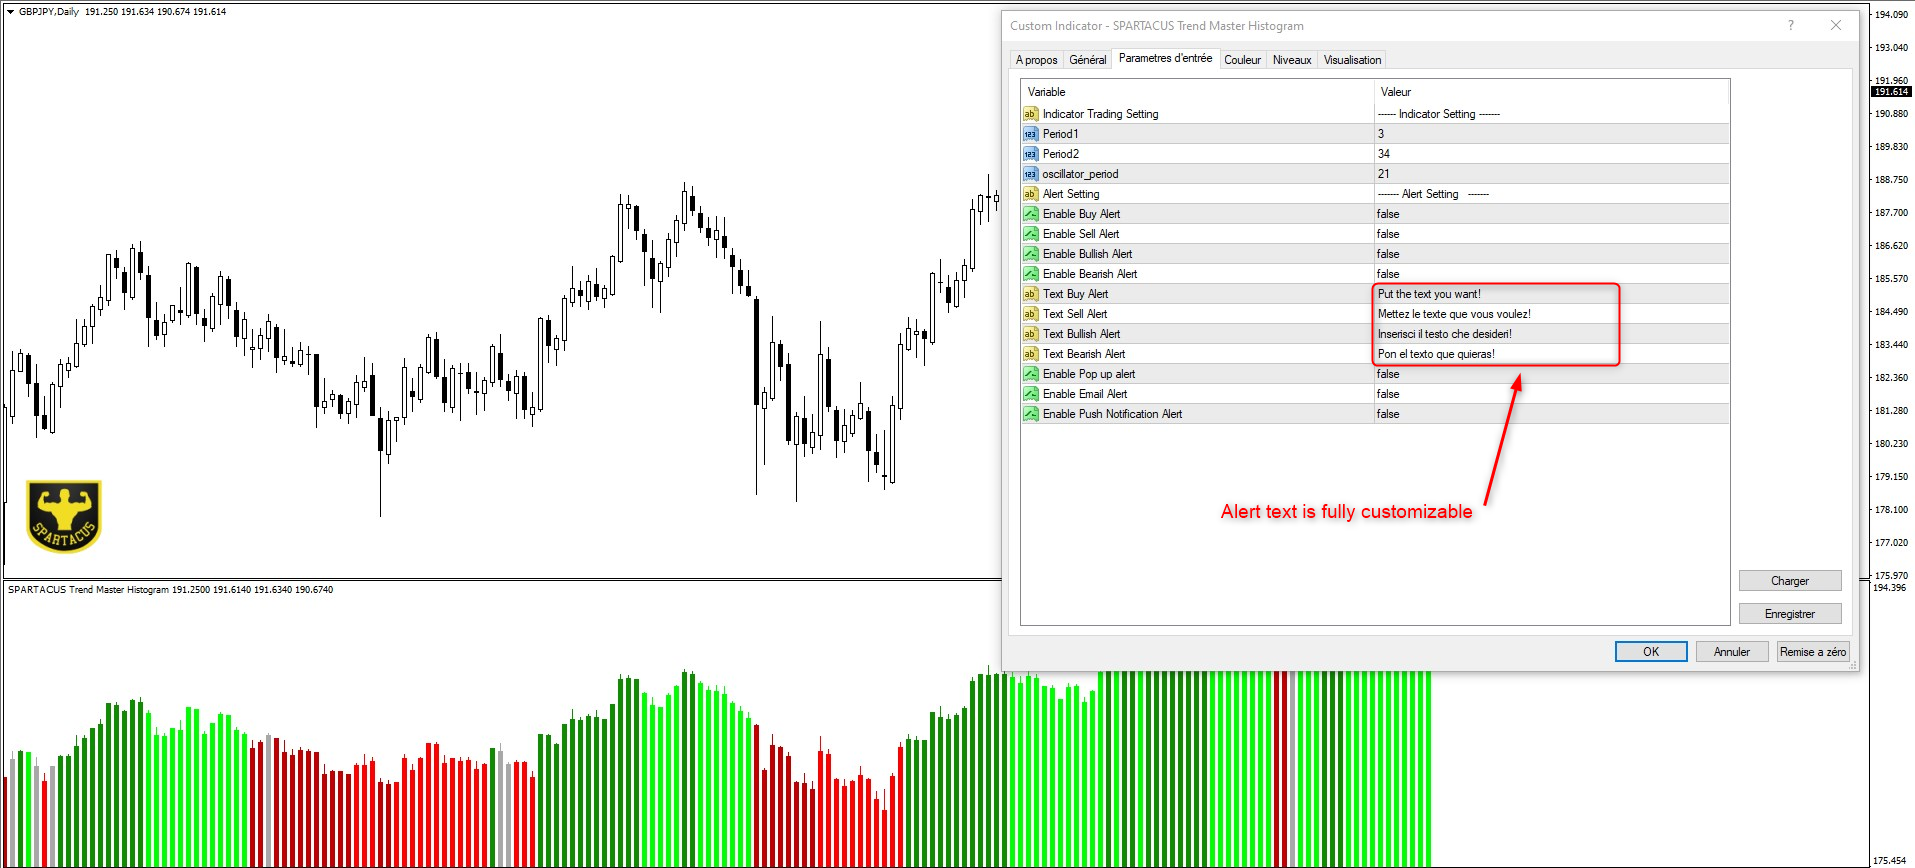
アラートのテキストは完全にカスタマイズ可能で、好きなものを入力できます。
アラートはポップアップ、電子メール、プッシュ通知で利用できます。


ユーザーは評価に対して何もコメントを残しませんでした