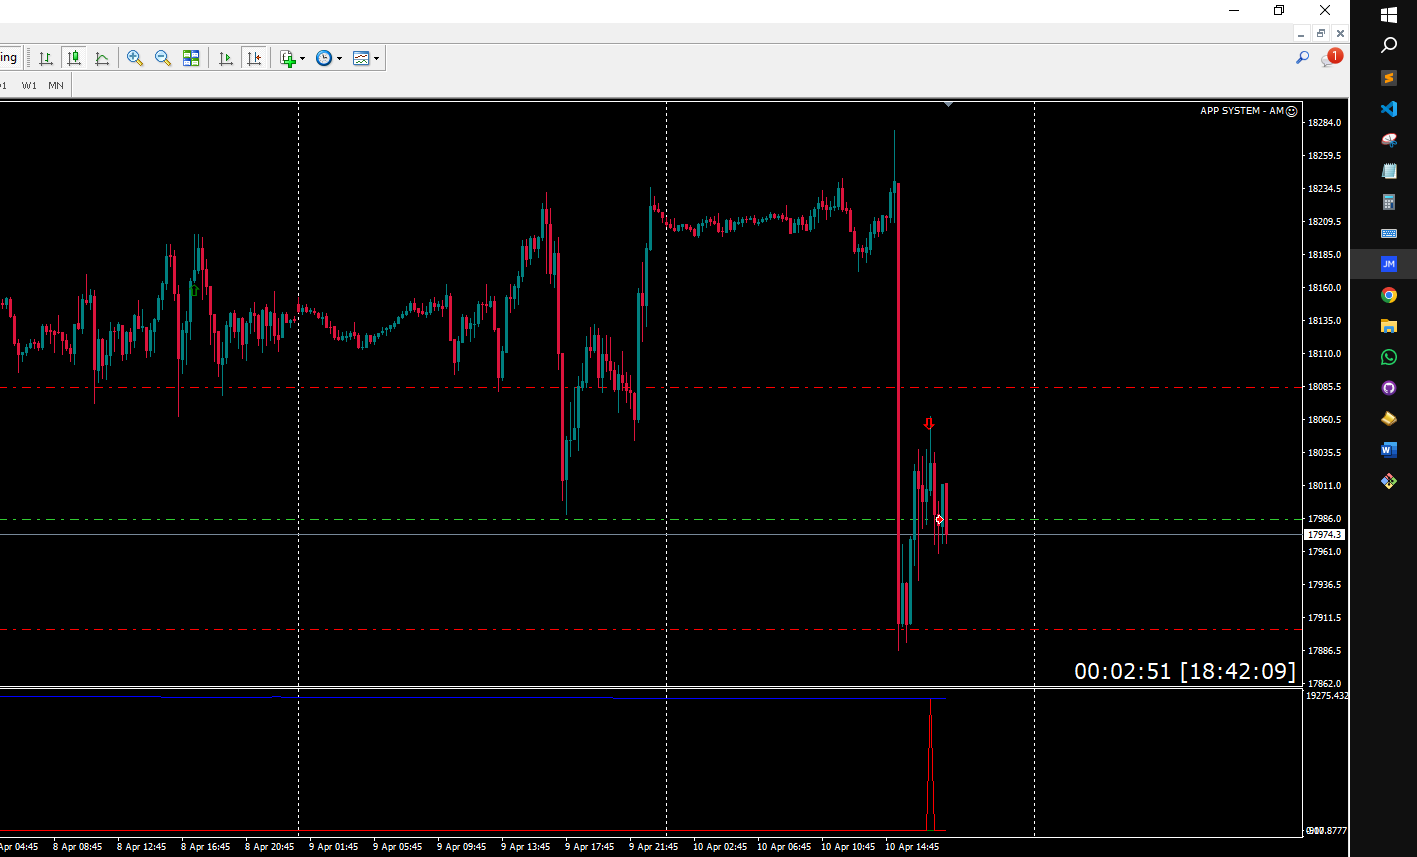
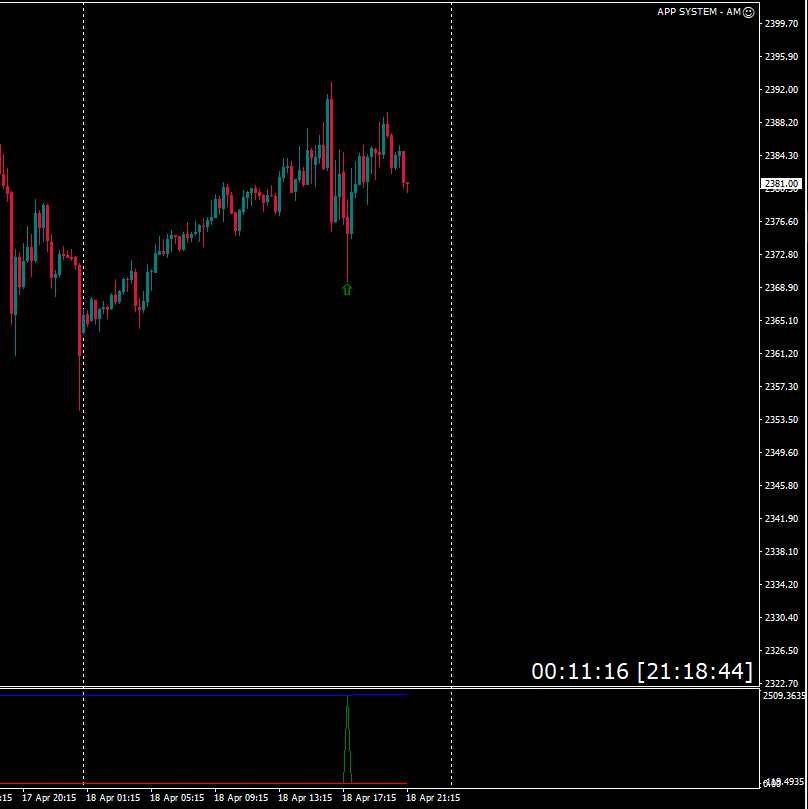
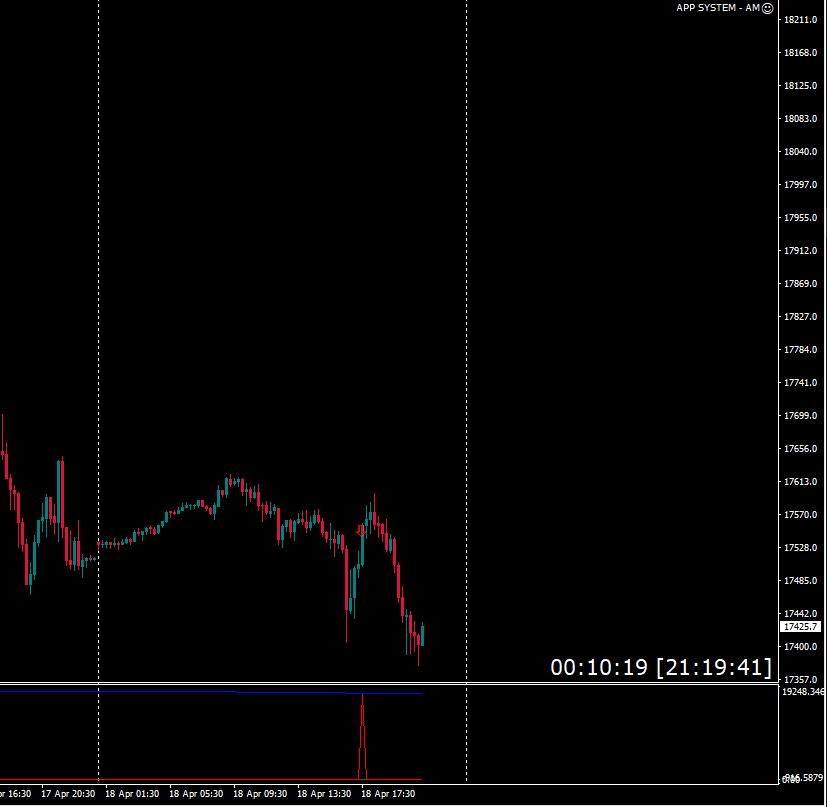
• 概要
  • レビュー
  • コメント
  • 最新情報

App system signals

APP System Signalsは、金融市場で活動するトレーダー向けに設計された洗練された指標です。この指標は、高度なテクニカル分析に基づいて正確な売買シグナルを提供し、トレーダーが賢明な取引を行うのを可能にします。指標は指数移動平均線(EMA)、単純移動平均線(SMA)、基本的なトレンドの組み合わせを使用して信頼性の高いシグナルを生成します。パラメータは完全にカスタマイズ可能であり、トレーダーは自分の取引戦略に指標を適合させることができます。さらに、この指標は使いやすく、すべての経験レベルのトレーダーにとって不可欠なツールです。初心者であっても経験豊富なトレーダーであっても、APP System Signalsは取引のパフォーマンスを向上させ、市場でより賢明な決定をするのに役立ちます。
おすすめのプロダクト
**新登場: オーダーブロックプロ - あなたのMT4取引の秘密兵器!** 金融市場であなたのポテンシャルを最大限に引き出す新しいトレードツールをお探しですか?それなら、我々が誇りを持ってご紹介するのは「オーダーブロックプロ」です。このパワフルなツールは、幅広い機能を提供するだけでなく、従来の指標の制約を克服します。 **オーダーブロックプロの主な特徴** **1. 正確なエントリーシグナル:** チャートと対話する際、オーダーブロックプロは単にエントリーアローを表示するだけでなく、これらのアローが「リペイント」されないように保証します。これにより、不確実性を排除したユニークなエントリーシグナルを提供します。 **2. タイムリーなアラート:** オーダーブロックプロは重要な注文ブロックエリアを特定するだけでなく、価格がこれらのエリアに近づいたときにアラートを出すことも可能です。これにより、素早く正確なトレードチャンスを捉えることができます。 **3. フレキシブルでカスタマイズ可能:** オーダーブロックプロは、好みに合わせてカスタマイズ可能です。注文ブロックエ
The Trend Champion indicator works on all timeframes and currency pairs. The indicator should be used as an auxiliary tool for technical analysis, it helps to determine the direction of the trend: either upward or downward price movement for a particular currency pair. Can be used along with oscillators as filters. Trend Champion is a trend indicator. Arrows indicate favorable moments and directions for entering the market. The indicator can be used both for pipsing on small periods and for l
ToolBox 360 is the swiss knife of all indicators. It is full packed with useful tools to help you with your trading. It can be used to find best entry and exit points and help you to decide if you should open a trade or not. It shows market trends, candlestick formations outside / inside bars and you can sett time based allerts. Main features: Time based Fibonacci lines Choose a start and end time and the indicator shows you Fibonacci lines within the selected time range including range high
Knowledge of the strength and weakness of each currency is vital for every forex trader. Our   Currency Strength Meter indicator   measures the strength of eight major currencies (USD, EUR, GBP, CHF, JPY, CAD, AUD, NZD) by using the Relative Strength Index indicator, also known as RSI. The Currency Strength Meter indicator shows you, simply and quickly, when a currency is oversold, overbought, or in "normal area". This way, you can identify which currency is the strongest and the weakest. Our
Scalper Vault は、スキャルピングを成功させるために必要なすべてを提供するプロフェッショナルなスキャルピング システムです。このインジケーターは、外国為替およびバイナリー オプションのトレーダーが使用できる完全な取引システムです。推奨される時間枠は M5 です。 システムは、トレンドの方向に正確な矢印シグナルを提供します。また、トップとボトムのシグナルとギャン マーケット レベルも提供します。 インジケーターは、プッシュ通知を含むすべてのタイプのアラートを提供します。 インジケータの購入後にご連絡ください。私の個人的な取引の推奨事項と素晴らしいボーナス指標を無料で共有します! 幸せで有益な取引をお祈りします!
Oscillator helps determine the direction of the market Shows the direction of the price movement and is painted in the appropriate color. Allows you to conduct trend and counter trend trading It works on all timeframes, on any currency pairs, metals and cryptocurrency Can be used when working with binary options Distinctive features Does not redraw; Simple and clear settings; It works on all timeframes and on all symbols; Suitable for trading currencies, metals, options and cryptocurrency (Bitco
FREE
Gann Signal is a very simple indicator at first glance, but hidden inside is many years of experience in studying W.D.Ganna methods. The indicator gives accurate BUY/SELL signals, without redrawing. The indicator is very easy to use. All you need to do is attach it to your chart and follow its recommendations. The indicator constantly analyzes the market for entry opportunities. When such an opportunity appears, the indicator gives a signal in the form of an arrow. I repeat, all signals are NOT
The indicator calculates currency strength of eight major and also can calculate strength of any other currency, metal or CFD. You don't need to look through a lot of charts to determine the strong and weak currencies, as well as their current dynamics. The picture of the whole currency market for any period can be viewed in a single indicator window. Built-in tools for monitoring and controlling the situation will help you not to miss out on profits. Main Features It is able to display only t
Indicator is able to alert by pop and acoustic alarm the achievement of the average price range of the last periods so as to be able to set our operation. It allows different percentage variables reached and periods of variation according to the parameters entered. Apply your reverse strategies to achieving that threshold so you get higher success rates. Indispensabile per le strategie reverse intraday.
Create your Dashboard with few clicks! With the  Custom Dashboard Wizard you'll be able to create your dashboard also without any programming knowledge. This indicator/panel will give you the possibility to add/remove the values of the Metatrader4 standard indicators in any time frame you like, with any value you like and in any market you like, just be careful about writing the market name exactly as it's written on the list of your Market Watch. The main panel will be composed of three columns
This is a signal indicator for automatic trading which shows probability measures for buys and sells for each bar. It is based on statistical data gathered on existing history and takes into account all observed price changes versus corresponding bar intervals in the past. The core of the indicator is the same as in PriceProbablility indicator intended for manual trading. Unlike PriceProbability this indicator should be called from MQL4 Expert Advisors or used for history visual analysis. The in
如果产品有任何问题或者您需要在此产品上添加功能,请联系我 Contact/message me if you encounter any issue using the product or need extra feature to add on the base version. Critical Support and Resistance is an intuitive, and handy graphic tool to help you to monitor and manage critical support and resistance price point easily with one glance to know status of all important S&R. Price is likely to pullback or breakout at important support and/or resistance. This indicator is designed to help you monitor these critical sup
**Binary Smart Systemのご紹介:究極のトレードパートナー** Binary Smart Systemは単なるインジケーターではありません。様々な市場で的確なシグナルを提供し、洗練されたアルゴリズムと豊富なテクニカルインジケーターの集合をベースにした、トレーダーを的確さとタイムリーなシグナルで装備するための厳選されたトレードツールです。 **インジケーターコンポーネント:** 1. **移動平均パーセンテージ(MAP):** このコンポーネントは複数の移動平均の加重平均を計算し、トレンドの特定の強力な基盤を形成します。MAPは市場の状況に動的に適応し、現在のトレンド方向に対する洞察を提供します。 2. **商品チャネル指数(CCI):** 平均価格からの偏差を分析することで、CCIは買われすぎと売られすぎの状態を評価します。Binary Smart SystemのCCI統合は、ポテンシャルな反転ポイントを特定する包括的なアプローチを保証します。 3. **移動平均収束拡散法(MACD):** シンプルなクロスオーバーを超えるMACDコンポーネント
Currency Correlation Plus is an expensive version of the indicator. It is equipped with the signal and is more equipped than its cheaper brother. The indicator helps us understand and see a correlation. Second chart makes it easy to analyze and trade multiple currencies. On the chart, you can post multiple pairs. Type in the selected currency pair in the settings and add it to the chart. If you want to have another tool, see another product: https://www.mql5.com/en/market/product/13392 Inputs
XFlow shows an expanding price channel that helps determine the trend and the moments of its reversal. It is also used when accompanying transactions to set take profit/stop loss and averages. It has practically no parameters and is very easy to use - just specify an important moment in the history for you and the indicator will calculate the price channel. DISPLAYED LINES ROTATE - a thick solid line. The center of the general price rotation. The price makes wide cyclical movements around the
インジケータMTFクリスタリウム矢印は、半自動取引システムであります. これは、すべての通貨ペアで動作します。  インジケータは、三つのルールを使用しています:1)我々は唯一のトレンドで取引、2)"誰もが販売しているときに購入し、誰もが買うときに販売する"、3)価格  インジケータMTF矢印は、内蔵の指標を使用して、複数の時間枠全体のクリスタリウムフィルタルール。 トレンドは、選択した時間間隔で一致した場合、インジケータは、市場に参入するための矢印を与えます。 それからあなた自身の決定をする。 購入する-緑の矢印、売る-赤い矢印。 指標では、ロットを変更したり、EAの取引時間とシャットダウン時間を設定することができます。 また、作業期間と時間フィルタを変更することができます。 ビープ音が鳴ってる  推薦された働く期間D1。 フィルタH1とH4。  設定: TF働く期間(推薦されたD1) Cci_cperiodcomment CCIレベルアップ CCIレベルDn CCI価格 SARステップ SAR最大値 TFのFilter1–(推薦されたH1
PTW NON REPAINT TRADING SYSTEM + HISTOGRAM Non-Repainting ,   Non-Redrawing   and   Non-Lagging  Trading System. Does the following: - Gives Accurate Entry and Exit Points - Scalping, Day and Swing Trading  - 95% Accuracy  - Targets, where to take profits. - Shows Trends, Support and resistance levels - Works on All Brokers - Works on All Currencies, CFDs and Stocks - It does not place trades for you, it only shows you what trades to place. - It works on All Timeframes - It is for Trend or ra
News Robo
Thushara Dissanayake
2 (1)
News Robo Expert Advisor は、ニューストレーダーがニュースリリース中に隠れストップロスを含む未決注文をオープンできるように設計された強力なツールです。取引体験を向上させ、取引を保護するいくつかの機能を提供します。 News Robo の重要な機能の 1 つは、ストップロスの隠蔽です。これは、マーケットメーカーブローカーからストップロスを隠したいニューストレーダーにとって理想的です。利益を得るポジションが得られるとストップロスが自動的に表示されるため、利益を効果的に確保できます。さらに、エキスパートアドバイザーは適切なリスク管理手法を採用して、取引資金を確実に保護します。 News Robo では、保留中の注文を開くには、クイック モードとタイム モードの 2 つのオプションがあります。クイック モードを使用すると、デフォルト設定に基づいて保留中の注文を迅速にオープンできるため、ニュース時間を手動で設定するのを忘れた場合に便利なソリューションとなります。一方、時間モードを使用すると、未決注文をオープンする正確な時間を指定できるため、より柔軟でカスタマイズが可能にな
Power Average
Khurram Mustafa
4.25 (8)
This Indicator is a  affordable trading tool  because with the help of  Popular Developers & Support of M Q L Platform  I have programmed this strategy. I tried to combine logic of  Moving Averages, Parabolic Stop And Reverse, Trend Strength, Oversold, Overbought . Furthermore, I have also care about  Support Resistance  that Trader can easily get in touch with market by selecting one indicator only. What is in for Trader? Trading Modes:  This selection is for  activate whole strategy  "Power
FREE
Does your trading consist of Multiple EA's, Multiple time frames an no clear indication of how each individual strategy or time frame is performing, then this indicator will help. Assign the EA Magic number to this indicator and track it's performance on the chart by selecting on chart the period, today, week, month year or all history to view. Easy visual colour changing header to display the performance of the EA for the respective periods.    Minimize the panel to reduce chart clutter. Add yo
The Trend Analysis Indicator is an innovative tool designed for traders and investors who seek to navigate the complexities of the financial markets with greater precision and insight. This powerful indicator is engineered to adeptly identify whether a market is trending or not, offering users a vital edge in their trading strategy. Key Features: Accurate Trend Detection : The core functionality of the Trend Analysis Indicator lies in its ability to accurately detect market trends. It analyzes p
Indicator for binary options arrow is easy to use and does not require configuration works on all currency pairs, cryptocurrencies buy signal blue up arrow sell signal red down arrow tips do not trade during news and 15-30 minutes before their release, as the market is too volatile and there is a lot of noise it is worth entering trades one or two candles from the current period (recommended for 1 candle) timeframe up to m 15 recommended money management fixed lot or fixed percentage of the depo
Heikin-Ashi-Sniper is a perfect addition to your portfolio. This is the second part of the Portfolio. It is meant to be traded on GBPUSD on H1 Timeframe. It uses Bollinger Bands to determine optimal entry signals while having a reasonably low drawdown Each Expert of our portfolio uses a different technique to minimize curve fitting and diversify the strategy. More EA´s will be published shortly to complete the Portfolio. The EA Trades not very frequently it waits for the right chance and place
Octet   指標は多通貨であり、56の通貨ペアを同時に分析します。すべての通貨ペアが市場の概要にあり、それらの相場がロードされていることが重要です。 インディケータは、他の7つの通貨に対する特定の通貨の上昇または下降を線の形で示します。指標値はパーセンテージで表されます。 インジケーター設定の説明 Type_Calculation-通貨の成長または下降のパーセンテージを計算するための3つのオプション プレフィックス-通貨ペアの指定にプレフィックスがある場合に使用されます。例:EURUSD.fxp、設定Prefix = .fxp Show_AUD-他の7つの通貨と比較したAUD通貨の合計計算値を表示します Show_EUR-他の7つの通貨と比較したEUR通貨の合計計算値を表示します Show_GBP-他の7つの通貨と比較したGBP通貨の計算値の合計を表示します Show_NZD-他の7つの通貨と比較したNZD通貨の合計計算値を表示します Show_CAD-他の7つの通貨と比較したCAD通貨の合計計算値を表示します Show_CHF-他の7つの通貨と比較したCHF通貨の合計計算値を
Introduction This indicator detects volume spread patterns for buy and sell opportunity. The patterns include demand and supply patterns. You might use each pattern for trading. However, these patterns are best used to detect the demand zone (=accumulation area) and supply zone (=distribution area). Demand pattern indicates generally potential buying opportunity. Supply pattern indicates generally potential selling opportunity. These are the underlying patterns rather than direct price action. T
Working with the Channel Motion Tracker indicator is as simple as possible. Just react to the arrows that the indicator displays. Each arrow represents an explicit command to action. The signals generated by this indicator are accurate enough to allow you to trade based on this information. One of the main advantages of the indicator is its ability to build high-quality channels and generate signals for entering the market. This is great for the trader who always finds it difficult to choose
MT Merit Pullback
Issara Seeboonrueang
5 (1)
Please feel free to contact me if you need any further information. Please let me know if you have any questions. I hope the above is useful to you. MT MERIT PullBack : It is an indicator created to find pullback signals filter trend. Use a complex method to find signals. Suitable for short-term profit, able to make profit in many cycles. Suitable for people who trade by yourself, do not use with ea  (non auto trade) manage risk management by yourself (Stop Loss,TP, Risk Reward, ...) and
It's a variation of mid of HH and LL since it compares the higher of HH or LL against a period and twice the number of bars back to avoid whipsaws. I used to display this against lines on a chart, but made a histogram out of it and it looks interesting. It looks good at gauging trend strength and general turns (see image below). The name of the indicator is BAM, which is an acronym for "Below and Above Mid". Ways to use it: 1. To see general trend on longer TFs (more than 30 ba
Divo MT4
Anton Kondratev
5 (2)
DIVO EA     です   複数通貨 、     フレキシブル 、     完全に自動化   そして   多面   識別するためのツール   脆弱性   の中に   市場 Only 8 Copies of 10 Left  for 745 $ Next Price 1475 $ 設定 よくある質問 最適化 設定について リアルモニタリング インストールする方法 Not    Grid   , Not    Martingale   , Not     AI     , Not     Neural Network. Default Settings for One chart    GBPUSD M15     (Supports 1OHLC mode for weak PCs)  EA を購入した後は、必ずプライベート メッセージで私に連絡してください。あなたを EA に追加します。     プライベートグループには 、設定ファイルと追加の詳細な手順を送信します。 私は各購入者がアドバイザのインストールと構成を支援する準備ができています。 これまでEAを使用したことがない場合
One of the best EAs on MQL For backtests you can use this SET How to install The EA must be connected to only one M15 chart (for example: NZDCAD M15) Easy to set up: _base_  - You can leave the default setting Symbols: AUDCAD,NZDCAD,AUDNZD - multicurrency set from one chart M15 First Trade: Long and Short - sets Long/Short positions Emergency closing at BE - Close all positions on BE Orders Comment - comment at trade Magic Number - Magic Number Virtual TP - sets the virtual TP New Year
このプロダクトを購入した人は以下も購入しています
This indicator is based on the mathematics of the great trader W.D. Ganna. With its help, you can easily find strong levels by analyzing swings to find the optimal entry point. The indicator works on all instruments and all timeframes. The indicator is fully manual and has control buttons. All you need to do is press the NEW button, a segment will appear, which you can place on any movement, swing or even 1 candle that you want to analyze. By placing the segment, press the OK button. A grid (th
The indicator of a Professional Trader is an arrow indicator for predicting the direction of price movement. I have been working on this indicator since 2014. You can use this indicator as your main indicator, use its entry signals, and use it as your only indicator to find entry points. About the product: Recommended TF [H4-D1-W1]   . The indicator predicts the direction of the next candle. Fits a variety of tools; Flexibility in settings for different instruments and intervals through the
Full Forex Market View Dashboard
Opengates Success International
5 (2)
FULL FOREX MARKET VIEWダッシュボードインジケーター これは、トレーダーが市場で何が起こっているかを完全に把握できるようにするために作成されたカスタム指標です。 リアルタイム データを使用して市場にアクセスし、取引を成功させるために必要なあらゆる情報を表示します。 インストール: このインジケーターをウィンドウ チャートに添付する前に、MT4 のマーケット ウォッチ パネルに移動し、不要な通貨ペアまたは取引しないすべての通貨ペアを非表示にして、残りをそこに残します。 その理由は、FFMV ダッシュボードが MT4 の気配値表示に表示されるすべての通貨ペアを表示するためです。 最大 30 通貨ペア以下を表示できます。 MT4 の気配値表示でそれ以上だと、FFMV ダッシュボードのフォントと画像がぼやけて変形します。 正しく表示されません。 使用法:      個人取引の場合      バスケット取引の場合 (方法についてはスクリーンショットを参照してください)      複数注文取引にも使用可能      独自の取引システムなどから
驚異的なFXインジケーター「Miraculous」をご紹介します。完璧な結果を得るための1時間足を含むすべてのタイムフレームで効果的に機能する、最強の強力な特殊MT4フォレックスインジケーターです。 すべてのタイムフレームで優れた結果を提供する最高のFXインジケーターを探し続けるのに疲れましたか?これ以上探す必要はありません!「Miraculous」フォレックスインジケーターをご紹介します。このインジケーターは、トレーディングの経験を変革し、収益を新たなレベルに引き上げるために設計されました。 先進のテクノロジーと長年にわたる緻密な開発に基づいて構築された「Miraculous」フォレックスインジケーターは、FX市場における力と正確さの頂点となります。この素晴らしいツールは、すべてのレベルのトレーダーのニーズを満たすように設計されており、一貫した収益性を追求する上で比類のない優位性を提供します。 「Miraculous」フォレックスインジケーターの他との違いは、その非常に適応性にあります。デイトレーダー、スウィングトレーダーであろうと、長期ポジションを好む方であろうと、このインジケータ
フルSTOインジケータ(3つのSTOインジケータのすべてのバージョンを含む:プレミアム、ゴールド、シルバー) - STABLE TRADE OPTIONは、自動バイナリーオプション取引のために設計されています。 注意深くお読みください! 重要 1つのターミナルで、異なる有効期限を持つ2つのテンプレートを作成します。18:01、18:02のテンプレートは有効期限が1~15分、22:00のテンプレートは有効期限が10~20分です。 勝率:過去5年間で71 資金管理: 預金から0.3 このバージョンのインジケータは、モスクワ時間18:01、18:02、22:00の取引にのみ設定され、有効期限は銀と金が1~15分、プレミアムバージョンは10~20分です。シグナルはローソク足の内側に表示され、すぐに取引を開始します。 インジケータは完全に設定されているので、自分で何かを変更する必要はありません。インストールして取引してください! 実際の口座でstoの全バージョンをチェックし、結果を確認するのに2年以上かかりました。長年のテストの結果、最適なパラメータが選択さ
WARNING!! THIS SWORD IS TOO SHARP!    ONLY 10 COPIES LEFT FOR THE NEXT PRICE TO BE 8,000$ FOR UNLIMITED PLAN. Dear traders I am very glad once again to introduce to you my other tool called "Forex Sword Indicator". In short this tool is meant to give you an edge over the market that you have been waiting for  so long. Now, here it is. It is a very very simple tool but yet a dangerous sword. I call it a  Holy grail indicator!. I will not talk a lot about this tool. Just let the tool speak by itse
BRICS HISTOGRAMĂ   Bun venit !   Cumpăra din bara albă a histogramei. Vindeți la bara galbenă a histogramei.   Acest indicatorul este indicatorul săgeților BRICS transformat într-un indicator histogramă.   Pe AUDCHF, GBPUSD, AUDJPY, NZDUSD, USDJPY funcționează foarte bine.   Eu recomanda – GBPUSD, M15, SL = 0 sâmburi, TP = 10 sâmburi minim. El funcționează în mod constant cu rezultate foarte bune.   Alt Perechile pot da semnale mai rare sau pot avea unele pierderi sau nu funcționează.   Succes!
Weis Wave with Alert
Trade The Volume Waves Single Member P.C.
4.8 (20)
Rental/Lifetime Package Options and Privileges' * For optimum results the yearly or lifetime package is suggested due to live training and Discord  channel trading with the  creator! Rent Monthly Six Months   Yearly/Lifetime Weis Wave with Speed with Alert+Speed Index x x x Manual  x x x Quick Set up Video x x x Blog x x x Lifetime Updates x x x Setup and Training Material x x Free Rectangle Break Alert Tool      x Discord Access Channel "The SI traders" x 2-hour live methodology traini
IA Trendx3 PRO
Marco Aurelio Santos Costa
What if God Created a Trade System? No miracles... Just see how mathematics can be effective in the market. We managed to combine technical analysis / price action into indicators, creating the best setup for trading, be it in Forex, Indices, or stocks. It took us 2 years to create something that really works, and now it's time for you to discover it. TrendX3 is a revolution in trend analysis. Based on advanced algorithms and real-time data, it provides valuable insights so that you can make inf
ARGH DD買い売りインジケーター このインジケーターはヒストグラムインジケーターです。 これは、誤検知がほとんどない、強力で正確なインジケーターです。 これらが引き起こす取引は、数日または数週間にわたる取引です。 しかし、それらは非常に安定した取引です。 もちろん、エントリールールは非常にシンプルです。 ️ 青いヒストグラム バーは、買いポジションの開始を示します。 ️ 赤いヒストグラム バーは、売りポジションの開始を示します。 取引開始後、しばらく市場が逆方向に動く可能性があることに驚くべきではありません。 90% 以上の場合、意図したとおりに戻ります。 取引には H4 および D1 期間が推奨されます。 インジケーターをチャートにアタッチするときは、[最小値を 0 に固定] ボックスをオンにします (画像を参照)。 例: 2023 年の初めから現在まで、EURUSD ペアでは、この指標は 14 回の取引の開始を示してきました。 これら 14 回の取引のうち、損失は 1 回だけで、他の取引はすべて非常にうまくいきました
Connect Indicator is a tool used for connecting indicators between the MQL market and MT4. The connected indicators are made by our group and can be used for other applications, such as sending messages to the Line application or Telegram application. If you have any questions, please don't hesitate to ask us to receive support. Function and indicator buffer Buffer one is the high price of the previous candle. Buffer two is the high price of the previous candle. Usage To connect indicators to fu
TRANSACTION SPEEDは、大口注文がいつどこで市場に集積され、その恩恵を受けているかを示す最高品質の指標です。トレンドの変化を非常に早い段階で検知します。インジケーターであると同時にトレーディングシステムでもあります。そのコンセプトはユニークで、驚くほど収益性が高い。 FXでは、ティックボリュームはボリュームと呼ばれ、誤解を招きやすい。実際は、単位時間当たりの価格変動であり、事実上、取引速度(TRANSACTION SPEED)です。 このインジケーターは、FXにおける出来高の概念を完全に見直し、正しい方法で論理的に定義し、このロジックを適用することで、ユニークで正確なトップレベルの収益ツールになります。 スピードが上がれば、それはより大きな関心とそれに対応するエントリーとエグジットのサインです。 使い方は? このインジケーターは、市場の取引スピードを測定・比較するため、まず最初に行うべきことは以下の通りです。 比較を行う期間を選択することです。 通常、15日前が比較の出発点となります。 インジケータに日付を入力して実行する。 30分または1時間のタイムフレー
The breakout algorithm is a technique based on price, price features, to shape a breakout strategy. The strategy in this indicator will not be redrawn (none-repaint indicator), it is suitable for short or long term traders In the screenshot is the EURUSD pair, these currency pairs, commodities or stocks, it have similar strength *Non-Repainting (not redrawn) *For Metatrader4 Only *Great For Scalping *Great For Swing Trading *Arrow Entry, Green is Long, Red is Short *Works On Any Timeframe *Work
StalkeR Arrow
Abdulkarim Karazon
5 (4)
StalkeR Arrow は、バーオープン/バー内で売買シグナルを与える矢印インジケーターです。このインジケーターは価格行動パターンとフラクタルに基づいています。 このインジケーターは、各買いシグナルと売りシグナルの tp と sl を与えます。tp と sl は各シグナルの上下の線の形式であり、新しいシグナルが形成されるまで延長されます。 このインジケーターには、履歴シグナルの勝敗統計を提供するバックテスト パネル/ダッシュボードがありますが、このインジケーターは再ペイントやバックペイントを行いません。 パラメーター : StalkeR 周期 : 矢印周期、数値が大きいほど信号が少なくなります スプレッド: ポイント単位のスプレッド値を使用して、パネル上の勝敗を計算します。 ストップロス ATR x : atr 乗算における SL 値 Takeprofit ATR x : atr乗算のTP値 ATR 期間 : に基づいて tp と sl を計算するために使用する atr 期間 TP/SL ラインの色と幅 矢印の色と幅 パネル/ダ
WARNING: PRICE IS SUBJECT TO RISE AT ANY TIME. GET YOUR COPY TODAY TO AVOID MORE COST! Dear Traders I am so glad to introduce to you my other tool called the Forex Sniper Entries Indicator. This tool is designed to help serious traders and investors capture big moves in the currency price movements. The philosophy behind this tool is all about winning big and riding the price movement from its beginning until the maximum point. We want to capture those big moves in both down and up markets as mu
"Dragon's Tail" is an integrated trading system, not just an indicator. This system analyzes each candle on a minute-by-minute basis, which is particularly effective in high market volatility conditions. The "Dragon's Tail" system identifies key market moments referred to as "bull and bear battles". Based on these "battles", the system gives trade direction recommendations. In the case of an arrow appearing on the chart, this signals the possibility of opening two trades in the indicated directi
Black series MT4 - The indicator is designed for trading on binary options with Timeframe M1-M5-M15 Multicurrency (Works on cryptocurrency and currency pairs) The signal appears when the candle opens Up to 90% correct signals There is no signal redrawing at all Can be used with other indicators. Good for scalping! In Settings there is: -Indicator working methods -I Allert Arrow color Red signal down Blue signal up Also watch the video how the indicator works and signals
MT My Way
Issara Seeboonrueang
Best strategy,  Easy trade ,  Support of version update in the future MT My Way:  For new traders with no experience It is a very simple trade. Open the order when there is signal and close the order when there is exit or found the next opposite signal. You can set Stop Loss at the arrow and set the distance at Arrow Gap. For experienced traders, It will be very easy to trade. indicator for trade by yourself TRADE: Forex TIME FRAME:  All Time Frame (Not M1) SYMBOL PAIR: All Sym
Idea: RSI ( Relative Strength Index) and CCI ( Commodity Channel Index ) are powerfull to solved the market.  This indicator has Smoothed Algorithmic signal of RSI and CCI. So that, it separates the market into buy and sell zones, these areas are marked with arrows, red for downtrend, green for uptrend. This algorithm has the effect of predicting the next trend based on the historical trend, so users need to be cautious when the trend has gone many candles. Please visit screenshots
Intro to APAMI, PROfessional edition Trace exactly how far prices trend between two price levels with fractional pip precision, while qualifying price movement between the same price levels. Completely automate when trends change direction and volatility, without any lag .  This is possible because the Accurate Price Action Measurement Indicator (APAMI) actually does what no other indicator can:  measure price distance between two points and simultaneously qualify the price action that occurs
Weddell Pro is a good trading tool that is suitable for both a beginner and an experienced trader. It can be used both separately and combined with other strategies and indicators Configured for currency pairs was tested several times on cryptocurrency but did not show a high result Currency pairs USD/EUR AUD/CAD GBP/USD Showed itself very well here The percentage of correct transactions is above 68%, which does not make it perfect and bad Doesn't draw or disappear The red arrow sho
VTrende Pro MT4 - MTF indicator for trend trading with a display panel for MT5 *** Videos can be translated into any language using subtitles (video language - Russian) Although the signals of the VTrende Pro indicator can be used as signals of a full-fledged trading system, it is recommended to use them in conjunction with the Bill Williams TS. VTrende Pro  MT4 is an extended version of the VTrende indicator. Difference between Pro version and VTrende: - Time zones - Signal V - signal 1-
Automatic, live & interactive picture of all trendlines. Assign push, email and sound alerts to the lines of your choice and be informed about price rollback, breakout, rollback after breakout, number of rollbacks, line expiration by double breakout. Correct, drag or delete the lines and interactively tune the line system. https://youtu.be/EJUo9pYiHFA . Chart examples https: //www.mql5.com/en/users/efficientforex Price Interaction Events All events are effective immediately and only after on
サポート と 抵抗レベルインジケーター( Support and resistance )をダウンロードできます。 インジケーターは、水平とトレンドのサポートと抵抗レベルを 表示します 。 インジケーター設定: トレンド( Trends ) トレンド又は水平のサポートと抵抗レベルの表示モード設定 はい( Yes )-トレンドレベルしか表示しない いいえ( No )- 水平 レベルしか表示しない リソース使用( UseResource ) インジケーターに組み込まれているリソースの使用モード設定。 はい( Yes )-商品リソースからのジグザグ( ZigZag )インジケーターを使用すること。 いいえ( No )-ジグザグ( ZigZag )ユーザーインジケーターを使用すること。 履歴バー( HistoryBar ) レベルが表示される履歴バーの数 バー数( CountBar ) 現在のバーを始め、サポートと 抵抗レベル が検索されるバーの数 商品で使用されている ジグザグ ( ZigZag ) インジケーターの設定 : デプス( Depth ) 前の値 より 偏差( Deviatio
The [GRAFF] III manual trading system is based on multiple MetaTrader (MT4) indicators. Together, the entire PACK of GRAFF III indicators makes an advanced trading tool. The system consists of over 20 different custom-built indicators which have been carefully selected and tested in the long term to produce strong and efficient trading signals. The particular indicators are based on different mathematical formulas, so the entire system is calibrated to remove false signals from its own indicator
This indicator allows you to see the strength of the trend on all timeframes. It can be used for all currency pairs. The indicator can be displayed in the form of a column (from left to right): status buy / sell / strong buy / strong sell, strength of the trend in percentage, pips last candle, body candle now, remaining time, and the timeframe of M1 to MN. Information contained below (from left to right): total trend percent, sell percent, buy percent.
You can fins our other products from link : https://www.mql5.com/en/users/drbastem/seller   Also, you can ask all your questins from email : haskayafx@gmail.com or mobile : +90 530 867 5076 or @MehmetBastem    on telegram application This indicator is used to determine the trend. Standard Osma indicator is used. It has the indicator warning system: beep, e-mail and has three types of alerts, including messages to mobile phone. It shows the best performance on the chart of 5 minutes. When the
You can fins our other products from link : https://www.mql5.com/en/users/drbastem/seller   Also, you can ask all your questins from email : haskayafx@gmail.com or mobile : +90 530 867 5076 or @MehmetBastem    on telegram application This indicator is used to determine the trend. Standard Three Moving Average and ADX indicators are used. It has the indicator warning system (audio, e-mail) and three types of alerts, including messages to mobile phone. It shows the best performance on M5. When
作者のその他のプロダクト
App system
Pierre Paul Amoussou
購入後、プライベートメッセージを送ってください! 単純移動平均線や指数移動平均線の信号、モメンタムの信号に基づいて設計された、Nasdaq 100、EURUSD、XAUUSDといった市場で動作する自動取引ロボット。ただし、金が最も好ましい市場です。このロボットは、これらの信号に基づいて売買注文を出し、取引市場に適した最小取引ロットを使用します。利益確定はトレーダー自身が設定し、柔軟性を高めます。ロボットはアメリカ市場の15分足でデイトレードするように設定されており、市場の動きに迅速に対応できます。また、スウィングトレードにも使用できます。取引日はトレーダーの希望に応じて設定できます。ストップロスは自動的に設定されますが、設定で調整することもできます。ロボットはリスク管理をしっかり行う必要があります。デモ版も利用可能です。購入者にインストールや使用方法を説明するために利用可能です。バックテストの結果はビデオやスクリーンショットで提供されます。このロボットは、金やEURUSD市場で6年間にわたってテストされたAPP SYSTEM戦略に基づくトレンドフォローイングロボットですが、最もおすす
MSnR Lines
Pierre Paul Amoussou
MSnR Lines は、サポートとレジスタンスの水準をチャート上に表示するカスタムインジケーターです。これらの水準は、マレーシアのSNR理論に基づいています。この理論では、水準は特定の価格水準を指し、エリアではありません。これらの価格水準は、ラインチャートのピークと谷に基づいています。 特徴: A-Level、V-Level、ギャップレベルの3つの種類の水準。 水準の新鮮さインジケータ:新鮮な水準は、未テストの水準や取引された水準よりも重要です。 新鮮な水準と新鮮でない水準の色とスタイルをカスタマイズ可能。 新鮮な水準のみを表示するか、すべての水準を表示するかを選択できます。 バックテスト期間と現在の価格上下の水準の数を調整可能。 複数のタイムフレームをサポート。 用途: トレーダーは、MSnR Linesを使用して潜在的なサポートとレジスタンスの水準を識別し、取引の意思決定を行うことができます。新鮮な水準はより重要であり、より良い取引機会を提供する可能性があります。また、異なるタイムフレームの水準を使用してマルチタイムフレーム分析を行い、取引の精度と信頼性を向上させることがで
フィルタ:
レビューなし
レビューに返信
バージョン 2.1 2024.04.14
アップデート入力信号を最適化
バージョン 2.0 2024.04.12
MetaQuotes ID経由の通知の統合: インジケーターは、MetaQuotes ID経由で生成されたシグナルの通知のみを送信するようになりました。