Trend Master Chart MT4
- インディケータ
- Frederic Jacques Collomb
- バージョン: 1.0
- アクティベーション: 5
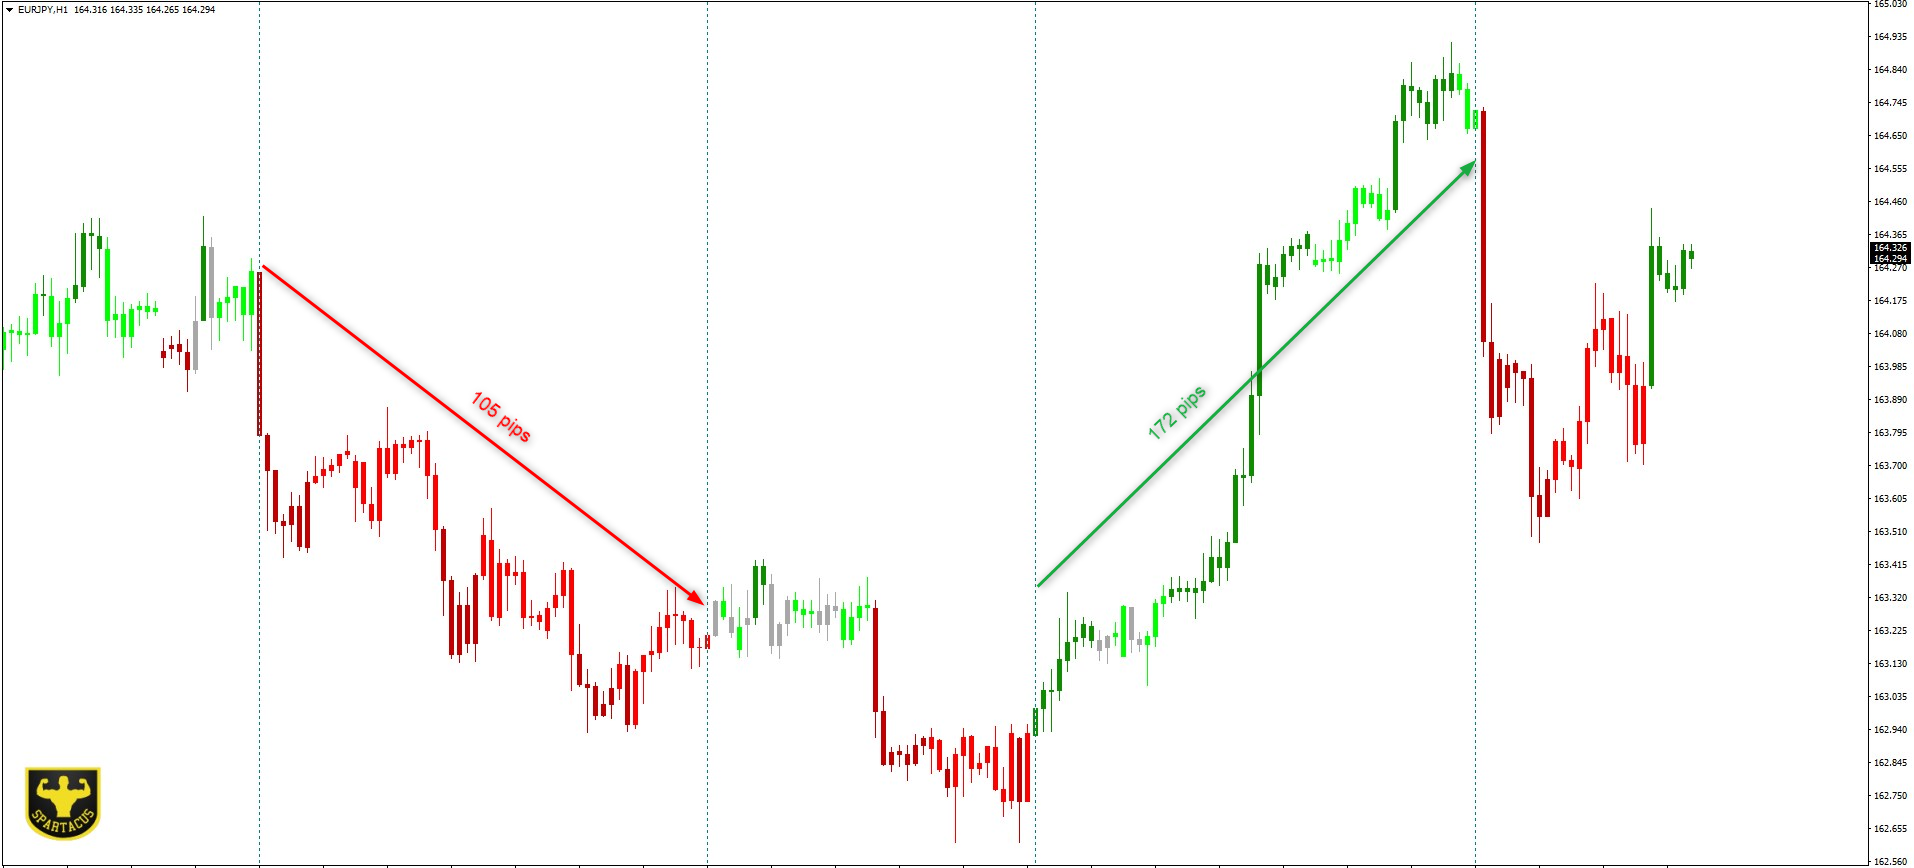
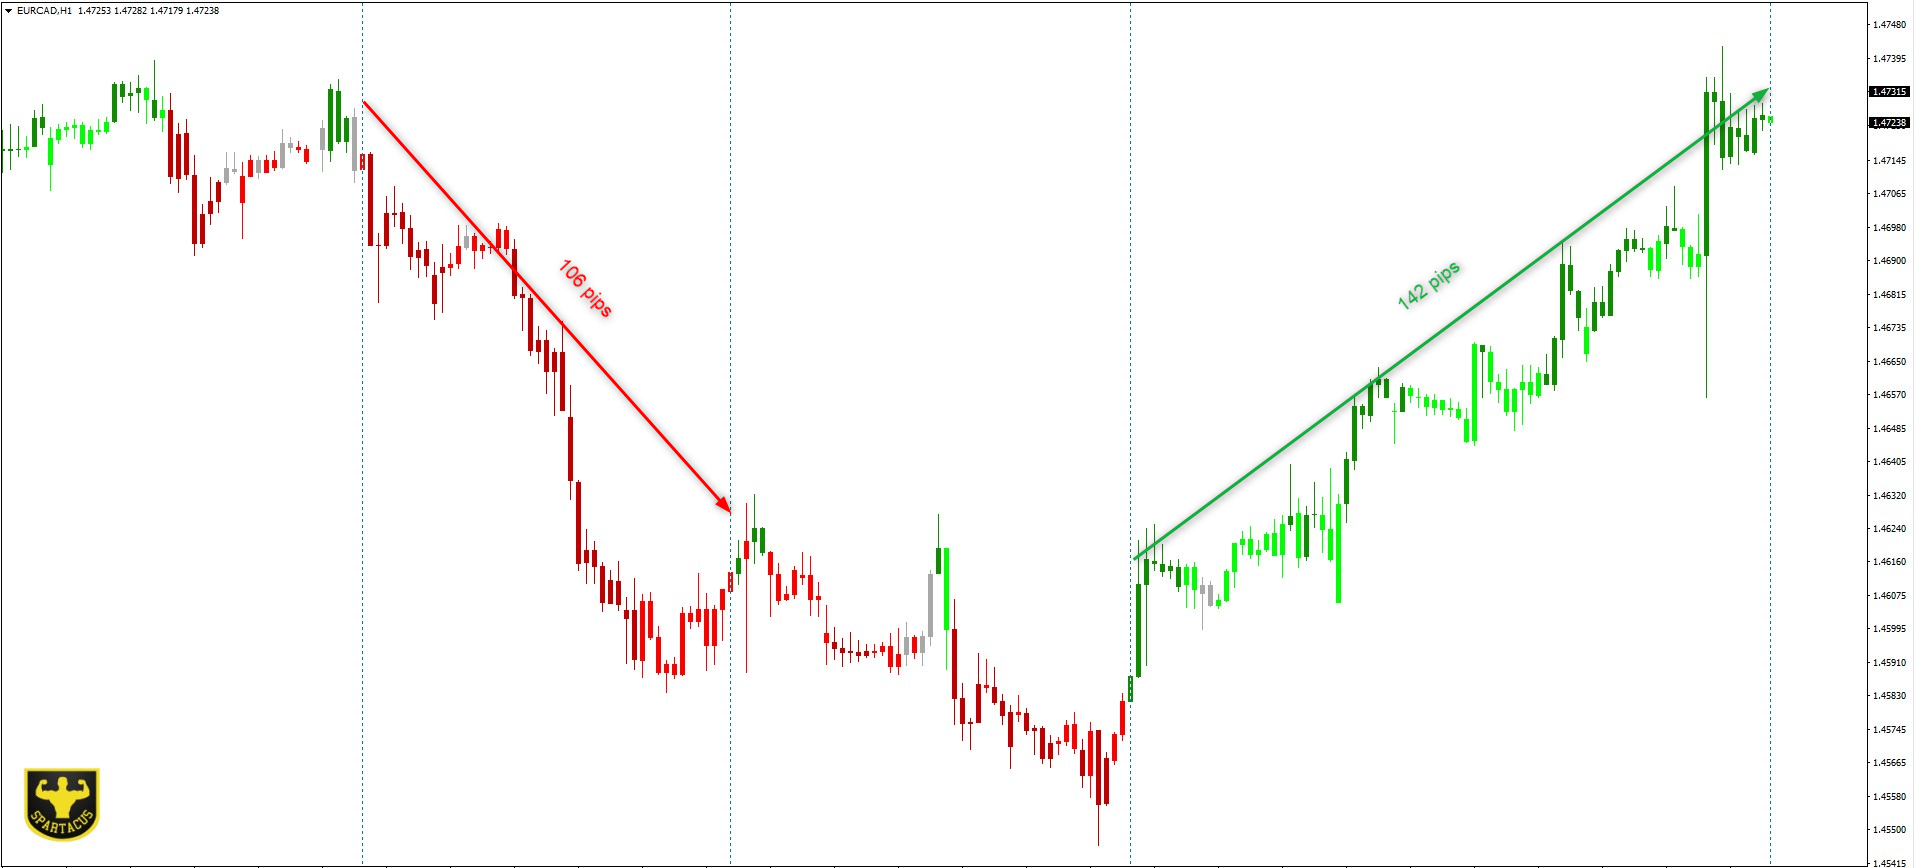
Trend Master Chart、必要なトレンド指標です。 チャートをオーバーレイし、色分けを使用してさまざまな市場のトレンド/動きを定義します。 2 つの移動平均と異なるオシレーターを組み合わせたアルゴリズムを使用します。 これら 3 つの要素の周期は変更可能です。 どの時間枠やペアでも機能します。
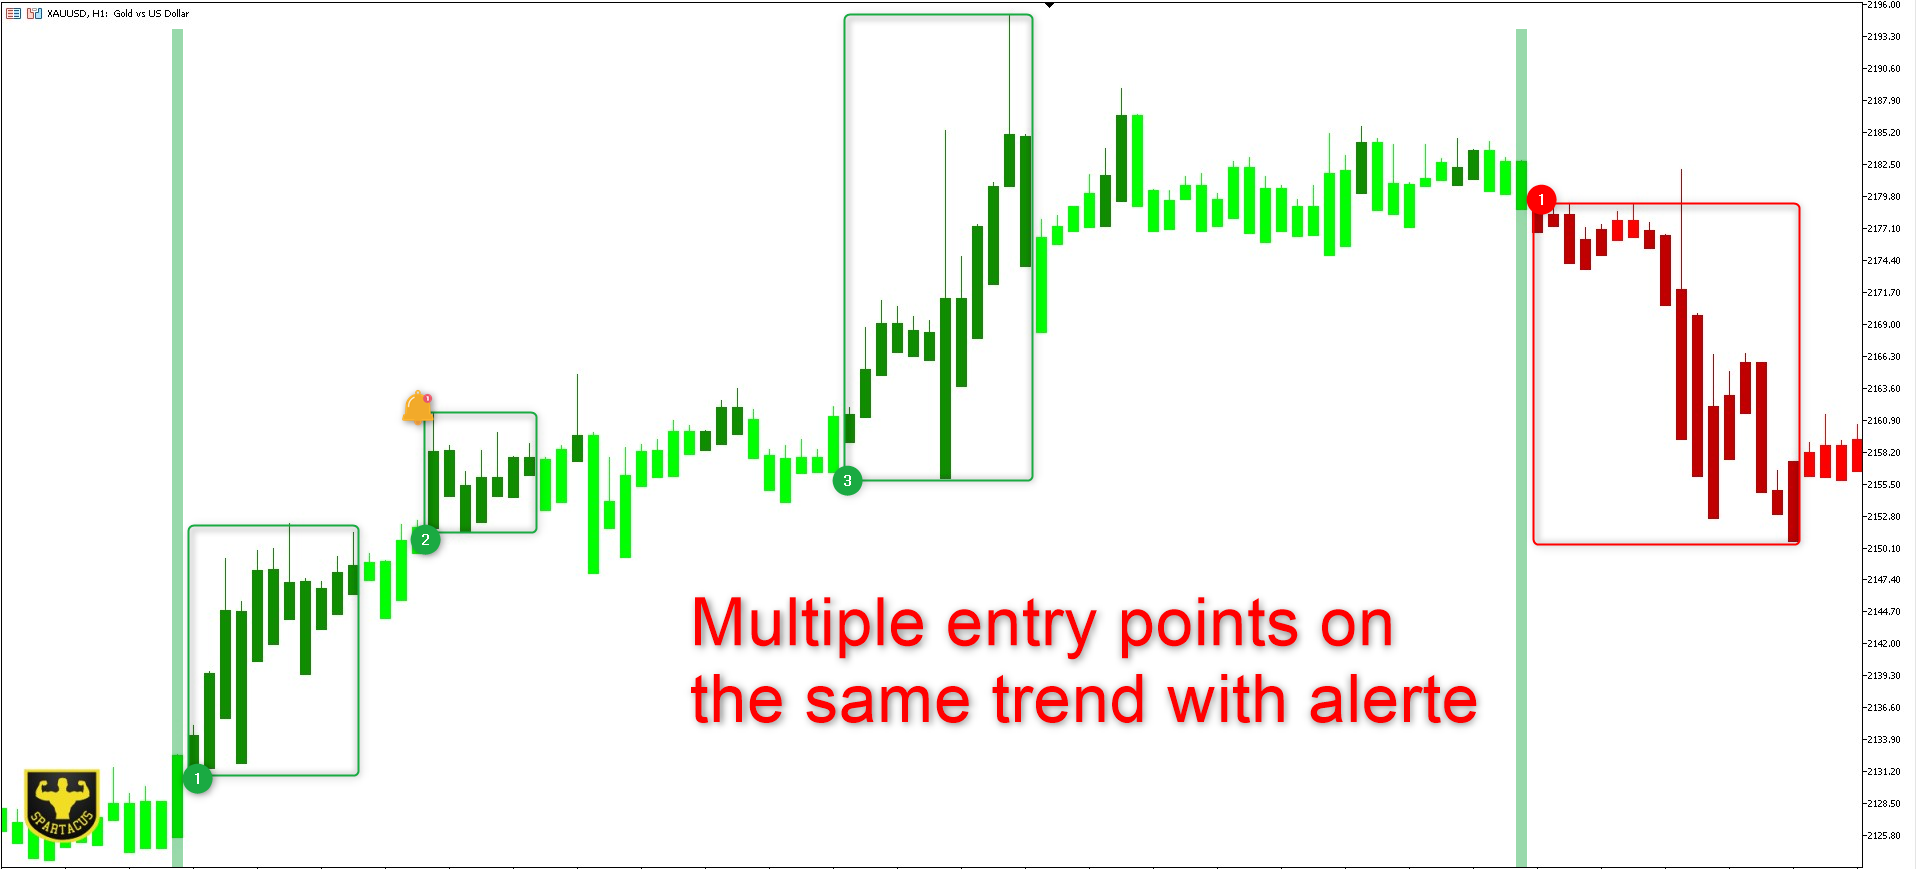
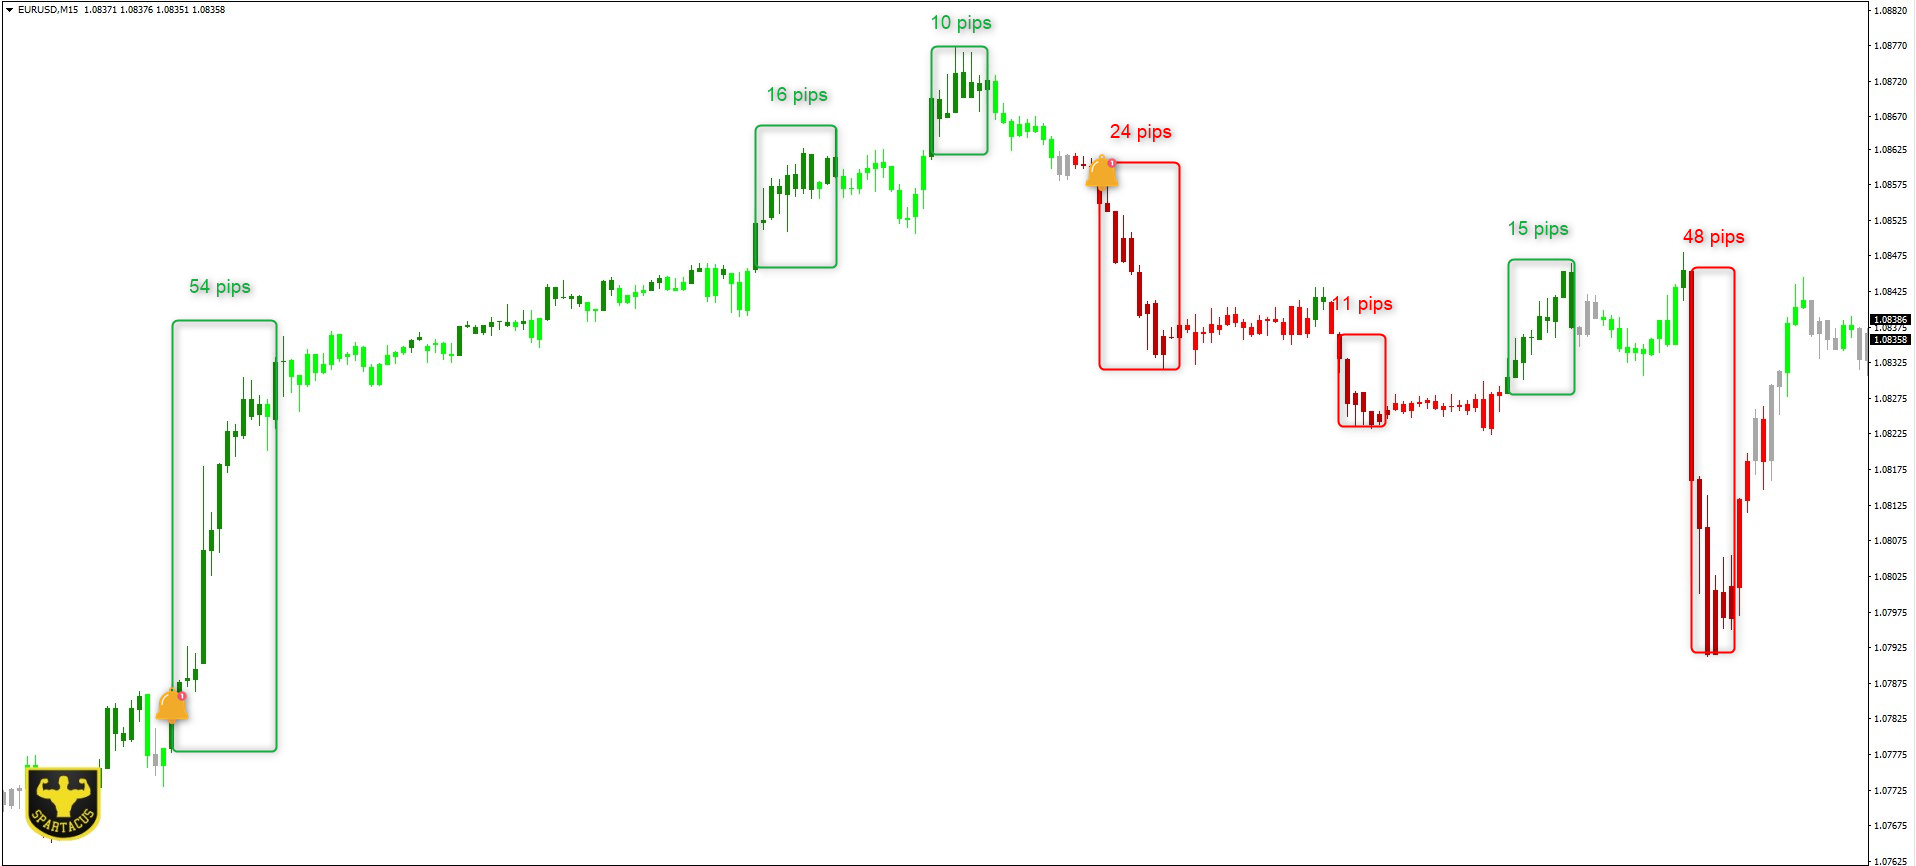
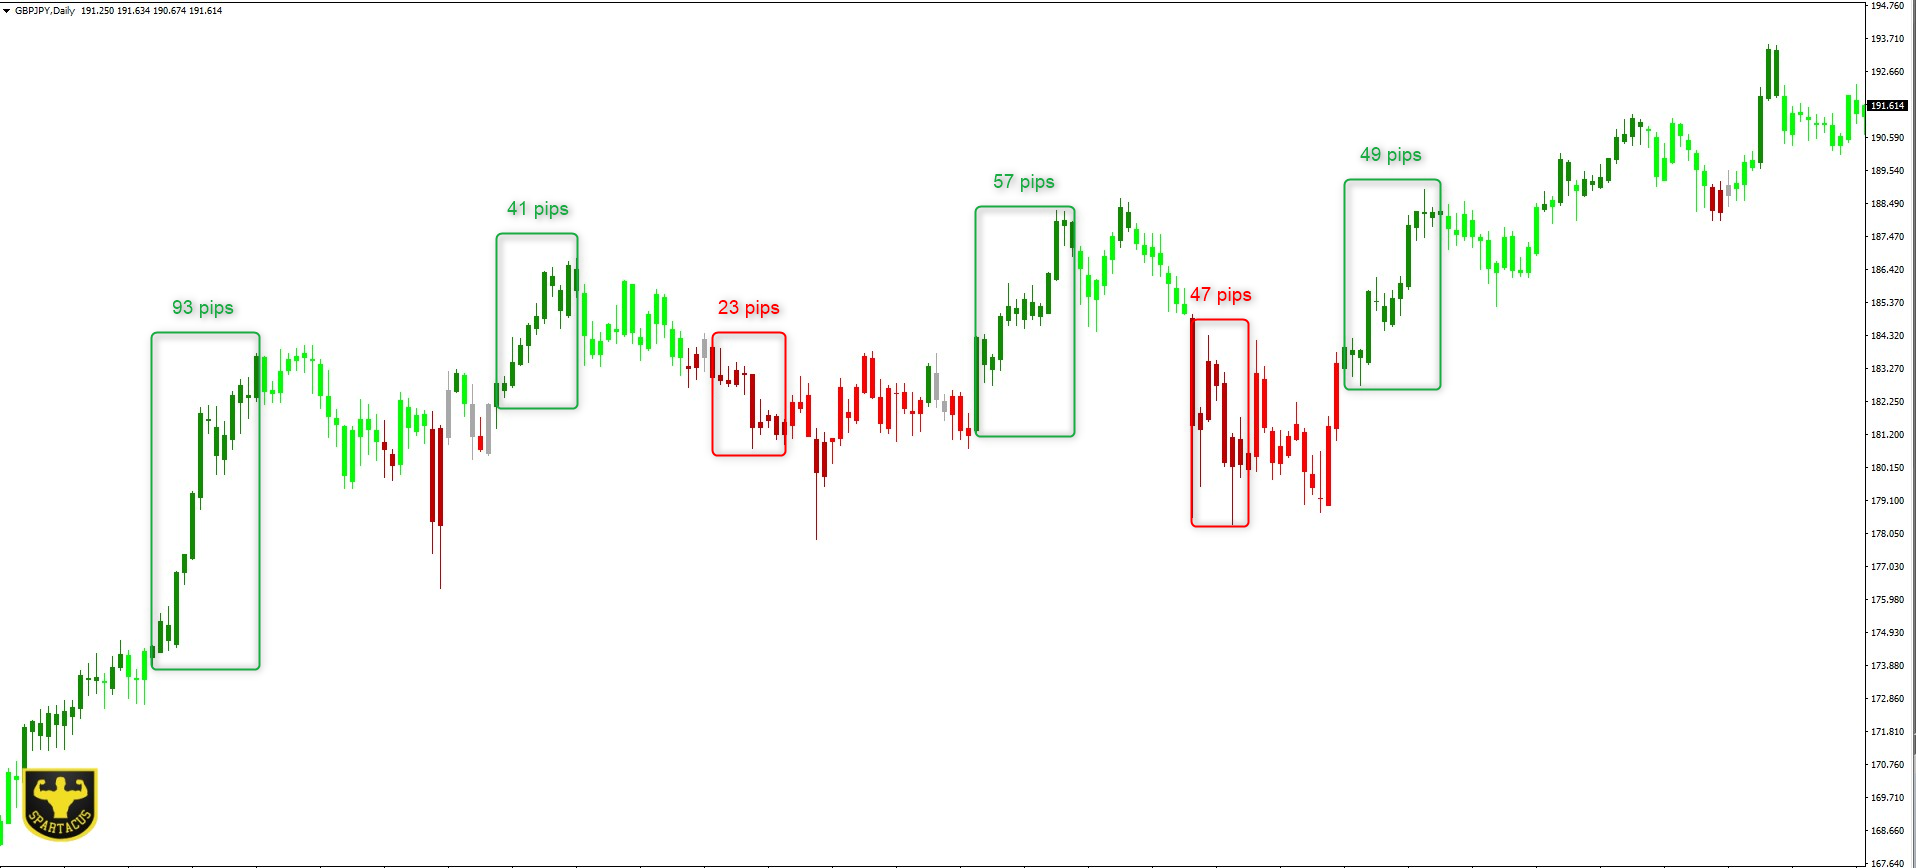
上昇トレンドまたは下降トレンド、およびこのトレンドへのさまざまなエントリーポイントを一目で識別できます。 たとえば、顕著な上昇トレンド (薄緑色) では、このトレンド内のさまざまな市場インパルスが濃い緑色のローソク足で表示されます。 設定可能なアラートを使用すると、これらの衝動を決して見逃すことがなくなります。
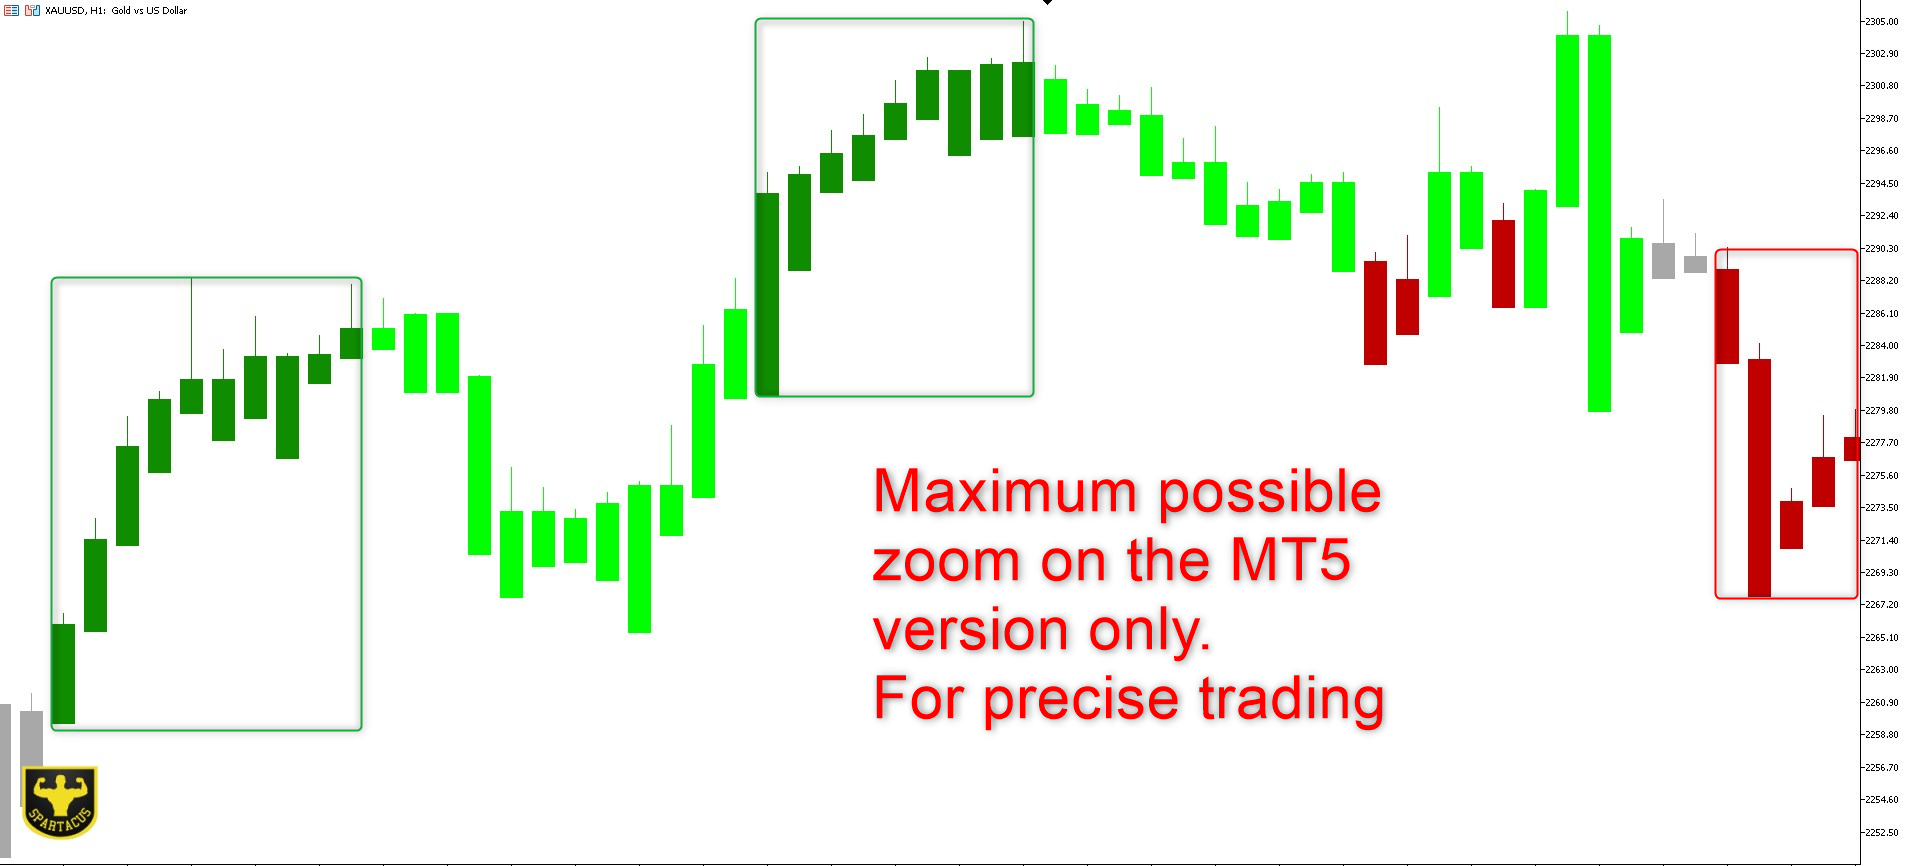
MT5のバージョンです。
入力パラメータ:
Period 1: 高速期間移動平均。
Period 2: 低速期間の移動平均。
Oscillator period: オシレーター周期。
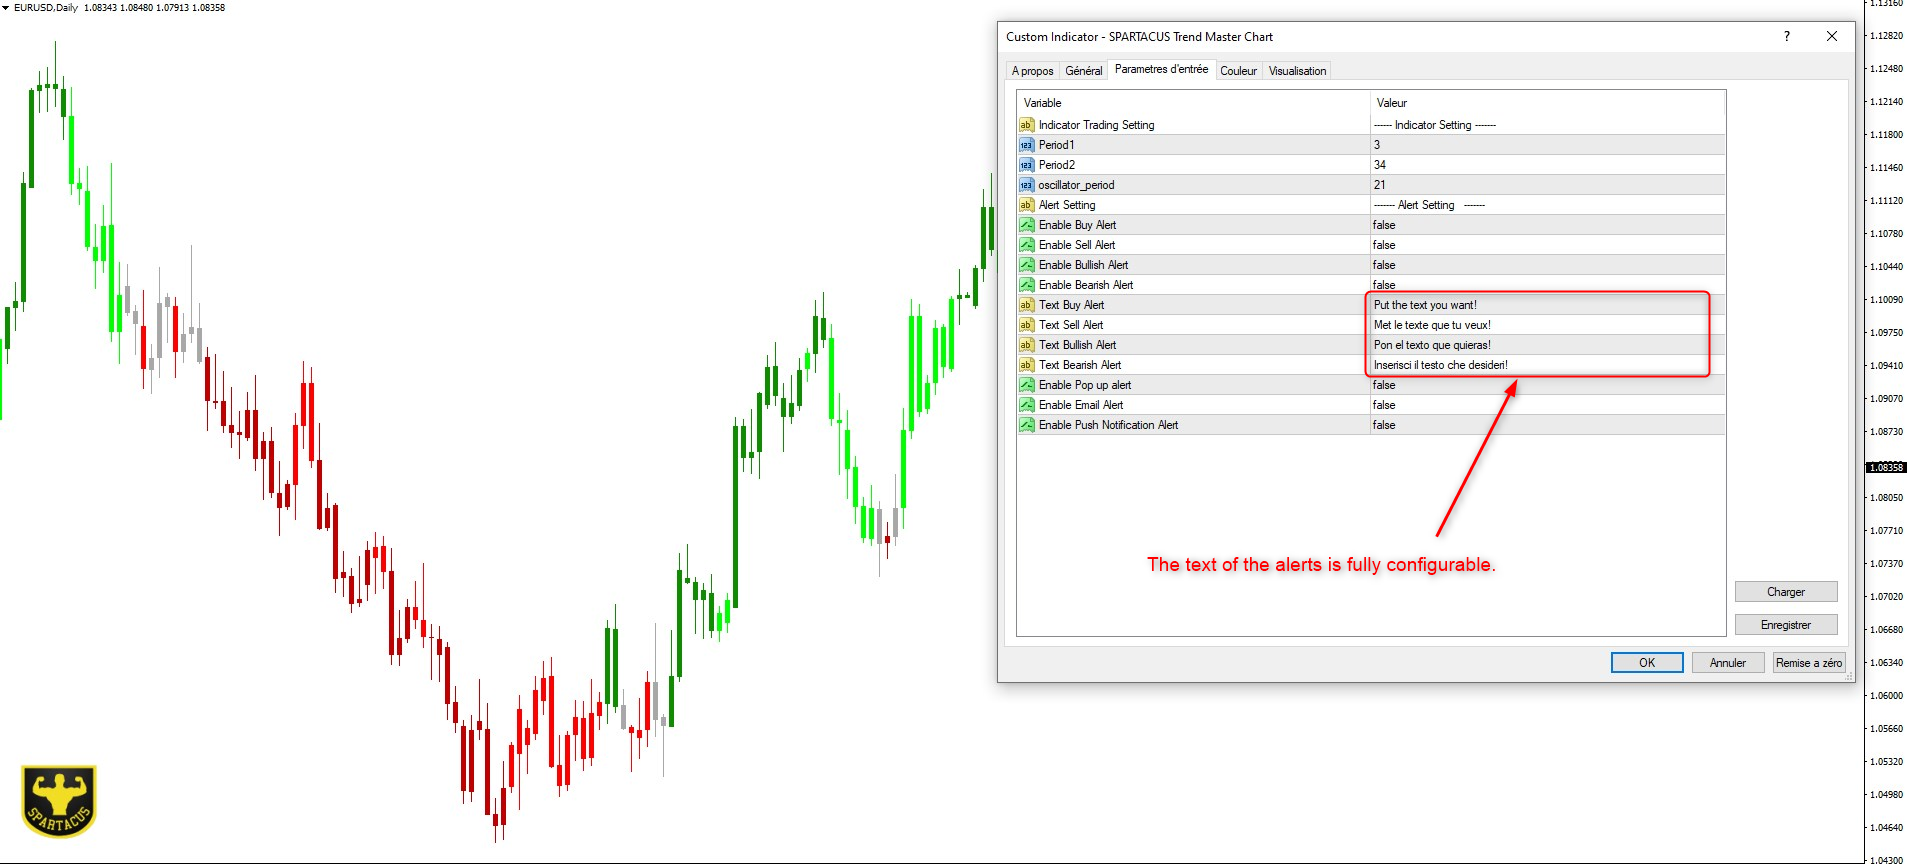
Sell/Buy alert: 市場衝動アラート、トレンドエントリーポイント。
Bullish/Bearish alert: トレンドが変化した場合のアラート。
ポップアップ/メールおよびプッシュ通知でアラートが可能。 完全に構成可能なアラート テキスト。
SPARTACUS©2024