• 概要
  • レビュー
  • コメント

Gann Price Level MT5

The indicator is designed to work on any trading platform. The program is based on proprietary algorithms and W.D.Ganna's mathematics, allowing you to calculate target levels of price movement based on three points with the highest degree of certainty. It is a great tool for stock trading. The indicator has three buttons: NEW - call up a triangle for calculation. DEL - delete the selected triangle. DELS - completely remove all constructions. The probability of achieving the goals is more than 80%. The indicator also has a signal in the form of an arrow to enter the market.


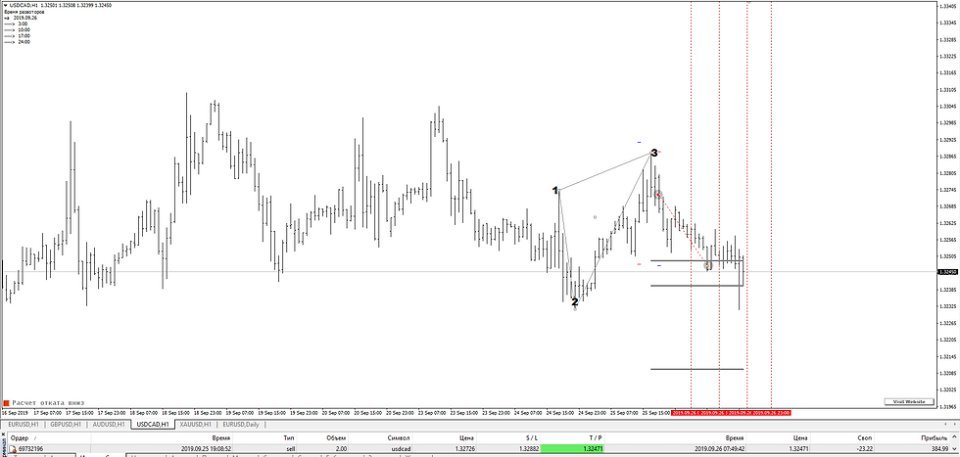
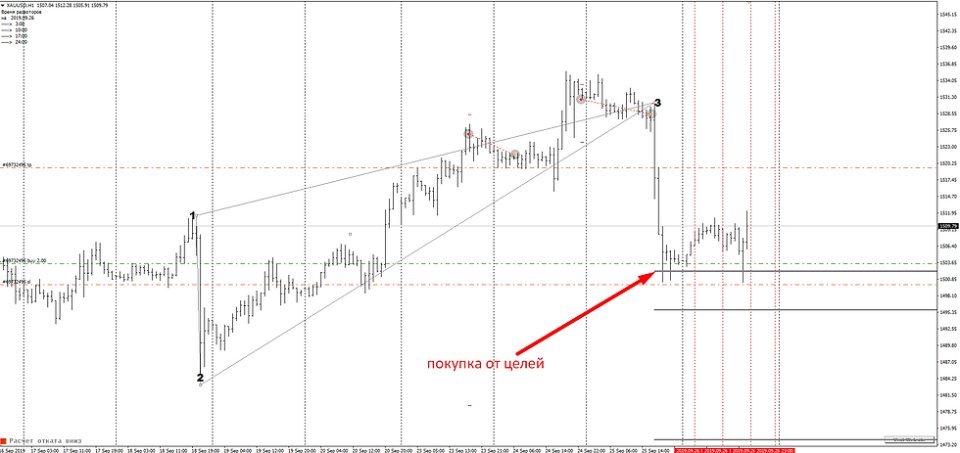
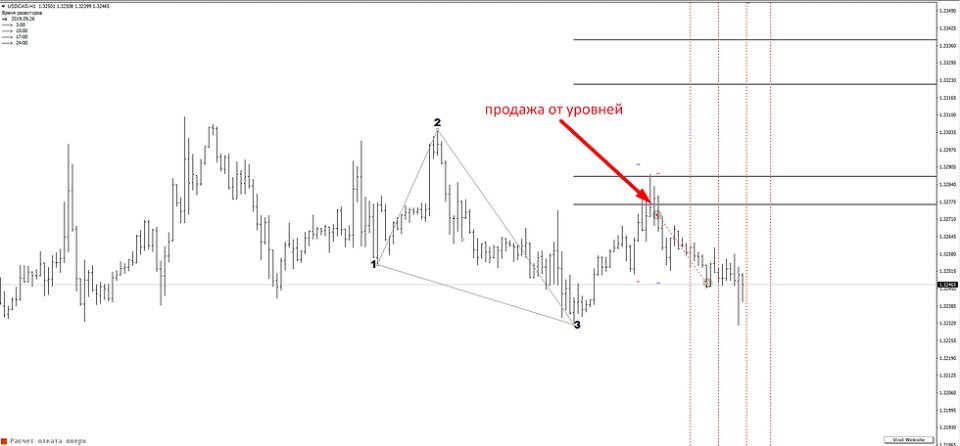
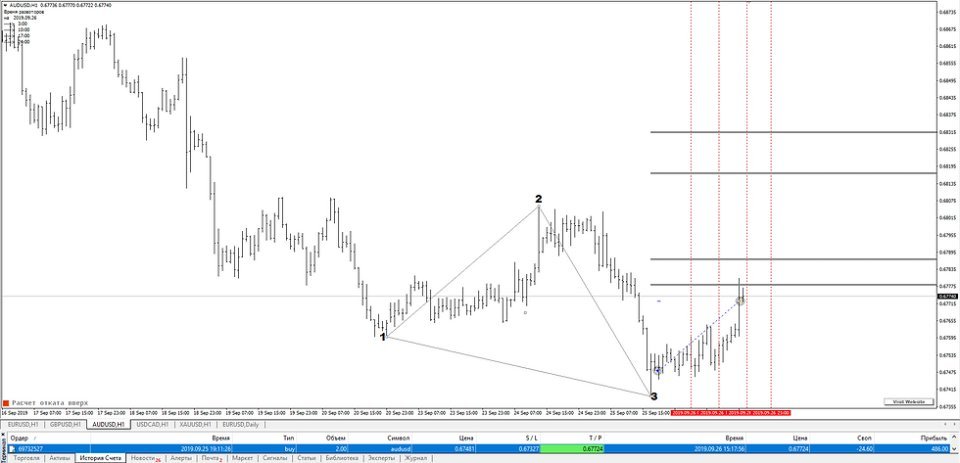
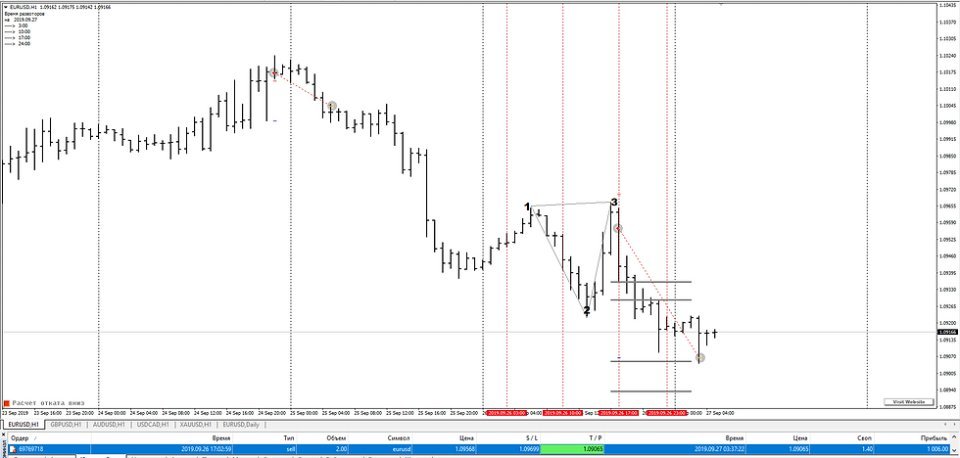
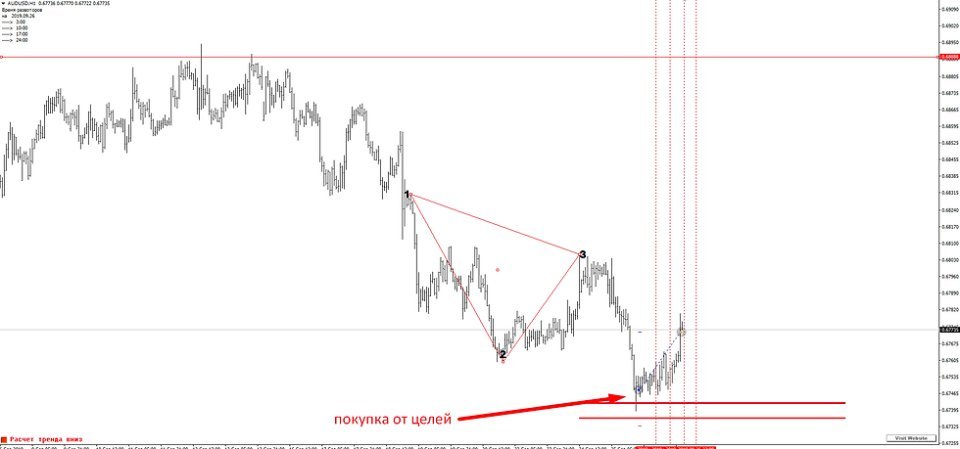
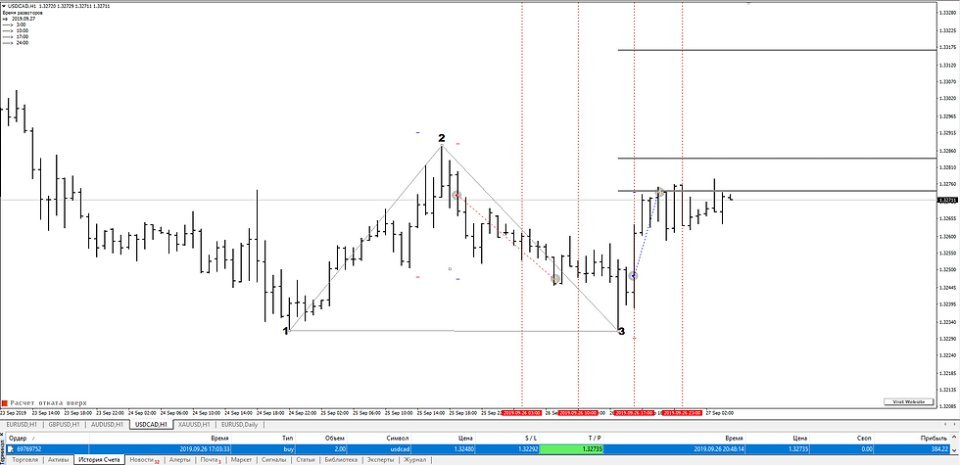
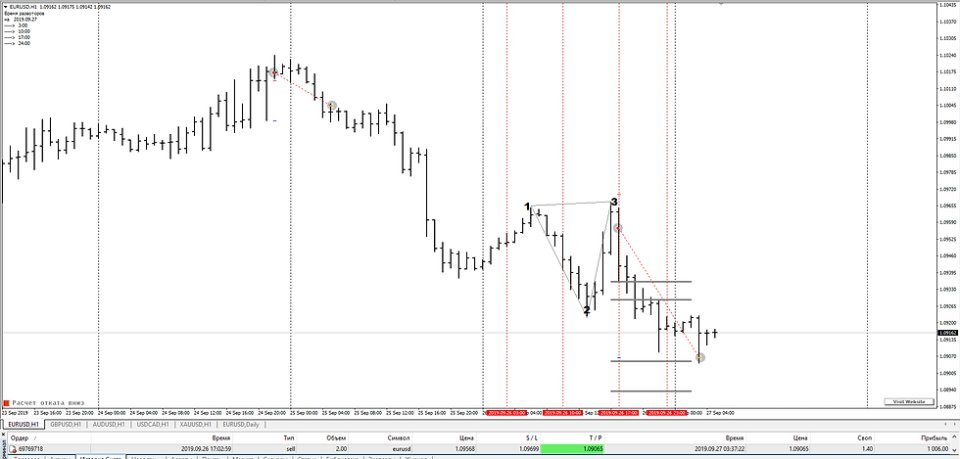
The indicator is intended for manual trading. To do this, click the NEW button. A triangle will appear. It needs to be placed at three points according to the Low-Hight-Low or Hight-Low-Hight model. Once you set the triangle, you immediately get target levels. Pressing the NEW button again will call up another triangle, which you can also place on the area of ​​the chart that interests you. The number of triangles is not limited. The DEL button deletes the manually selected triangle you need. First, select the triangle by double-clicking on it and pressing DEL. Only this triangle will be deleted. The DELS button will delete all triangles ever constructed. Switching the timeframe does not affect the construction in any way.

After purchasing, write to me for recommendations on how to get maximum profit from this indicator.

Version MT4


おすすめのプロダクト
Based on the trading model/strategy/system of gold double-position hedging and arbitrage launched by Goodtrade Brokers, problems encountered in daily operations: 1. Account B immediately places an order immediately following account A. 2: After account A places an order, account B will automatically copy the stop loss and take profit. 3: Account A closes the position of Account B and closes the position at the same time. 4: When account B closes the position, account A also closes the position.
Reverso 1.0 est un Indicateur Technique basé sur la tendance. Cet Indicateur intègre une formule exceptionnelle qui permet de décider au croisement du signal et du prix de clôture d'entrer dans le marché. Le timeframe indiqué est compris entre 2H et 1D. Les symboles que je conseille sont les suivants: BTCUSD-ETHUSD XAUGBP-XAUEUR-XAUAUD-XAGEUR-XAUUSD NZDJPY-GBPUSD-EURJPY-GBPJPY-USDJPY-CHFJPY-CADJPY-AUDJPY
Trend Direction ADX indicator Trend Direction ADX is part of a serie of indicators used to characterize market conditions. Almost any strategy only work under certain market conditions. Therefore it is important to be able to characterize market conditions at any time: trend direction, trend strength, volatility, etc.. Trend Direction ADX is an indicator to be used to characterize trend direction: trending up trending down ranging Trend Direction ADX is based on ADX standard indicator.
稼ぎと研究のためのツール。 トレーディングシグナルと戦略の中核は、価格予測パターンを形成するための著者のアルゴリズムに基づいています。どんな楽器にも使えます! MA「九尾の狐」に基づく制御システムが追加され、市場、機器、および作業期間に合わせて信号を可能な限り正確に更新および調整します。 対象:すべての市場のすべての商品(例外があります)。 対象者:ヘッジファンド、ファンドおよび資産運用会社、投資運用会社、投機家、投資家および利害関係者。 .................................................................................................................................................................................
Supply and Demand Monster
Tsog Erdene Borjigon Enkhkhudulmur
Supply and demand zones are at the heart of   supply and demand trading . These zones are areas that show  liquidity at a specific price.  The supply zone is also called the distribution zone, while the demand zone is called the accumulation zone.   Our indicator automatically draw supply and demand zones in Metatrader 5. It give opportunity to understand trading zone and avoiding risk.
Santa Scalping is a fully automated Expert Advisor with no use of martingale. Night scalping strategy. The SMA indicator filter are used for entries. This EA can be run from very small accounts. As small as 50 EUR. General Recommendations The minimum deposit is 50 USD,  default settings reccomend for eurusd m5 gmt +2 . Please use max spread 10 if you will not have orders change it to -1. Use a broker with good execution and with a spread of 2-5 points. A very fast VPS is required, preferably w
QuantXMarketScanner is a multi assets indicator for MT5 - Mathematical model based on 7 custom moving averages indicators  - Adaptable on Currencies, Stocks and Crypto - Automatic setup, self optimized About QuantXsystem Products: –         Simple installation & integration into MT5   –         Unlimited License after purchase (for one user) –         Automatic pattern recognition to identify the best timing and price levels. –         Trading indicators are displayed directly and automatica
Edge EA Pro MT5
Aleksandr Zheltikov
4.75 (4)
Edge is a fully automated trading system that finds trading opportunities and places trades by combining technical indicators, price action analysis, wave analysis and all-day market pattern analysis using Fibonacci areas. Based on historical market data, the system's thinly layered multilayer neural network is trained to identify patterns and relationships that can be used to predict future price movements. The neural network processes various inputs, including price data, technical indicators
Volatility Index Pro Indicator The Savia Forex Solutions Volatility Index Pro Indicator gives you highly accurate entries on all Volatility Indices and Jump Indices. The Volatility Index Pro Indicator is dynamic and powerful and is optimized for all timeframes. Trade with improved confidence and maximize your success rate. Benefits Dynamic and Powerful. Volatility Index Pro Indicator is fully optimized for all chart timeframes. Volatility Index Pro Indicator works with Volatility Indices and Jum
Gioteen Volatility Index (GVI) - your ultimate solution to overcoming market unpredictability and maximizing trading opportunities. This revolutionary indicator helps you in lowering your losing trades due to choppy market movements. The GVI is designed to measure market volatility, providing you with valuable insights to identify the most favorable trading prospects. Its intuitive interface consists of a dynamic red line representing the volatility index, accompanied by blue line that indicate
An invention that will turn your working principles upside down. Especially in horizontal and stagnant markets, annoying losses can occur. Besides, following trend lines, support and resistance can be tiring. To put an end to all this, I decided to create a professional "moving average" indicator. All you have to do is follow the colors. If you need additional support, I recommend the "Heiken-Ashi" candle indicator in my profile. I wish you lots of profit..
At first, I got my teeth into  Phoenix  Ultra   Expert Advisor. This   Expert Advisor  will support automatic close order if the direction is correct and perform recovery if the direction is wrong. If you enter an order: 1. The price goes in the right direction and hits the   Min Profit Point ,   trailing stop 20% of the current profit. 2. The price goes in the opposite direction, the Expert Advisor will place the order with the volume is   Recovery Volume Percent  at the input, the distance t
Bigull 24
Cristian David Castillo Arrieta
当社の自動システムでは、最大で26通貨ペアで円滑に作業するオプションが提供され、リスクを分散し、利益の機会をバランスよく最大化することができます。 当社の自動システムでは、賢明な投資方法だけでなく、成功への道のりのすべての段階であなたをサポートする味方を得ることができます。 飛行中のカモメと同じように、市場を優雅かつ正確に航行する方法を見つけてください。 26の利用可能な通貨ペア: GBPUSD EURCAD AUDJPY NZDCHF USDCHF EURGBP EURNZD GBPNZD CADCHF CHFJPY EURAUD USDCAD NZDUSD EURJPY GBPAUD GBPCAD AUDNZD AUDUSD GBPJPY NZDCAD CADJPY AUDCAD EURUSD AUDCHF XAGUSD XAUUSD 取引ごとに0.01ロットの取引を行うために、10,000米ドルまたはそのUSC(セント)相当の資本ベースで始めることをお勧めします。 この戦略は、口座内の利用可能な資本を過度に犠牲にすることなく、リスクをより効果的に分散する
Forex Relative Performance indicator This indicator calculates the relative strength of major currencies against the US dollar. The basic idea behind this indicator is "to buy strong currency and to sell weak currency". This indicator allows you to quickly identify the best forex pair to trade according to your trading style (Intraday, Scalping, Swing, or Long Term)
MT4版  |  FAQ Owl Smart Levels Indicator は、 Bill Williams の高度なフラクタル、市場の正しい波構造を構築する Valable ZigZag、エントリの正確なレベルをマークする Fibonacci レベルなどの一般的な市場分析ツールを含む 1 つのインジケーター内の完全な取引システムです。 利益を得るために市場と場所に。 戦略の詳細な説明 インジケータを操作するための指示 顧問-取引助手 プライベートユーザーチャット ->購入後に私に書いて、私はプライベートチャットにあなたを追加し、あなたはそこにすべてのボーナスをダウンロードすることができます 力はシンプルさにあります! Owl Smart Levels 取引システムは非常に使いやすいので、専門家にも、市場を勉強し始めて自分で取引戦略を選択し始めたばかりの人にも適しています。 戦略と指標に秘密の数式や計算方法が隠されているわけではなく、すべての戦略指標は公開されています。 Owl Smart Levels を使用すると、取引を開始するためのシグナルをすばやく確認し、注文を出すため
Renko Plus
Eadvisors Software Inc.
With Renko Plus you can use the features in the Indicator functionality, just add it to the Metatrader5 chart.             The Renko chart is a type of chart, developed by the Japanese, that is constructed using price movement rather than standardized prices and time intervals like most charts. It is believed to be named after the Japanese word for bricks, "renga", as the graphic looks like a series of bricks.             A new brick is created when the price moves a specified p
I want again that the wedge light on all the indicators did not converge. No matter how hard you search, you still will not find an indicator that will always and in all conditions give you exclusively profitable signals. As you can see, everything is quite simple, and you don’t even need to analyze anything, in fact. In general, I would say that the Signal No Problem indicator can be a great help for creating your own trading system. It goes without saying that you don’t need to trade only by a
FanTrader
Syed Oarasul Islam
FanTrader is designed to trade any markets (Stocks, Forex, Commodities, Futures, Cryptos). The strategies are developed based on various Price Actions that will be observed on different Fibonacci Fan Levels. Product Home Page:  https://www.mql5.com/en/market/product/51333 ADVANTAGES: Works on any market and time frames Multiple Strategies in 4 categories:  Retracement, Breakout, Trend Follow, Reversal Trades simultaneously on any number of markets under the same account  Display Fibonacci Fa
Alpha Striker SMC KING is unique Expert Advisor that continues the Alpha Striker series of  expert advisors. Innovative methods of the programme's approach to trading, and promising performance results are possible thanks to the use of modern technologies and methods. The Alpha Striker SMC KING is a fully automated EA designed to trade currencies only. Working pairs recommended EURUSD. Expert showed stable results on currencies in 2022-2024 period. No dangerous methods of money management used,
Big Player Range
Thalles Nascimento De Carvalho
5 (2)
「BigPlayerRange」インジケーターへようこそ。これは金融機関が市場で示す重要なエリアを特定するために開発されたテクニカル分析ツールです。このインジケーターは、主要な市場参加者が相当な活動と興味を示す価格範囲を正確に分析します。 主な特徴: 1. 金融機関の関心エリアのマッピング:「BigPlayerRange」は金融機関が強い活動を示すチャート上のエリアを正確に強調表示します。これらのポイントは戦略的に重要であり、市場の将来の動きについての洞察を提供します。 2. 出口の基準としてのプロジェクション:関心のあるエリアを特定するだけでなく、このインジケーターはプロジェクションを使用して可能な出口の基準としています。これらのプロジェクションは市場が将来どの方向に動くかに基づいて戦略を計画するのに役立ちます。 3. 識別された範囲に戻るときの引き戻しの確率:「BigPlayerRange」のユニークな機能の1つは、価格が関心のある範囲に戻ったときの引き戻しの確率を計算できることです。これは潜在的なトレンドの反転を評価するのに役立ちます。 「BigPl
Bitcoin Trading   My   Expert Advisor   trade Bitcoin on H1 time frame, Base on ADX indicator,  Bollinger Bands indicator, and follow the trend. stop loss 31 usd/0.01 bitcoin take profit 19 usd/0.01 bitcoin (0.01 lot) Min deposit: from 300 usd Profit: 100%/year. Draw Down: < 35% Input Setting to test my EA: - Lots: 0.01 - Stoploss: 31 usd/0.01 bitcoin or 3100 usd/bitcoin depend on your broker and your account ( adjust to the correct ratio and   do not change) - Takeprofit:    19 usd/0.01 bitcoin
革新的な MT5 インジケーター、DARWIN Assistant   をご紹介します。これは、トレーディングを成功させる世界への究極のゲートウェイです。精度と専門知識に基づいて設計された DARWIN Assistant   は、RSI、ストキャスティクス、CCI、トレンドなどの高度なテクニカル指標をすべての時間枠にわたって活用する特別な戦略に基づいて動作します。この最先端のインジケーターはエントリーのための最も正確なシグナルを提供し、比類のない自信を持って市場をナビゲートできるようにするため、並外れた取引体験に備えてください。 DARWIN Assistant   を使用すると、最も収益性の高い取引機会を検出するために細心の注意を払って調整された、重要な指標の包括的な分析にアクセスできるようになります。不確実性に別れを告げ、情報に基づいた意思決定の新時代を迎えましょう。 RSI、ストキャスティクス、CCI、トレンドを DARWIN Assistant   内でシームレスに統合することでその力を解き放ち、これまでにないほど市場のダイナミクスを鮮明に描きます。 DARWIN
スペシャルキャンドル 成功した一目均衡表戦略を持つ最高の外国為替指標の1つを使いたいですか?この一目均衡表戦略に基づく素晴らしいインジケーターを利用できます。 MT4バージョンはこちらです。 第1戦略: この戦略では、まれに発生する類似した強いクロスを特定することが含まれます。 この戦略に最適な時間枠は、30分(30M)および1時間(H1)です。 30分間隔の適切なシンボルには以下が含まれます: • CAD/JPY • CHF/JPY • USD/JPY • NZD/JPY • AUD/JPY • EUR/USD • EUR/GBP 1時間のタイムフレームに適したシンボルには以下が含まれます: • GBP/USD • GBP/NZD • GBP/AUD • USD/CAD • USD/CHF • USD/JPY • EUR/AUD 第2戦略: この戦略では、トレンドと同じ方向に発生した強力なTenkunsenおよびKijunsenのクロスを特定することが含まれます。 この戦略に最適な時間枠は、1分(1M)から15分(15M)です
NET Z uses a very well-known trend reversal technique to determine position entry with slight modifications by using virtual trade techniques and virtual pending orders so that position entry is not too early or too late. Why NETZ? NET Z does not require complicated settings and is easy to use because user only need to upload a set file that is already available. Currently there are set files for 20 fx pairs. The best GRID EA with the ability to control risks. I will share my personal daily r
Grid trading Strategy A very safe and profitable strategy based on dividing the chart to horizontal grids and based on market direction (Bullish/Bearish) open buy or sell when the price touches each grid line. Grid distance will be calculated based on percentage of price. That way this EA can be used for any type of market. trade a list of given pairs at the same time on a single account and apply risk management rule for all of them
Renko Graph   練行足グラフ 現在の価格の場所にあるメインチャートウィンドウの練行足インジケーター。 インディケータは、通常の相場チャートの背景に対して、長方形(「ブリック」)の形で価格変動を表示します。設定で指定されたポイント数による価格の上昇は、前の次の長方形の上に追加することによってマークされ、下向きの動きは前の長方形の下に追加されます。 インジケーターは、主なトレンドを視覚的に識別するように設計されています。根底にあるトレンドを平均化する際に、主要なサポートとレジスタンスのレベルを特定するために使用されます。このビューでは、小さな価格変動(「ノイズ」)は考慮されていないため、非常に重要な動きに集中できます。 価格変動が指定されたしきい値レベルを超えた場合にのみ、上または下の新しい指標値がプロットされます。サイズは設定で設定され、常に同じです。たとえば、基本サイズが10ポイントで、価格が20上昇した場合、2つのインジケーター値が作成されます。 インジケーターの利点は、どのレンガでもその形成時間の長さを示すことができることです。価格が範囲内で変動し、成長せず、しきい値の
The "Deviation Scaled Moving Average Crosses" indicator is a powerful technical analysis tool designed for the MetaTrader 5 trading platform. It facilitates informed trading decisions by visually presenting the interaction between two moving averages, both of which are smoothed and scaled to offer enhanced insights into market trends. This custom indicator is developed by mladen and is copyright-protected for the year 2023. Using a unique approach, the indicator displays two types of deviatio
Matreshka
Dimitr Trifonov
5 (1)
Matreshka self-testing and self-optimizing indicator: 1. Is an interpretation of the Elliott Wave Analysis Theory. 2. Based on the principle of the indicator type ZigZag, and the waves are based on the principle of interpretation of the theory of DeMark. 3. Filters waves in length and height. 4. Draws up to six levels of ZigZag at the same time, tracking waves of different orders. 5. Marks Pulsed and Recoil Waves. 6. Draws arrows to open positions 7. Draws three channels. 8. Notes support and re
OrderFlowWay
Jean Jacques Huve Ribeiro
Indicator tested for 7 years with excellent results when used correctly An order flow tracking indicator when used at support and residence points simply shows the direction of the Big Players, validating good opportunities seek optimal risk-adjusted returns on their investments. Use when Flow line crossing at signal line after candle closed , works with absolutely everything
This is an Expert Advisor created based on trend analysis, both bull and bear trends With accurate trend analysis, it helps you to trade with the trendline system With a scalping strategy, you don't need to worry when trading forex Recommended Settings: - 1000usd for 1 forex pair -1000 usd for 0.01 lot or 0.1% risk - Timeframe M15 and Higher M15 mql5 live :  https://www.mql5.com/en/signals/2161359 H1 mql5 live :  https://www.mql5.com/en/signals/2221408
このプロダクトを購入した人は以下も購入しています
note: this indicator is for METATRADER4, if you want the version for METATRADER5 this is the link:  https://www.mql5.com/it/market/product/108106 TRENDMAESTRO recognizes a new TREND in the bud, he never makes mistakes. The certainty of identifying a new TREND is priceless. DESCRIPTION TRENDMAESTRO identifies a new TREND in the bud, this indicator examines the volatility, volumes and momentum to identify the moment in which there is an explosion of one or more of these data and therefore the mome
VTrende Pro
Andrii Diachenko
5 (1)
VTrende Pro - MTF indicator for trend trading with a display panel for MT5 *** Videos can be translated into any language using subtitles (video language - Russian) Although the signals of the VTrende Pro indicator can be used as signals of a full-fledged trading system, it is recommended to use them in conjunction with the Bill Williams TS. VTrende Pro is an extended version of the VTrende indicator. Difference between Pro version and VTrende: - Time zones - Signal V - signal 1-2 waves
IVISTscalp5
Vadym Zhukovskyi
5 (3)
iVISTscalp5インジケーターをご紹介します。このインジケーターは、トレーディングにおいて独自でありながら効果的です。時間データに基づくこのインジケーターは、多年にわたる経験と金融市場の深い分析の結果です。iVISTscalp5インジケーターは、手動トレーディングにとって優れたツールです。便利さ、簡単さ、可視化 - すべての複雑さが内部に隠されています。私たちは、iVISTscalp5インジケーターの設定と使用を最大限に簡素化しました。このインジケーターは、MT5ターミナルにあるすべての金融商品に適しています。 稼働時間は、4時から20時(UTC+3)です。 iVISTscalp5インジケーターメニュー(スクリーンショット1を参照): History - 引用を計算する週数 dT_min - 時間間隔の選択(分) TFline - 水平ボリュームの作成(時間枠) BARSline - 水平ボリュームの作成(バー数) TFtrend1 - デイリーチャンネルの作成(時間枠) BARStrend1 - デイリーチャンネルの作成(バー数) TFtrend2 - 週次チャンネルの作成(時
Weis Wave with Alert MT5
Trade The Volume Waves Single Member P.C.
4.93 (15)
Rental/Lifetime Package Options and Privileges  * For optimum results the yearly or lifetime package is suggested due to live training ! Rent Monthly Six Months   Yearly/Lifetime Weis Wave with Speed with Alert+Speed Index x x x Manual  x x x Quick Set up Video x x x Blog x x x Lifetime Updates x x x Setup and Training Material x x Free Rectangle Break Alert Tool      x Discord Access Channel "The SI traders" x 2-hour live methodology training x How to trade with it:    http://
RAD CRITICAL LEVES RAD indicator tracks “Relevant Volume” in real time, identifying accumulation and distribution processes, projecting them in the chart as SUPPORT or RESISTANCE zones. Natural   support   and resistance levels are generated by Volume Accumulation and Distribution processes. As these processes evolve, levels at which the relevant volume in the market place is positioned, become difficult areas to cross upwards or downwards. By using this information, traders can identify very s
バイナリ オプションの可能なコールおよびプット エントリを生成する人工知能に基づくインジケーター。 このインジケーターは 3 つの異なる戦略で機能します。 1) 出来高を読み取ることで、価格が反転する時期にシグナルを送信します。 2) 価格と出来高の乖離を通じて、トレンドが継続するか反転するかを知らせます。 3) 価格と出来高の収束を通じて、トレンドが継続すべき時期にシグナルを送信します。 この指標はすべての時間枠で機能しますが、最良の結果は 3 分または 5 分の期限で得られます (制度的な攻撃は短い時間枠で見られるため)。 最も流動性の高い時間帯、つまりグリニッジ標準時 7 時からグリニッジ標準時 18 時までが最適です。 このインジケーターは正しいシグナルの 70% 以上を生成しますが、価格を操作する機関同士の争いに遭遇したり、相互に拒否したりして、一連の誤ったシグナルが生成される可能性があります。そのため、適切な資金管理を使用することをお勧めします (Masaniello の例) )
The indicator is designed to close positions on the market in time. For example: to take profits ahead of schedule if the price has not reached TakeProfit, and the market is turning around. The indicator analyzes the momentum, not the trend. He does not give any information about the trend. The indicator is well suited for finding divergence. The Ershov 38 Parrots indicator dynamically adjusts to the market and detects price movement impulses of medium and high amplitude. It almost does not rea
Tatino Super Signals is Non Repaint Indicator for Binary Option trading and Forex trading. Recommendations: Timeframe: All timeframes. For best results we recommend using it on M1, M5 and M15 timeframes. Currency pairs: All Pairs Account type: All Type Broker time: Any Brokers : Alls Binary Trading : Expired 1 Candle Buffer Buy=1, Sell=0, Entry Next Candle Recommended Forex trading stop loss : 15 pips Recommended  Forex tradingTake profit levels : 15 pips Specifications: Does not repaint  
The Smooth Price technical indicator is used for plotting a smoothed line as close to the price of the financial instrument as possible, and serves to eliminate its noise components. The indicator is part of the Monarch trading system, but here it is presented as an independent technical analysis tool. The indicator is based on the cluster digital filter , which, unlike the ClusterSMA , is applied directly to the price time series. Smooth Price does not redraw (except the very last, zero bar) an
Teniendo una entrada de precios suavizados, los cuales son procesador por un ZigZag en tiempo real, dando como resultado un suavizador ajustado a un ZigZag. Con valores de entrada (periodo) mayores se vuelve un poco lenta en M1,, Ideal para H1, H4, D1 Trabaja bien con otros suavizadores, ya que su intersección es ideal Al iniciar empiza con mayor precisión desde el momento de activación, siendo el historial (anterior) de referencia ----------------------------------------------------------------
Super Suavizador
Cesar Juan Flores Navarro
Indicador en MQL5 que obtiene el promedio de 10 EMAS que son alineadas y procesadas según Fibonacci luego el promedio es suavizado"  Se ingresa un número de 2 a N que multiplica los EMA-Fibonacci y por consiguiente aumenta los fibonacci, resultando un promedio.   Se ingresa un número que suaviza los EMA-Fibonacci. Considerando los números 1/1 seria la suavización minima. Considerando los números 3/5 seria la suavización media. Considerando los números 10/30 seria la suavización alta.....etc
Entry Pro
Bartlomiej Tadeusz Tomaja
Entry Pro Indicator is a powerful multi-functional trading tool designed to increase your market entry accuracy. It combines the power of several key market trend indicators, including ATR Trailing Stop and both fast and slow EMA, to provide comprehensive market insight. It offers easy-to-interpret market entry signals represented by colored arrows. Also, it's fully customizable, allowing you to adjust ATR and EMA periods to suit your trading strategy. Trend filters and alerts can be toggled on
A scalping indicator based on mathematical patterns, which on average gives signals with relatively small SL, and also occasionally helps to catch big moves in the markets (more information in the video) This indicator has three main types of notifications: The first type warns of a possible/upcoming signal on the next bar The second type indicates the presence of a ready signal to enter the market/open a position The third type is for SL and TP levels - you will be notified every time price r
Классификатор силы тренда. Показания на истории не меняет. Изменяется классификация только незакрытого бара. По идее подобен полной системе ASCTrend, сигнальный модуль которой, точнее его аппроксимация в несколько "урезанном" виде, есть в свободном доступе, а также в терминале как сигнальный индикатор SilverTrend . Точной копией системы ASCTrend не является. Работает на всех инструментах и всех временных диапазонах. Индикатор использует несколько некоррелируемых между собой алгоритмов для класси
The SmartTrendMt5 trend indicator generates signals based on the principle of combined analysis of calculated reference points within the Keltner channel. The indicator plots the Keltner channel in a separate window (by default, red lines and a blue line - the middle of the channel), and also draws the histogram of calculated reference points for each candle (by default, the histogram bars are yellow). The should be attached to a chart of any timeframe and any trading symbol in the usual way.
プレミアムレベルは、正しい予測の精度が80%を超える独自の指標です。 この指標は、最高のトレーディングスペシャリストによって2か月以上テストされています。 あなたが他のどこにも見つけられない作者の指標! スクリーンショットから、このツールの正確さを自分で確認できます。 1は、1キャンドルの有効期限を持つバイナリーオプションの取引に最適です。 2はすべての通貨ペア、株式、商品、暗号通貨で機能します 手順: 赤い矢印が表示されたらすぐにダウントレードを開き、青い矢印が表示されたら閉じます。青い矢印の後に開くこともできます。 試してテストしてください!推奨設定はデフォルトです! 日足チャートで最高の精度を示します! インディケータは、2600 Pipsの収益性に対して、約10Pipsという非常に小さなマージンを使用します。
Indicador en base a la pendiente de la linea de precio, dibuja una línea de color cuando sube a base de los precios que previamente has sido procesados o linealizados, y cuando baja la pendiente la linea linealizada toma otro color. En este caso se a considerado 6 lineas de diferentes procesos desde pendientes largas hacia las cortas, observándose que cuando coincidan las pendientes se produce un máximo o mínimo, lo que a simple vista nos permitirá hacer una COMPRA O VENTA.
Индикатор Coefficient Of Determination (COD) представляет собой значение коэффициента детерминации или квадрат коэффициента корреляции между зависимой переменной — ценой и объясняющей переменной — тиковым объемом. Что это дает нам на практике? COD отлично распознает кульминацию трендовых движений, что позволяет подбирать оптимальные точки и ловить развороты рынка. Как использовать индикатор: Наиболее популярная торговая стратегия строится совместно с трендовым индикатором Moving Average (MA), пе
Fibonacci Múltiple 12, utiliza la serie fibonacci plasmado en el indicador fibonacci, aumentadolo 12 veces según su secuencia. El indicador fibonacci normalmente muestra una vez, el presente indicador se mostrara 12 veces empezando el numero que le indique siguiendo la secuencia. Se puede utilizar para ver la tendencia en periodos cortos y largos, de minutos a meses, solo aumentado el numero MULTIPLICA.
Recommended TimeFrame >= H1. 100% Non Repainted at any moment.  Use it carefully, only with Trend Direction. Trading Usage: 2 Variants: as Range System or as BreakOut System (Both Only With Trend Direction)::: (Always use StopLoss for minimise Risk); [1] as Range System: (Recommended) in UP TREND:  - BUY in Blue Line , then if price goes down by 50 points (on H1) open Second BUY.   Close in any Profit you wish: TrailingStop(45 points) or Close when Price touches upper Gold Line. in DOWN TR
En base a cálculos matemáticos de determino una linea Horizontal que cruza a todas las señales de trading, mostrando los máximos y mínimos. La linea horizontal parte en dos las subidas y bajadas de las señales de trading, de tan manera que es fácil identificar los máximos y mínimos, y es inteligente por que es sensible a las subidas y bajadas, afín de no quedarse en un solo lado por siempre, trabaja excelentemente con otros indicadores suavizadores ya que les garantiza que en un intervalo de tie
this indicator is a Spike detector indicator, it is specially designed to trade Boom 1000, Boom 500, Crash 1000 and Crash 500 We recommend using it on Deriv Boom and Crash indices only Its setting is intuitive, familiar, easy to use it has notification functions; audible notifications and push notifications. this tool is simple to use, easy to handle This update is based on different strategies for spikes
Limitless MT5 is a universal indicator suitable for every beginner and experienced trader. works on all currency pairs, cryptocurrencies, raw stocks Limitless MT5 - already configured and does not require additional configuration And now the main thing Why Limitless MT5? 1 complete lack of redrawing 2 two years of testing by the best specialists in trading 3 the accuracy of correct signals exceeds 80% 4 performed well in trading during news releases Trading rules 1 buy signa
Indicador en MQL5, recibe la información del precio SUAVIZADO, lo procesa anulando los picos inteligentemente, y el resultado lo envía al desarrollo de la escalera que iniciara y subirá o bajara según el peldaño o INTERVALO ingresado Ingreso PERIODO = 50 (variar segun uso) Ingreso MULTIPLICA AL PERIODO = 1 (variar segun uso) Segun la configuración la escalera puede pegarse o separarse de los precios,, Se aplica toda la linea de tiempo, y a todas las divisas, etc.  
Indicador en MQL5, que obtiene el promedio de 10 EMAS, que son alineadas según Fibonacci, obteniendo un promedio, que sera suavizado.  Se puede ingresar un numero desde 2 a N, que multiplica a los EMA-Fibonacci. Funciona en cualquier criptomoneda, etc. etc... pudiendo calcular el futuro segun la tendencia de las EMAS. Funciona excelentemente en tramos largos, determinando exactamente el mejor inicio/salida. El precio inicial por apertura sera por un periodo de tiempo, luego aumentará.
Micro  ******************* Секундные графики MT5 ********************** Более точного инструмента для входа в сделку вы не найдёте. Входные параметры: Timeframe, sek - период построения графика, секунды Displayed bars - отображаемые бары Step of price levels, pp, 0-off - шаг отрисовки ценовых уровней, пункты Scale points per bar, 0-off - масштаб в пунктах на бар Show lines - отображение текущих уровней Show comment - отображение комментария Standard color scheme - стандартная цветовая сх
QuantXSTocks Trading Range Indicator for MT5: INSTRUCTIONS TO USE OUR INDICATOR:- User needs to take trade on Arrow or after an Arrow CandleStick, You can achieve up-to 35-125 pips target by this Indicator. Best Timeframes for Stocks and Indices are M30 and H1: AMAZON M30 (50 pips) TESLA M30 (50 pips) APPLE M30 (50 pips) ADOBE M30 (50 pips) NASDAQ100 H1 (125 pips) The above are the approximate amount of pips you can achieve by this Indicator, Green arrow appears to be buy arrow while the Red a
Trend and Signals MT5  indicator scans  30 trading Instruments (Forex, Metals and Indices).     It uses special algorithm on the  current market   based on   Pure Price Action   and display the overall trend and signal on the dashboard. When signals are produced the indicator sends alert and notification. Strategy for Signals This indicator uses the daily timeframe to determine the direction of the trend. The hourly timeframe is used to identify possible entries. Main trend and is determined by
This indicator is based on a mathematical formula and an ANN combined, designed to make a model(using previous prices) of the most recent market condition (any chart*) in order to use the model as a forecasting tool. *This indicator can operate on any chart/timeframe, but it's suggested you use multiple timeframes for each trade because this method relies solely on the time factor, you can not use this indicator to predict price volatility, but if it's fit correctly it will show you when the nex
Big promotion on the Robos, Get yours now Robos Indicator The   ROBOS   indicator is a multi timeframe oscillator that targets the   overbought   and   oversold  regions of a price chart, a signal is indicated by the two lines crossing, compatible with all tradable instruments Latest Release The latest release is the version 4.0 #What's new in version 4.0 ? Features Extreme oversold and overbought levels ROBOS version  4.0  comes with cool new feature , the ability to target on
作者のその他のプロダクト
Gann Signal is a very simple indicator at first glance, but hidden inside is many years of experience in studying W.D.Ganna methods. The indicator gives accurate BUY/SELL signals, without redrawing. The indicator is very easy to use. All you need to do is attach it to your chart and follow its recommendations. The indicator constantly analyzes the market for entry opportunities. When such an opportunity appears, the indicator gives a signal in the form of an arrow. I repeat, all signals are NOT
This indicator is based on the mathematics of the great trader W.D. Ganna. With its help, you can easily find strong levels by analyzing swings to find the optimal entry point. The indicator works on all instruments and all timeframes. The indicator is fully manual and has control buttons. All you need to do is press the NEW button, a segment will appear, which you can place on any movement, swing or even 1 candle that you want to analyze. By placing the segment, press the OK button. A grid (th
This indicator identifies and displays zones, as it were areas of strength, where the price will unfold. The indicator can work on any chart, any instrument, at any timeframe. The indicator has two modes. The indicator is equipped with a control panel with buttons for convenience and split into two modes. Manual mode: To work with manual mode, you need to press the NEW button, a segment will appear. This segment is stretched over the movement and the LVL button is pressed. The level is displayed
The indicator is designed to work on any trading platform. The program is based on proprietary algorithms and W.D.Ganna's mathematics, allowing you to calculate target levels of price movement based on three points with the highest degree of certainty. It is a great tool for stock trading. The indicator has three buttons: NEW - call up a triangle for calculation. DEL - delete the selected triangle. DELS - completely remove all constructions. The probability of achieving the goals is more than 80
This indicator is based on the work of legendary trader William Gann, specifically using mathematical models and data from past days. It calculates potential time for a reversal based on selected parameters for the current day. The time is displayed in the future, at the opening of the day and does not change thereafter. The indicator also includes alerts when potential reversal time approaches. An algorithm for possible price movement is built into the indicator. When the time comes, an alert i
This indicator is, without a doubt, the best variation of the Gann Angles among others. It allows traders using Gann methods to automatically calculate the Gann angles for the traded instrument. The scale is automatically calculated when the indicator is attached to the chart. When switching timeframes, the indicator recalculates the scale for the current timeframe. Additionally, you can enter your own scales for the Gann angles. You can enter your own scales either for both vectors or for each
This indicator is very simple. It tracks the trend and leads it until it changes. You can also set or trail a stop using this indicator. The indicator is equipped with the ability to track older trends on lower charts. Optimal use is achieved by using this indicator together on the current and senior charts. Write after purchase to receive personal recommendations.
We present to your attention an advanced tool for scalping trading. This expert has a market-adaptive algorithm and a fully automatic self-learning mode. Therefore, it has a minimum of settings and is intuitive to operate. The advisor is designed specifically for brokers with low spreads and StopLevel less than 5 . The advisor works on pending orders and opens them only in a specified period of time. Characteristics: Working symbols All low spread symbols Working Timeframe: H1 Min deposit: $100
I present to your attention a powerful utility for predicting the future movement of an asset based on W.D. Ganna’s law of vibration. This utility analyzes the selected market model and provides codes for future possible market movement patterns. If you enter the selected code into the appropriate box, you will receive a forecast of the potential market movement. The utility has the ability to display several potential forecast models. The forecast is not yet tied to time and price and gives th
This indicator is based on the mathematics of the great trader W.D. Ganna. With its help, you can easily find strong levels by analyzing swings to find the optimal entry point. The indicator works on all instruments and all timeframes. The indicator is fully manual and has control buttons. All you need to do is press the NEW button, a segment will appear, which you can place on any movement, swing or even 1 candle that you want to analyze. By placing the segment, press the OK button. A grid (th
This indicator identifies and displays zones, as it were areas of strength, where the price will unfold. The indicator can work on any chart, any instrument, at any timeframe. The indicator has two modes. The indicator is equipped with a control panel with buttons for convenience and split into two modes. Manual mode: To work with manual mode, you need to press the NEW button, a segment will appear. This segment is stretched over the movement and the LVL button is pressed. The level is displayed
フィルタ:
レビューなし
レビューに返信