GTradeView
- ユーティリティ
- Ebdallh Aljlwaxh
- バージョン: 1.60
- アップデート済み: 7 5月 2024
- アクティベーション: 7
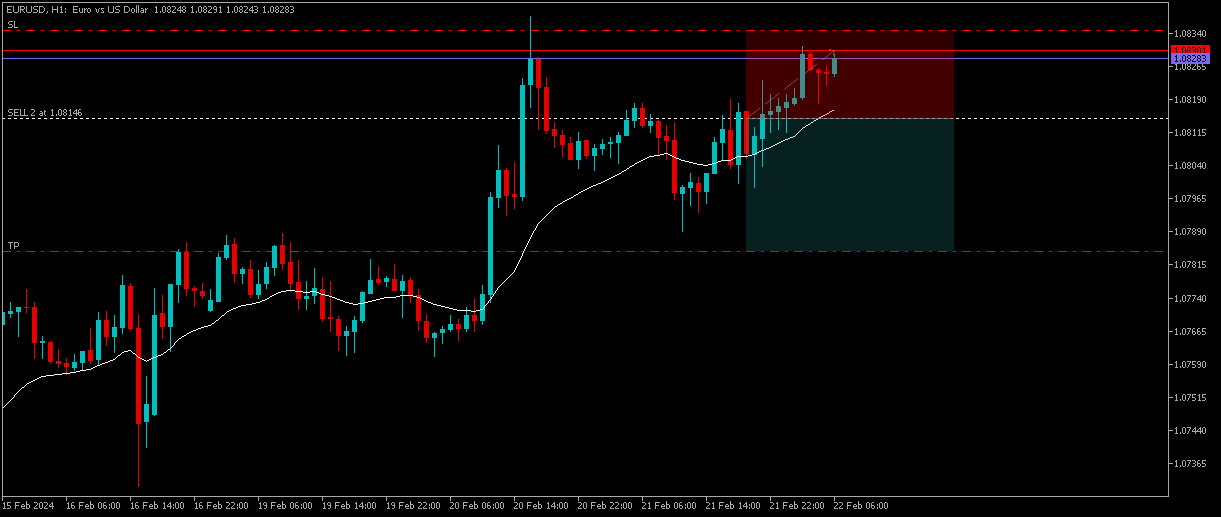
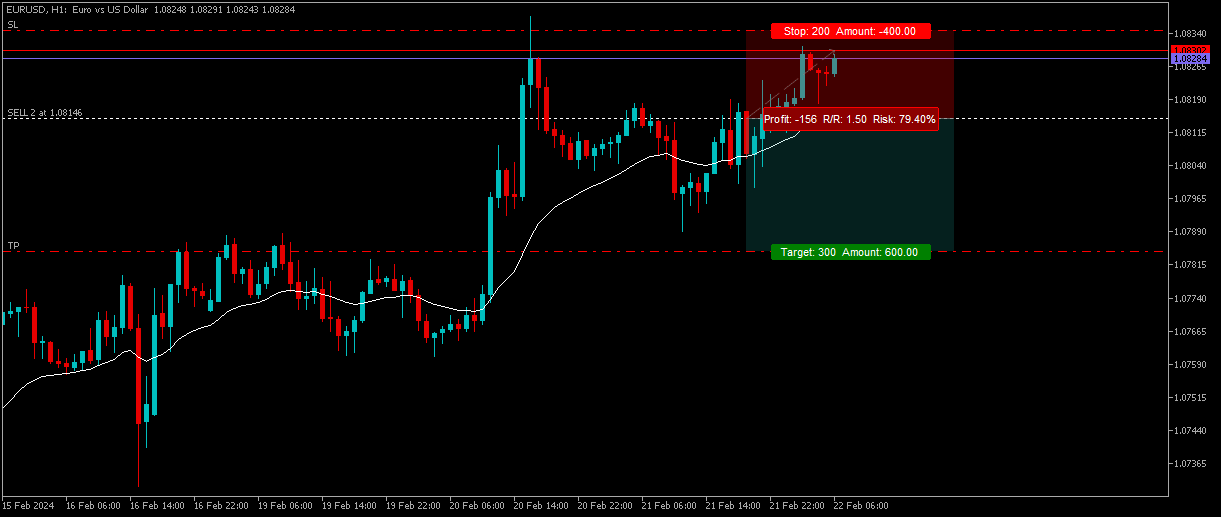
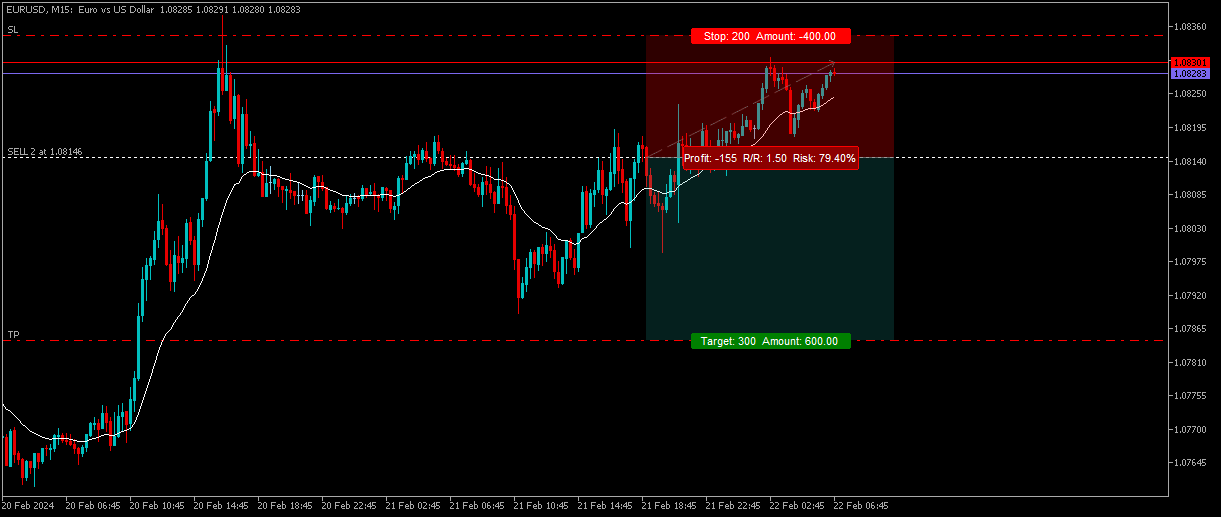
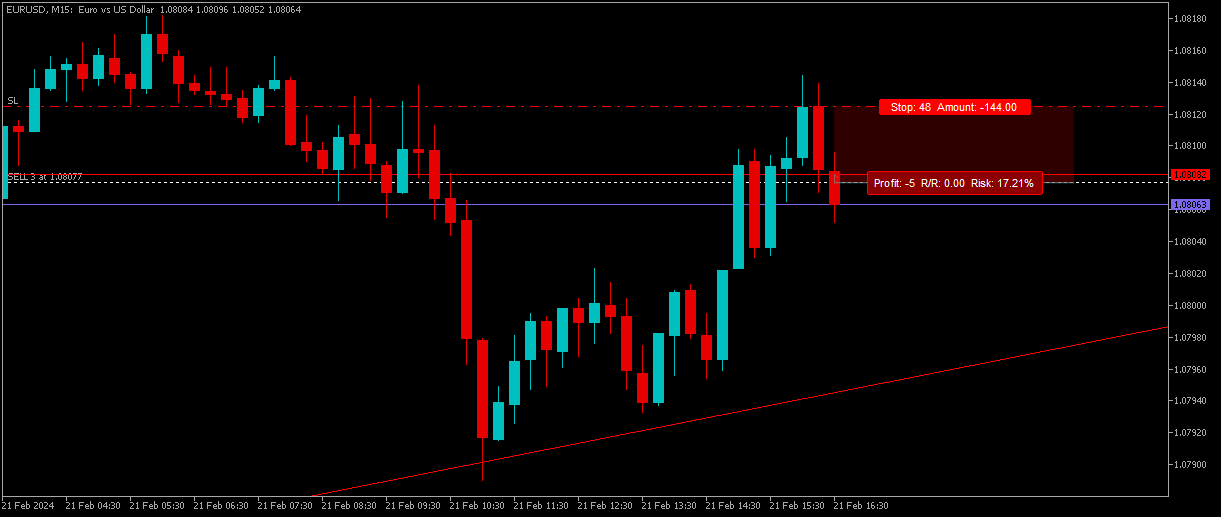
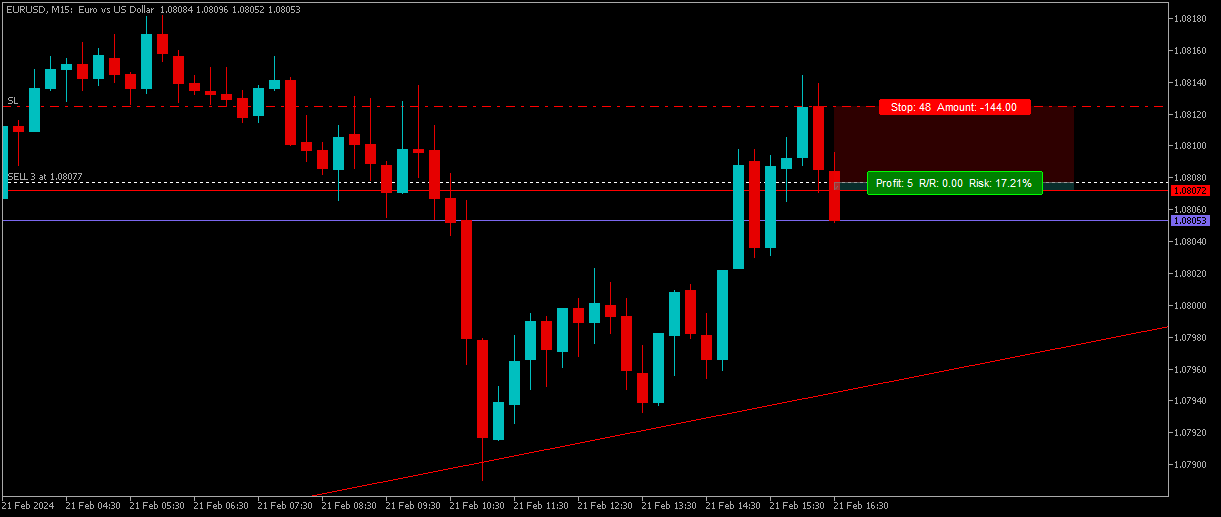
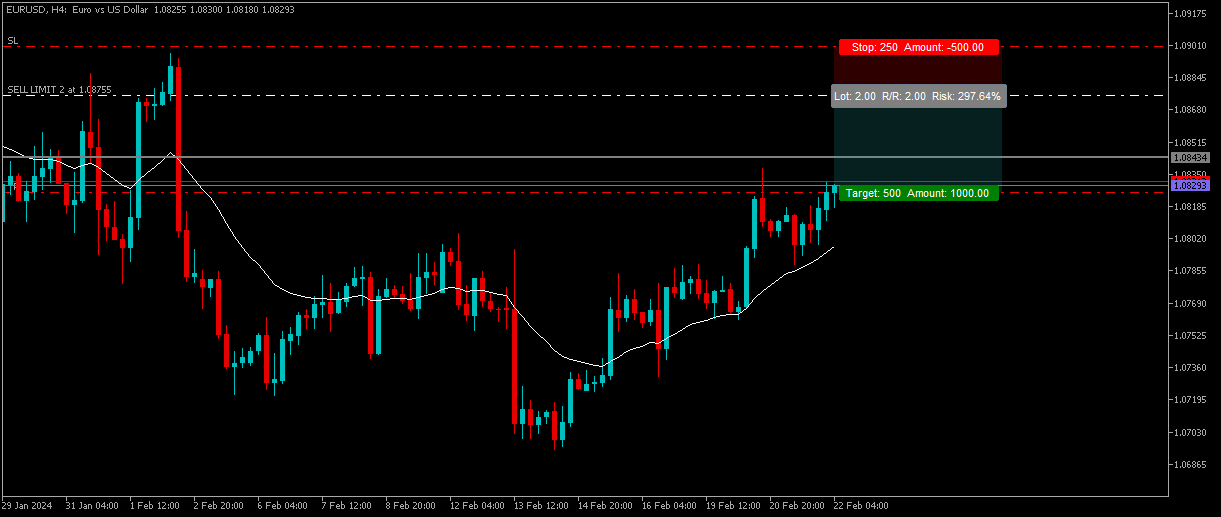
The GTradeView tool is indicator designed to visualize the position and its information, such as Reward to risk ratio, Risk percent, Profit, Target and stop-loss and recalculate the reward to risk ratio and risk% in real time on the chart.
This tool useful in your trading journal. you can take screenshot of your position, entry, target and stop-loss so you have a visual representation of the trade then you can save it in the journal. And you can visualize EA's trade with associated risks and reward to risk ratio for a clear understanding of the open position.
Attention! The application does not work in the strategy tester. You can download the Demo version here DTradeView.
Another tool to show trades history GHistoryView.
Key features:
- Visualizes levels of positions on the chart with details such as entry price, stop-loss, and profit levels.
- Stop Loss and Take Profit values in pips, points and account currency.
- Risk to reward ratio and risk percent.
- Works with any trading instrument (Forex, CFD and others).
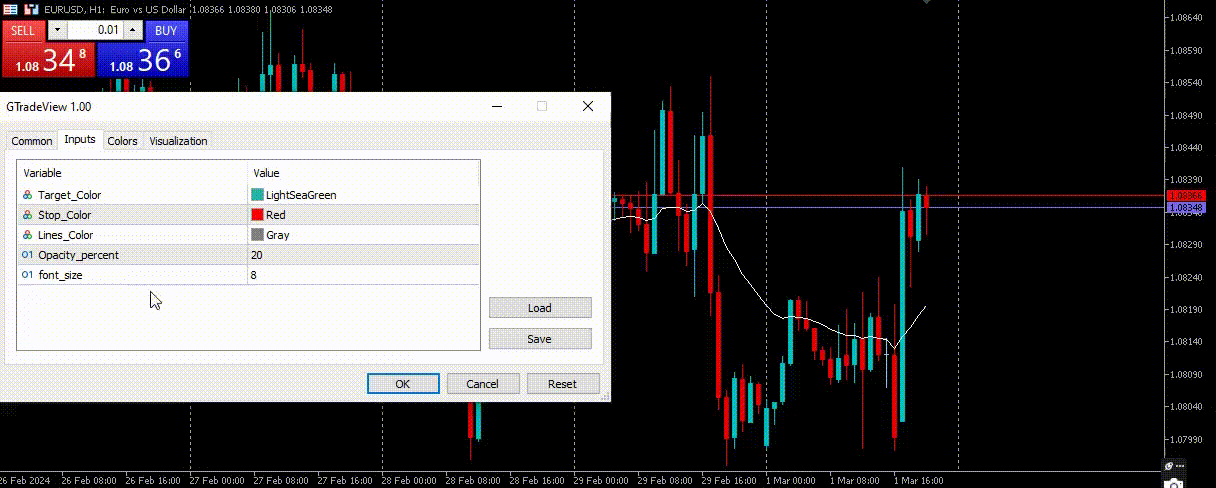
Inputs list:
- Target_Color: the profit part color.
- Stop_Color: the losing part color.
- Lines_Color: the open level color.
- Opacity_percent: transparency value 0% - 100%.
- font_size: the font size of the text.