• 概要
  • レビュー
  • コメント

RaysFX Auto TrendLine

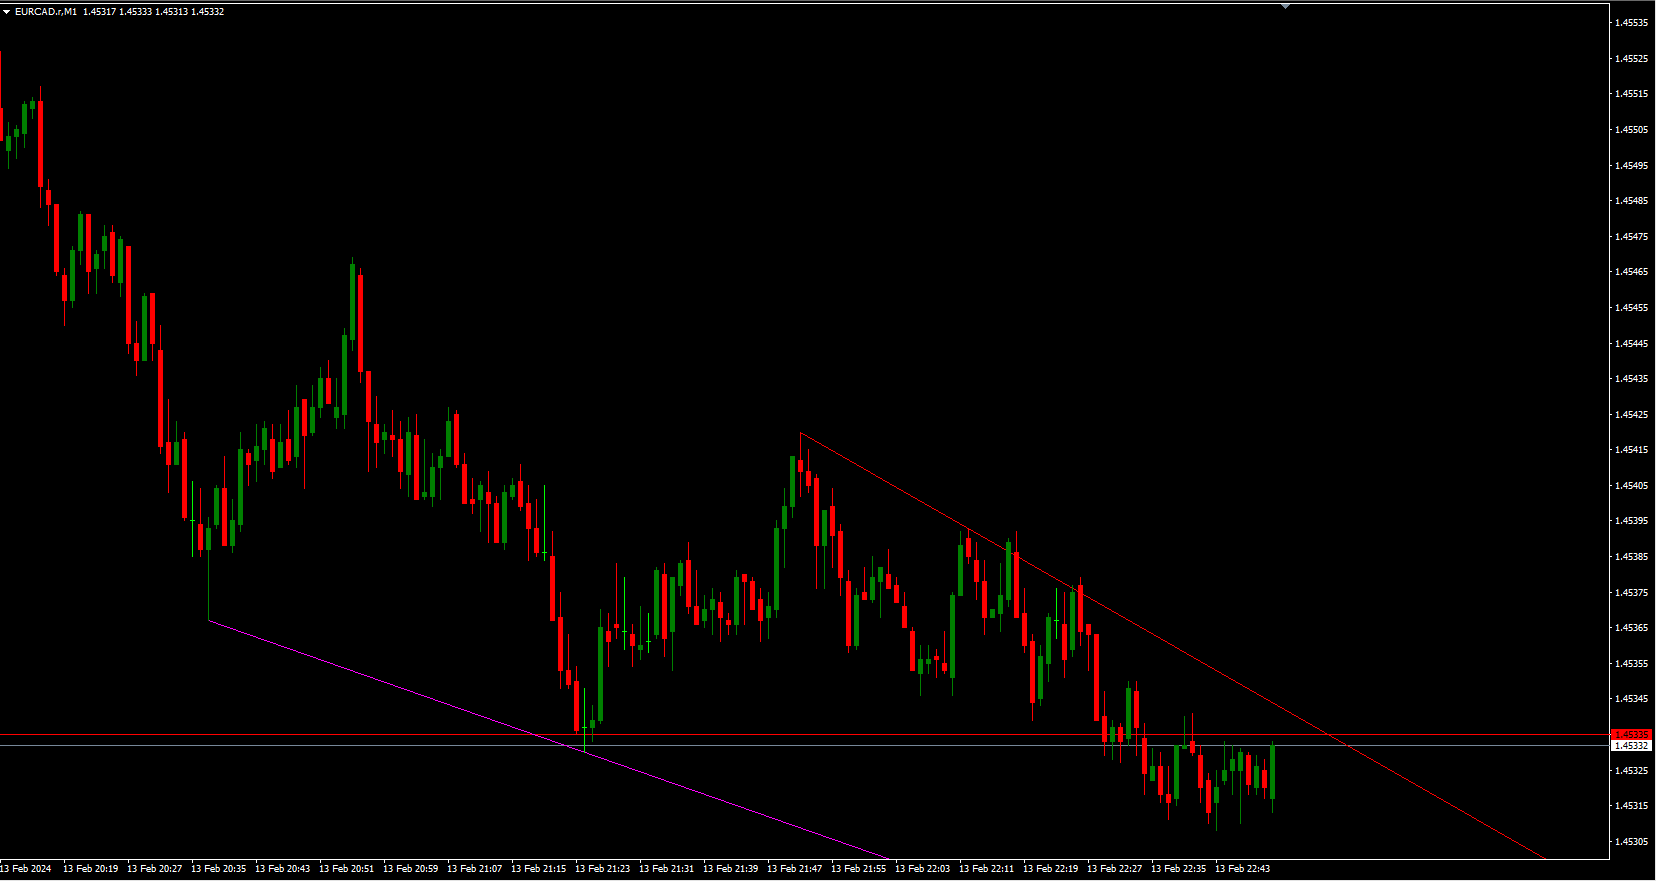
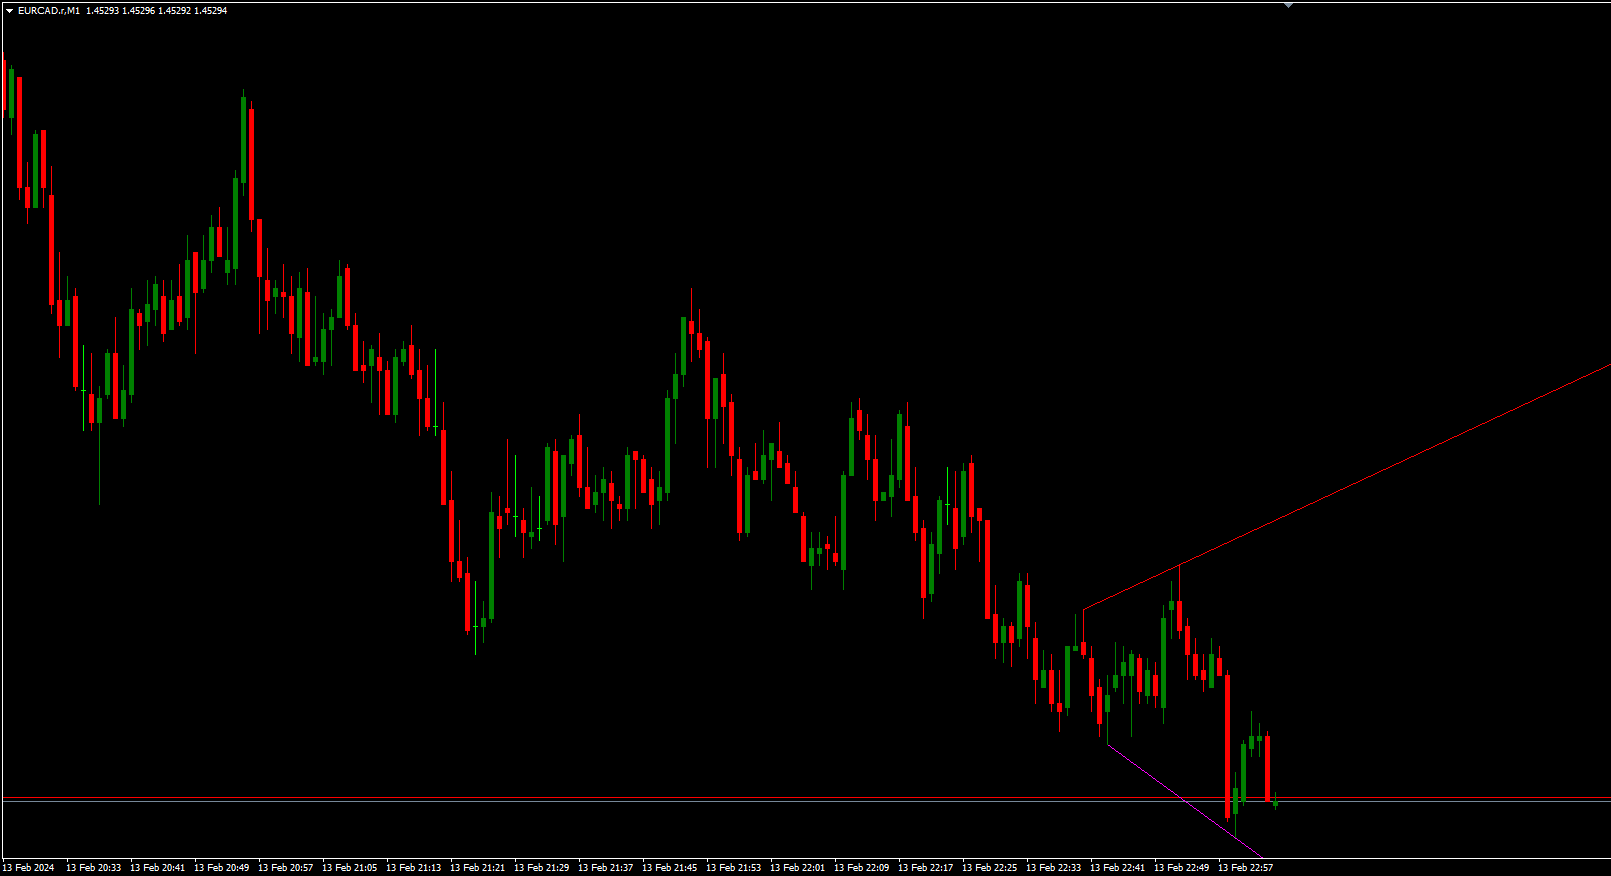
📈 RaysFX Auto TrendLine 📈

  • Linee di tendenza automatiche: L’indicatore disegna automaticamente le linee di tendenza sul tuo grafico, risparmiandoti tempo e fatica.
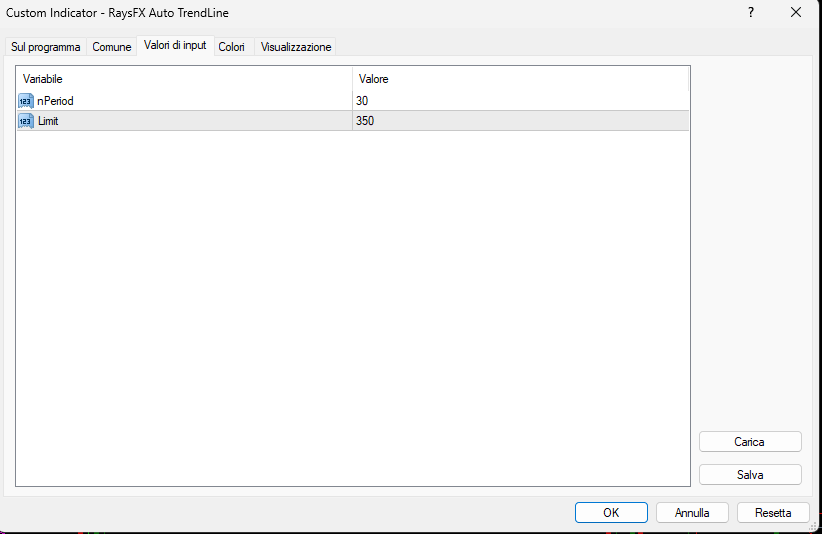
  • Personalizzabile:
    • Periodo (nPeriod): Questo parametro determina il numero di barre che l’indicatore considera per il calcolo delle linee di tendenza. Ad esempio, se imposti  nPeriod  a 10, l’indicatore considererà le ultime 10 barre per disegnare le linee di tendenza. Un periodo più lungo renderà l’indicatore meno sensibile alle variazioni di prezzo a breve termine, mentre un periodo più corto lo renderà più sensibile.

    • Limite (Limit): Questo parametro determina il numero massimo di barre che l’indicatore considera per il calcolo delle linee di tendenza. Se il numero totale di barre è inferiore a  Limit, l’indicatore considererà tutte le barre disponibili. Questo parametro ti permette di limitare l’analisi a un certo periodo di tempo, ignorando i dati più vecchi.

  • Compatibile con MetaTrader 4: L’indicatore è scritto in MQL4, il linguaggio di programmazione per la piattaforma di trading MetaTrader 4.


おすすめのプロダクト
The indicator detects and displays Shark harmonic pattern (see the screenshot). The pattern is plotted by the extreme values of the ZigZag indicator (included in the resources, no need to install). After detecting the pattern, the indicator notifies of that by a pop-up window, a mobile notification and an email. The indicator highlights the process of the pattern formation and not just the complete pattern. In the former case, it is displayed in the contour triangles. After the pattern is comple
This is a trend indicator without redrawing Developed instead of the binary options strategy (by the color of the Martingale candlestick) Also works well in forex trading When to open trades (binary options) A signal will appear in the place with a candle signaling the current candle It is recommended to open a deal for one candle of the current timeframe M1 and M5 When a blue dot appears, open a deal up When a red dot appears, open a trade down. How to open trades on Forex. When a signal is rec
Owl smart levels
Sergey Ermolov
4.63 (54)
MT5版  |   FAQ Owl Smart Levels Indicator   は、 Bill Williams   の高度なフラクタル、市場の正しい波構造を構築する Valable ZigZag、エントリの正確なレベルをマークする Fibonacci レベルなどの一般的な市場分析ツールを含む 1 つのインジケーター内の完全な取引システムです。 利益を得るために市場と場所に。 戦略の詳細な説明 インジケータを操作するための指示 顧問-取引助手 プライベートユーザーチャット ->購入後に私に書いて、私はプライベートチャットにあなたを追加し、あなたはそこにすべてのボーナスをダウンロードすることができます 力はシンプルさにあります! Owl Smart Levels   取引システムは非常に使いやすいので、専門家にも、市場を勉強し始めて自分で取引戦略を選択し始めたばかりの人にも適しています。 戦略と指標に秘密の数式や計算方法が隠されているわけではなく、すべての戦略指標は公開されています。 Owl Smart Levels を使用すると、取引を開始するためのシグナルをすばやく確認し、
ADX Pointer is an indicator which is based on "Average Directional Index" and draws three numbers in chart window depending on the value of ADX. In ADX Pointer you can set "ADX_Period" which is of course period of Average Directional Index and you can also set 3 levels. When ADX value exceed first level ("ADX_Level1") in chart window appears number "1", when ADX exceed second level ("ADX_Level2") appears "2" and when ADX exceed third level ("ADX_Level3") appears "3". Simple. ADX Pointer works on
PABT Pattern Indicator - it's classical system one of the signal patterns. Indicator logic - the Hi & Lo of the bar is fully within the range of the preceding bar, look to trade them as pullback in trend. In the way if indicator found PABT pattern it's drawing two lines and arrow what showing trend way.  - First line - it's entry point and drawing at: 1. On the high of signal bar or on middle of the signal bar (depending from indicator mode) for buy; 2. On the low of signal bar or on middle of t
This is a combination of multiple oscillators into a single divergence system that creates the impression of a more reliable divergence indicator. It is multi-currency based and works best on 15 minutes timeframe and above. Every time a signal is generated, it shows an alert to the user. It is more ideal if combined with other price action indicators or trading systems.
The indicator displays the data of the Stochastic oscillator from a higher timeframe on the chart. The main and signal lines are displayed in a separate window. The stepped response is not smoothed. The indicator is useful for practicing "manual" forex trading strategies, which use the data from several screens with different timeframes of a single symbol. The indicator uses the settings that are identical to the standard ones, and a drop-down list for selecting the timeframe. Indicator Parame
The Four Moving Averages Message indicator ( please see the description and video ), a version of Four Moving Averages , concurrently displays four Moving Averages with default settings in the main chart window: Green and Red ones represent a short-term trend, Red and Blue ones - mid-term trend, while Blue and Yellow ones - long-term trend. You can change the moving average settings and colors. However, these parameters have been configured so that to allow trading on all time frames. The built-
The indicator detects and displays 3 Drives harmonic pattern (see the screenshot). The pattern is plotted by the extreme values of the ZigZag indicator (included in the resources, no need to install). After detecting the pattern, the indicator notifies of that by a pop-up window, a mobile notification and an email. The indicator highlights the process of the pattern formation and not just the complete pattern. In the former case, it is displayed in the contour triangles. After the pattern is com
This indicator is the undisputed leader among the indicators. And for this statement there is a good reason. The indicator builds a very high quality channel in which it generates signals to enter! What is the ideal strategy for the trader, since the trader always hesitates when choosing a strategy for the job. That is, this indicator will allow you to solve the dilemma of choosing a job by trend or to the channel, since it combines these two basic concepts. Working with the indicator is very
[ZhiBiCCI]インディケータは全てのサイクル使用に適しており、そして全ての市場品種にも適しています。 [ZhiBiCCI]緑色の実線は強気の発散の逆転です。緑色の点線は古典的な強気の発散です。 [ZhiBiCCI]赤への実線は逆弱気の発散である。赤い点線は古典的な弱気の発散です。 [ZhiBiCCI]はパラメータ(アラート、メール送信、通知送信)で設定でき、(true)に設定するとインスタント信号をアラームウィンドウに送信し、Eメール、インスタントメッセージを送信できます。 パラメータ設定の説明 [displayAlert]:これはアラームスイッチで、trueに設定され、矢印が表示されればプロンプトに自動的に警告され、falseに設定されれば警告されません。 [sendmail_NO_OFF]:これはメールを送信するためのスイッチで、trueに設定します。矢印が表示されていればMT4で設定したメールボックスにメールを送信し、falseに設定されていればメールを送信しません。 [sendnotification_NO_OFF]:これはインスタントメッセー
DYJ Alligator SignalSource   is based on Alligator   indicator. It can be used for any currency pair and timeframe. The blue line (Alligator's Jaw) is the Balance Line for the timeframe that was used to build the chart (13-period Smoothed Moving Average, moved into the future by 8 bars); Red Line (Alligator's Teeth) is the Balance Line for the value timeframe of one level lower (8-period Smoothed Moving Average, moved by 5 bars into the future); Green Line (Alligator's Lips) is the Balance Line
Wave WOLD MT4外国為替インジケータは、Wolf waveを検索し、取引端末の現在のウィンドウに表示するように設計されています。 取引でオオカミの波を使用するトレーダーのための優れた指標。 取引戦略への適用は、効率と収益性を大幅に向上させます。 指標に関する情報 他のWolf wave指標とは異なり、Wave WOLD MT4外国為替指標は、その有効性を大幅に高める多くの機能を備えています: 最初のものは開いているWindows5Pointパラメータ(真の値)情報サポートを提供します。つまり、Wolf waveが登場したチャートのウィンドウを展開します。 たとえば、EURUSD、AUDUSD、GBPUSDチャートが開いていて、それぞれにWave WOLD MT4インジケーターがインストールされている場合、ユーロモデルが検出されると、対応するチャートが自動的に他のチャートの上に前景に表示され、多数の商品を取引するときに非常に便利になります。  2番目の機能は、ユーザーが自分で選択できるパラメータ(デフォルト設定(12,26,9))であるmacd上の組み込みの発散分析で
Download the free version   here. Divergence Divergence refers to when the price of a currency pair moves in one direction while the trend indicator is moving in the opposite direction. With divergence, there can be positive and negative signals. Divergences in Forex trading are quite common signals of technical analysis. These are basic early Forex signals indicating the trend reversal and filter false signals. Application of this indicator It is usually not easy to detect divergences by the t
MACDivergence MTF
Pavel Zamoshnikov
4.29 (7)
Advanced ideas of the popular MACD indicator: It detects and displays classic and reverse divergences (three methods of detecting divergences). It uses different color to highlight an uptrend and a downtrend. Two methods of determining a trend: а) MACD crosses the 0 level (classic signal); б) MACD crosses its own average (early signal). This is a multi-timeframe indicator: it can display MACD data from other timeframes. Two methods of drawing: classic histogram and line. It generates sound and v
KDJ Index 4   交易实用必备工具指标 波浪自动计算指标,通道趋势交易 完美的趋势-波浪自动计算通道计算 , MT4版本 完美的趋势-波浪自动计算通道计算 , MT5版本 本地跟单复制交易 Easy And Fast Copy , MT4版本 Easy And Fast Copy , MT5版本 本地跟单复制交易 模拟试用 Easy And Fast Copy , MT4 模拟账号运行 Easy And Fast Copy , MT5 模拟账号运行 "Cooperative QQ:556024  "  "Cooperation wechat:556024"  "Cooperative email:556024@qq.com" 强烈推荐趋势指标, 波浪的标准自动计算   和   波浪的标准自动计算MT5版本     KDJ指标又叫 随机指标 ,是一种相当新颖、实用的技术分析指标,它起先用于期货市场的分析,后被广泛用于股市的中短期趋势分析,是期货和股票市场上最常用的技术分析工具。 随机指标KDJ一般是用于股票分析的统计体系,根据统计学原理,通过一个特定的周期(常为9日、9周等
Advanced Ichimoku Toggle Button With Alert Indicator A Very useful tool that every trader should have in their tool box This Indicator is an unique and high quality tool because it has many useful features. The ichimoku indicator consists of many elements such as kumo cloud,Kijunsen,Tenkansen,chinkou span,Span A and Span B. Different Traders use the ichimoku indicator for different strategies such as cloud breakout strategy, Tenkan kijun cross, chinkou price cross and many more...    But for m
Noize Absorption Index - is the manual trading system that measures the difference of pressure between bears forces and bulls forces. Green line - is a noize free index that showing curent situation. Zero value of index shows totally choppy/flat market.Values above zero level shows how powerfull bullish wave is and values below zero measures bearish forces.Up arrow appears on bearish market when it's ready to reverse, dn arrow appears on weak bullish market, as a result of reverse expectation. S
-   Real price is 90$   - 50% Discount ( It is 45$ now ) Contact me for instruction, any questions! Introduction V Bottoms and Tops are popular   chart patterns   among traders due to their potential for identifying trend reversals. These patterns are characterized by sharp and sudden price movements, creating a V-shaped or inverted V-shaped formation on the   chart . By recognizing these patterns, traders can anticipate potential shifts in market direction and position themselves according
The indicator detects and displays М. Gartley's Butterfly pattern. The pattern is plotted by the extreme values of the ZigZag indicator (included in the resources, no need to install). After detecting the pattern, the indicator notifies of that by the pop-up window, a mobile notification and an email. The pattern and wave parameters are displayed on the screenshots. The default parameters are used for demonstration purposes only in order to increase the amount of detected patterns. Parameters
GG TrendBar Indicator - Your Multitimeframe ADX Trading Solution Experience the power of multi-timeframe trading with the "GG TrendBar Indicator." This versatile tool, built upon the ADX indicator, offers precise insights by considering multiple timeframes, ensuring you make well-informed trading decisions. Basic Details : Indicator Type : GG TrendBar Indicator (Multi-Timeframe ADX) Key Metrics : Real-time ADX analysis across multiple timeframes. Customization : Enable or disable specific timefr
The presented indicator allows you to determine potential entry points into the market and set protective orders at reasonable levels. This product can be useful for both beginners and experienced traders. The indicator is based on calculation methods proven by time and practicing traders. The indicator is calculated in two stages: At the first stage, linear regression (LR) of the selected price type is determined for a given number of chart periods. At the second stage, the obtained data is p
Combined MT4
Ahmed Alaaeldin Abdulrahman Ahmed Elherzawi
Welcome to Investment Castle products   This product is exclusively available in the MQL5 market and is not available and will not be available anywehere else. The Combined indicator is a multi-time frame indicator and it is built using 3 indicators: Bands indicator which draws the support and resistance key levels   using up to 5 different time frames Patterns indicator which draws the chart patterns using up to 6 different time frames Spots indicator which shows the common candlestick pattern
Trend Flasher Trend is your friend is the age old saying quote in trading arena, there are though many ways to gauge the trend and its direction, more scientific measure and logically meaningful will be an ATR break outs to identify and spot the trend and its acceleration, so we created this easy to use trend identification panel and optimized super trend based multi time frame panel entry system to aid and help the traders to make their trading decision. Unique Features of Trend Flasher 1
About the Lyne indicator Lyne is a Metatrader 4 (MT4) indicator, the essence of which is to transform the accumulated historical data. The Lyne indicator makes it possible to detect various features and patterns in price dynamics that are invisible to the naked eye. Based on this information, traders can anticipate further price movement and adjust their strategy accordingly. This indicator has proven itself in the scalping strategy. The indicator works without repainting.
Colored trend indicator advanced is a trend indicator that is based on Fast Moving Average and Slow Moving Average and also uses RSI and Momentum to give a trend strength in percent. It is aimed to find more healthy trends with this indicator. This indicator can be used alone as a trend indicator. Colors (Default) Green = Uptrend (Default) Red = Downtrend No color = No trend, no good trend Indicator Parameters WarnPosTrendchange: Warns you when the trend may change. FullColor: See screenshot
標準パラメーターを使用したMACDインジケーター波に基づく 最後と最後の2つのMACDウェーブで、それぞれ正と負のフィボナッチレベルを扱います。 現時点でMACDインジケーターで負の波が終了している場合、色は緑です。 現時点でMACDインジケーターの正の波が終了している場合、色は赤です。 Waveの終了基準は、MACDの符号が異なる2ティックです。 最後の4つのMACDウェーブのトレンドラインをプロットします。 専門家とうまく働く  その他のスクリーンショット: Figures MACD   https://www.mql5.com/ru/market/product/42031 https://www.mql5.com/en/charts/10581596/audusd-h1-alpari-international https://www.mql5.com/en/charts/10631979/usdjpy-m1-alpari-international https://www.mql5.com/en/charts/10628704/gbpusd-
MT4 用 TREND MACD インジケーター - 優れた効率的な取引ツールです。 このインジケーターは、大きな値動きを捉えることに重点を置いているトレンドトレーダーに最適です。 TREND MACD は 3 つのラインで構成されます: 緑の線 - 主要なトレンドの方向を示し、青とマゼンタの線でエントリーとエグジットを示します。 インジケーターにより利益を最大化できます - 収益性の高い取引を早期に終了することはありません インジケーターにはモバイルおよび PC アラートが組み込まれています インジケーターの使用方法 (写真を参照): 1) 青とマゼンタの線が両方とも緑の線より上にあるかどうかを確認します。 2) 次に、青い線がマゼンタの線より上になったら、買います。 3) 青い線がマゼンタの線を下回ったら、取引を終了します。 4) ショートトレードの場合はその逆。 // さらに優れたエキスパートアドバイザーとインジケーターはここから入手できます: https://www.mql5.com/en/users/def1380/seller // また、収益性が高く、安定してい
Trend PA
Mikhail Nazarenko
5 (3)
The Trend PA indicator uses   Price Action   and its own filtering algorithm to determine the trend. This approach helps to accurately determine entry points and the current trend on any timeframe. The indicator uses its own algorithm for analyzing price changes and Price Action. Which gives you the advantage of recognizing, without delay, a new nascent trend with fewer false positives. Trend filtering conditions can be selected in the settings individually for your trading style. The indicator
Gobbo è un indicatore professionale che evidenzia il trend del mercato con un aspetto grafico chiaro e comprensibile, è basato sulla Moving Average e può essere impostato su qualsiasi periodo di intervallo, di default impostato sul periodo 14, scegliendo un periodo più alto evidenzierà meno cambi di tendenza per un approccio sul medio o lungo periodo, con un periodo più basso più cambi di tendenza per un approccio sul breve termine L'aggiornamento e l'adattamento al time frame scelto avviene in
このプロダクトを購入した人は以下も購入しています
Gann Made Easy は、ミスター・ギャンの理論を使用した取引の最良の原則に基づいた、プロフェッショナルで使いやすい外国為替取引システムです。 W・D・ガン。このインジケーターは、ストップロスとテイクプロフィットレベルを含む正確な買いと売りのシグナルを提供します。 PUSH通知を利用して外出先でも取引可能です。 購入後はご連絡ください!私の取引のヒントと素晴らしいボーナスインジケーターを無料で共有します! おそらく、ギャンの取引手法についてはすでに何度も聞いたことがあるでしょう。通常、ギャンの理論は初心者のトレーダーだけでなく、すでにある程度の取引経験がある人にとっても非常に複雑なものです。なぜなら、ギャンの取引手法は理論的にはそれほど簡単に適用できるものではないからです。私はその知識を磨き、最良の原則を私の外国為替インジケーターに組み込むために数年を費やしました。 このインジケーターは非常に簡単に適用できます。必要なのは、それをチャートに添付し、簡単な取引推奨事項に従うだけです。このインジケーターは常に市場分析の仕事を行い、取引の機会を探します。適切なエントリーポイントを検出
Manual guide:   Click here PROMO of  $79 for 2 copies left!  -- Next price is  $149 .  This indicator is unstoppable when combined with our other indicator called  Support & Resistance . After purchase, send us a message and you will get it   for  FREE as a BONUS! I like to use Trend Punch on XAUUSD & BTCUSD on the M1 timeframe!  Introducing Trend Punch , the revolutionary forex trend indicator that will transform the way you trade! Trend Punch is uniquely designed to provide preci
まず第一に、この取引インジケーターは再描画されず、再描画されず、遅延しないことを強調する価値があります。これにより、手動取引とロボット取引の両方に理想的なものになります。 ユーザーマニュアル:設定、入力、戦略。 アトミックアナリストは、価格の強さとモメンタムを利用して市場でより良いエッジを見つけるためのPA価格アクションインジケーターです。ノイズや誤ったシグナルを除去し、取引ポテンシャルを高めるための高度なフィルターを備えています。複雑なインジケーターの複数のレイヤーを使用して、アトミックアナリストはチャートをスキャンし、複雑な数学的計算をシンプルなシグナルと色に変換します。これにより、どのような初心者トレーダーでも理解して使用し、一貫した取引の決定を行うことができます。 「アトミックアナリスト」は、新規および経験豊富なトレーダー向けにカスタマイズされた包括的な取引ソリューションです。プレミアムインジケーターとトップノッチの機能を1つの取引戦略に組み合わせ、すべてのタイプのトレーダーにとって汎用性のある選択肢にします。 デイリートレーディングとスキャルピング戦略:高
An exclusive indicator that utilizes an innovative algorithm to swiftly and accurately determine the market trend. The indicator automatically calculates opening, closing, and profit levels, providing detailed trading statistics. With these features, you can choose the most appropriate trading instrument for the current market conditions. Additionally, you can easily integrate your own arrow indicators into Scalper Inside Pro to quickly evaluate their statistics and profitability. Scalper Inside
Advanced Supply Demand
Bernhard Schweigert
4.92 (312)
現在33%オフ 初心者にもエキスパートトレーダーにも最適なソリューション このインジケーターは独自の機能と新しい公式を多数内蔵しており、ユニークで高品質かつ手頃な取引ツールです。このアップデートでは、2つの時間枠ゾーンを表示できるようになります。より長いTFだけでなく、チャートTFとより長いTF(ネストゾーンを表示)の両方を表示できます。すべてのSupply Demandトレーダーの皆さんのお気に召すはずです。:) 重要情報の公開 Advanced Supply Demandの可能性を最大化するには、 https://www.mql5.com/ja/blogs/post/720245 にアクセスしてください。   エントリーまたはターゲットの正確なトリガーポイントを正確に特定できれば取引がどのように改善されるか想像してみてください。新しい基盤となるアルゴリズムに基づいて構築されているため、買い手と売り手の間の潜在的な不均衡をさらに簡単に特定できます。これは、最も強い需要と供給のゾーンと、過去のパフォーマンス(古いゾーンを表示)がグラフィカルに表現されるためです。これらの機能は、最適
現在26%オフ 初心者やエキスパートトレーダーに最適なソリューション! このインジケーターは、独自の機能と新しい計算式を取り入れた、ユニークで高品質、かつ手頃な価格のトレーディングツールです。たった1枚のチャートで28の為替ペアの通貨強度を読み取ることができます。新しいトレンドやスキャルピングチャンスの引き金となるポイントを正確に特定することができるので、あなたのトレードがどのように改善されるか想像してみてください。 ユーザーマニュアルはこちら  https://www.mql5.com/en/blogs/post/697384 これが最初の1本、オリジナルだ! 価値のないクローンを買わないでください。 特別な サブウィンドウの矢印で強い通貨の勢いを表示 GAPがあなたのトレードを導く! 基準通貨や気配値が売られすぎ・買われすぎのゾーン(外相フィボナッチレベル)にあるとき、個別チャートのメインウィンドウに警告表示。 通貨がレンジの外側から反落した場合、プルバック/リバーサルのアラート。 クロスパターンの特別なアラート 複数の時間枠を選択可能で、トレンドを素早く
現在20%OFF! 初心者やエキスパートトレーダーのためのベストソリューション! このダッシュボードソフトウェアは、28の通貨ペアで動作しています。それは私達の主要な指標(高度な通貨の強さ28と高度な通貨インパルス)の2に基づいています。それは全体の外国為替市場の大きい概観を与えます。それは、すべての(9)時間枠で28の外国為替ペアのための高度な通貨の強さの値、通貨の動きの速度と信号を示しています。チャート上で1つのインディケータを使用して市場全体を観察し、トレンドやスキャルピングの機会をピンポイントで見つけることができたら、あなたのトレードがどのように改善されるか想像してみてください。 このインディケータには、強い通貨と弱い通貨の識別、潜在的な取引の識別と確認がより簡単になるような機能が搭載されています。このインディケータは、通貨の強さや弱さが増加しているか減少しているか、また、すべての時間枠でどのように機能しているかをグラフィカルに表示します。 新機能として、現在の市場環境の変化に適応するダイナミックなマーケットフィボナッチレベルが追加され、すでに当社のAdvan
ブレーカートレーダーになり、価格が反転すると市場構造からの利益が変化します。 注文ブロックブレーカーインジケーターは、トレンドまたは価格の動きが枯渇に近づいており、逆転の準備ができていることを識別します。通常、反転または大規模なプルバックが発生しようとしているときに発生する市場構造の変化について警告します。 この指標は、ブレイクアウトと価格の勢いを識別する独自の計算を使用します。使い果たされる可能性のあるポイントの近くで新しい高値が形成されるたびに、インディケーターはその高値の作成を担当する最後の注文ブロックを描きます。次に、移動する価格とともに注文ブロックを追跡します。その後、価格が反対方向にシフトし、その注文ブロックを突破すると、新しい市場構造を作成し、トレンドまたは大きな後退の可能性のある反転の開始を警告します。 注文ブロックは、高値/安値が作成される前の最後の反対色のろうそくであり、価格がこれらの重要な領域を下抜けすると、トレンドの短期的ま​​たは長期的な反転の兆候です。 特徴 重要な枯渇点での市場構造の変化を警告します 価格が使い果たされるレベルに近づくと、
TPSpro TRENDPRO  - is a trend indicator that automatically analyzes the market and provides information about the trend and each of its changes, as well as giving signals for entering trades without redrawing! The indicator uses each candle, analyzing them separately. referring to different impulses - up or down impulse. Exact entry points into transactions for currencies, crypto, metals, stocks, indices!  -  Version MT5               DETAILED DESCRIPTION                R ecommended to use with
まず第一に、この取引ツールはノンリペイント、ノンリドロー、ノンラグの指標であり、プロの取引に理想的ですことを強調する価値があります。 オンラインコース、ユーザーマニュアル、デモ。 スマートプライスアクションコンセプトインジケーターは、新米から経験豊富なトレーダーまで、非常 に強力なツールです。Inner Circle Trader AnalysisやSmart Money Concepts Trading Strategiesなど、20以上の有用な指標を1つに組み合わせています。このインジケーターはスマートマネーコンセプトに焦点を当て、大手機関の取引方法を提供し、彼らの動きを予測するのに役立ちます。 特に、流動性分析に優れており、機関がどのように取引しているかを理解しやすくしています。市場のトレンドを予測し、価格の動きを慎重に分析するのに優れています。機関の戦略とトレードを合わせることで、市場の動向についてより正確な予測ができます。このインジケーターは多目的であり、市場構造を分析し、重要な注文ブロックを特定し、さまざまなパターンを認識するのに優れています。 このインジケー
Auto Order Block with break of structure based on ICT and Smart Money Concepts (SMC) Futures Break of Structure ( BoS )             Order block ( OB )            Higher time frame Order block / Point of Interest ( POI )    shown on current chart           Fair value Gap ( FVG ) / Imbalance   -  MTF      ( Multi Time Frame )    HH/LL/HL/LH  -  MTF      ( Multi Time Frame )  Choch  MTF      ( Multi Time Frame )  Volume Imbalance     ,  MTF          vIMB Gap’s Power of 3 Equal High
Reversal First Impulse levels (RFI)    INSTRUCTIONS        RUS       -       ENG              R ecommended to use with an indicator   -   TREND PRO -  Version MT5 A key element in trading is zones or levels from which decisions to buy or sell a trading instrument are made. Despite attempts by major players to conceal their presence in the market, they inevitably leave traces. Our task was to learn how to identify these traces and interpret them correctly. Main functions: Displaying active zones
Legacy of Gann
Pavel Zamoshnikov
4.83 (12)
The indicator very accurately determines the levels of the possible end of the trend and profit fixing. The method of determining levels is based on the ideas of W.D.Gann, using an algorithm developed by his follower Kirill Borovsky. Extremely high reliability of reaching levels (according to K. Borovsky  - 80-90%) Indispensable for any trading strategy – every trader needs to determine the exit point from the market! Precisely determines targets on any timeframes and any instruments (forex, met
Gold Stuff
Vasiliy Strukov
4.89 (260)
Gold Stuff は、金専用に設計されたトレンド指標であり、あらゆる金融商品にも使用できます。 インジケーターは再描画せず、遅れません。 推奨時間枠 H1. それインディケータでフルオートExpert Advisor EA Gold Stuffが動作します。 あなたは私のプロフィールでそれを見つけることができます. 設定と個人的なボーナスを得るために、購入後すぐに私に連絡してください! トレンド スキャナーの強力なサポートを利用して、無料のインジケーターを入手し、プライバシーを守ります。あーみー!   設定 矢印を描く - オンオフ。 チャートに矢印を描く。 アラート - 可聴アラートのオンオフ。 メール通知 - オンオフ。 電子メール通知。 プチ通知 - オンオフ。 プッシュ通知。 次に、色域を調整します。 Gold Stuff は、金専用に設計されたトレンド指標であり、あらゆる金融商品にも使用できます。 インジケーターは再描画せず、遅れません。 推奨時間枠 H1. それインディケータでフルオートExpert Advisor EA Gold Stuff
カスタムMT4インジケーターで外国為替取引を成功させるための秘密を発見してください! 外国為替市場で成功を達成し、リスクを最小限に抑えながら一貫して利益を得る方法を疑問に思ったことはありますか? これがあなたが探している答えです! 取引へのアプローチに革命をもたらす独自のMT4インジケーターを導入できるようにします。 ユニークな汎用性 私たちのインジケータは、RenkoとRangeBarのろうそくのフォーメーションを好むユーザー向けに特別に設計されています。 これらのチャートタイプは多くの経験豊富なトレーダーに好まれていることを理解しています。そのため、私たちのインジケーターはそれらとシームレスに統合され、比類のない市場分析を提供します。 クリアトレンドシグナル 複雑な分析を忘れてください! 私たちのインジケーターは、鮮やかな色と明確なドット構造を利用して、市場の動向を明確に示しています。 赤と青の点は、価格の動きの方向性について疑いの余地がなく、取引の迅速な意思決定を可能にします。 HH/HL HL/LL戦略とのアライメント HH/HLおよびHL/LL構
Volatility Trend System - a trading system that gives signals for entries. The volatility system gives linear and point signals in the direction of the trend, as well as signals to exit it, without redrawing and delays. The trend indicator monitors the direction of the medium-term trend, shows the direction and its change. The signal indicator is based on changes in volatility and shows market entries. The indicator is equipped with several types of alerts. Can be applied to various trading
通貨強さウィザードは、取引を成功させるためのオールインワン ソリューションを提供する非常に強力な指標です。このインジケーターは、複数の時間枠のすべての通貨のデータを使用して、このまたはその外国為替ペアのパワーを計算します。このデータは、使いやすい通貨インデックスと通貨パワーラインの形式で表され、特定の通貨のパワーを確認するために使用できます。 必要なのは、取引したいチャートにインジケーターを接続することだけです。インジケーターは、取引する通貨の実際の強さを示します。このインジケーターは、トレンドに合わせて取引するときに有利に利用できる売買高の圧力の極値も示します。このインジケーターには、フィボナッチに基づく可能なターゲットも表示されます。 このインジケーターは、PUSH 通知を含むあらゆるタイプのアラートを提供します。 購入後ご連絡下さい。私の取引のヒントをあなたと共有し、素晴らしいボーナスインジケーターを無料で提供します! 幸せで有益な取引をお祈りします。
ICT, SMC, SMART MONEY CONCEPTS, SMART MONEY, Smart Money Concept, Support and Resistance, Trend Analysis, Price Action, Market Structure, Order Blocks, BOS/CHoCH,   Breaker Blocks ,  Momentum Shift,   Supply&Demand Zone/Order Blocks , Strong Imbalance, HH/LL/HL/LH,    Fair Value Gap, FVG,  Premium  &   Discount   Zones, Fibonacci Retracement, OTE, Buy Side Liquidity, Sell Side Liquidity, BSL/SSL Taken, Equal Highs & Lows, MTF Dashboard, Multiple Time Frame, BigBar, HTF OB, HTF Market Structure, 
Trend Screener
STE S.S.COMPANY
4.83 (88)
トレンドインジケーター、1つのツールに組み込まれたすべての重要なトレンド機能を備えたトレンドトレーディングとフィルタリングのための画期的なユニークなソリューション! これは、すべてのシンボル/商品(外国為替、商品、暗号通貨、インデックス、株式)で使用できる100%再描画されていないマルチタイムフレームおよびマルチ通貨インジケーターです。 トレンドスクリーナーは、チャート内のドットで矢印トレンドシグナルを提供するインジケーターに続く効率的なインジケーターです。 トレンド分析インジケーターで使用できる機能: 1.トレンドスキャナー。 2.最大利益分析を備えたトレンドライン。 3.トレンド通貨強度メーター。 4.アラート付きのトレンド反転ドット。 5.アラート付きの強いトレンドドット。 6.トレンド矢印 毎日の分析例、毎日のシグナルパフォーマンス...など、トレンドスクリーナーインジケーターを使用して、ここで見つけることができます: ここをクリックしてください 期間限定オファー:トレンドスクリーナーインジケーターは、50ドルと生涯でのみご利用いただけます。 (元の価格125 $) MQ
市場の2つの基本原則に基づく日中戦略。 このアルゴリズムは、追加のフィルターを使用したボリュームと価格の波の分析に基づいています。インディケータのインテリジェントアルゴリズムは、2つの市場要因が1つに結合した場合にのみシグナルを出します。インディケータは、より高い時間枠のデータを使用して、M1チャート上の特定の範囲の波を計算します。そして波を確認するために、インジケーターはボリュームによる分析を使用します。 このインディケータはレディトレーディングシステムです。トレーダーが必要とするのは、信号に従うことだけです。また、インジケーターはあなた自身の取引システムの基礎になることができます。取引はミニッツチャートでのみ行われます。 インジケーターがMTFの原則を使用しているという事実にもかかわらず、インジケーターのアルゴリズムは可能な限り安定しています。 購入後、必ず私に書いてください!私の取引設定と推奨事項をあなたと共有します!
NAM Order Blocks
NAM TECH GROUP, CORP.
5 (1)
MT4マルチタイムフレームオーダーブロック検出インジケーター。 特徴 -チャートコントロールパネルで完全にカスタマイズ可能で、完全な相互作用を提供します。 -必要な場所でコントロールパネルを表示および非表示にします。 -複数の時間枠でOBを検出します。 -表示するOBの数量を選択します。 -さまざまなOBユーザーインターフェイス。 -OBのさまざまなフィルター。 -OB近接アラート。 -ADRの高線と低線。 -通知サービス(画面アラート|プッシュ通知)。 概要 注文ブロックは、金融機関や銀行からの注文収集を示す市場行動です。著名な金融機関と中央銀行が外国為替市場を牽引しています。したがって、トレーダーは市場で何をしているのかを知る必要があります。市場が注文ブロックを構築するとき、それは投資決定のほとんどが行われる範囲のように動きます。 注文の構築が完了すると、市場は上向きと下向きの両方に向かって急激に動きます。注文ブロック取引戦略の重要な用語は、機関投資家が行っていることを含むことです。それらは主要な価格ドライバーであるため、機関投
FX Volume
Daniel Stein
4.6 (35)
mql5と Telegramの モーニング・ブリーフィングで、詳細とスクリーンショットを含む毎日のマーケット・アップデートをご覧 ください! FX Volumeは、ブローカーの視点から市場のセンチメントをリアルに洞察する、最初で唯一の出来高インジケーターです。 ブローカーのような機関投資家が外国為替市場でどのようなポジションをとっているか、COTレポートよりもはるかに速く、素晴らしい洞察を提供します。 この情報をチャート上で直接見ることは、あなたの取引にとって真のゲームチェンジャーであり、画期的なソリューションです。 以下のようなユニークなマーケットデータ洞察から利益を得てください。 比率は 、通貨のロングポジションとショートポジションの比率をパーセントで表示します。 比率の変化は 、選択した期間内のロング比率とその変化率を表示します。 Volumes Totalは 、通貨の取引量(ロングとショート)の合計をロット単位で表示します。 Volumes Long :全通貨のロングポジションの取引量を表示します。 Volumes(ショート )は、全通貨のショートポジションの取引量を表示
BullseyeSignal – NoRepaint は、名前が示すように、いかなる状況でも再描画されないシグナルです。シグナルは画像に表示された同じローソク足に表示されます。外為、暗号通貨、株式、指数、先物などの高ボラティリティ市場に最適です。 購入には緑の矢印、販売には赤の矢印のみが表示されますが、その背後にはより簡潔な取引体験を提供するために多くの指標が協力しています。 これは正確なエントリーを提供するために特別に設計されています。 多くのエントリーではなく、指標がトレンドの変化を示し、前のトレンドの反対方向に0レベルを超えたときに特定のエントリーを提供します。より正確な取引を実現するために、指標はトレンドの変化を確認するために最初のプルバックを待ち、偽の逆転を回避します。したがって、前のトレンドのブレイクとプルバックの確認後にシグナルが発行されます。 これは非常に慎重な取引アプローチです。 したがって、これらのヒントに従うことが重要です(初心者および上級トレーダーの両方がこの戦略を使用できます): ニューヨーク、ロンドン、または両市場の重複を使用することをお勧めします。
mql5と Telegramの モーニング・ブリーフィングで、詳細とスクリーンショットを含む毎日のマーケット・アップデートをご覧 ください! FX Power MT4 NGは 、長年の人気を誇る通貨強度計FX Powerの次世代モデルです。 この次世代ストレングスメーターは何を提供するのでしょうか?初代FXパワーの魅力すべて プラス GOLD/XAUの強さ分析 より正確な計算結果 個別に設定可能な分析期間 カスタマイズ可能な計算上限値により、さらに優れたパフォーマンスを実現 もっと見たい人のための特別なマルチインスタンス設定 すべてのチャートでお好みの色を無限に設定可能 数え切れないほどの通知オプションにより、重要なことを見逃すことはありません。 Windows 11とmacOSのスタイルで角を丸くした新しいデザイン 魔法のように動くインジケーターパネル FXパワーの主な機能 すべての主要通貨の強さの完全な履歴 すべての時間枠における通貨の強さの履歴 すべてのブローカーとチャートで同一の計算結果 100%信頼できるリアルタイム計算 -> リペイントなし ドロップダウン・リストから
TakePropips Donchian Trend Pro
Eric John Pajarillaga Aldana
4.82 (17)
TakePropips Donchian Trend Pro   (MT4) は、ドンチャン チャネルを使用してトレンドの方向を自動的に検出し、エントリーとエグジットの取引シグナルを提供する強力で効果的なツールです! この多機能インジケーターには、トレンド スキャナー、取引シグナル、統計パネル、スクリーナー、取引セッション、およびアラート履歴ダッシュボードが含まれます。取引シグナルを提供し、チャートを分析する時間を節約するように設計されています! ユーザー マニュアルとインストール ガイドは、ブログ投稿 (   https://www.mql5.com/en/blogs/post/751368   ) からダウンロードできます。 今日は 50% オフ! 98ドルから49ドルに値下げ! このインジケーターは、ストラテジー テスターでテストできます (ビジュアル モードを有効にします)。 詳細については、説明の下にあるビデオ チュートリアルも利用できます。 ご不明な点やサポートが必要な場合は、私に連絡してください。 TakePropips Donchian Trend Pro イン
Break and Retest
Mohamed Hassan
4.43 (14)
New update to V.4 where  Break & Retest automatically draws the take profit & stop loss levels and you also have more signals per day! ‍You can visually backtest Break & Retest to see how it behaved in the past!     Manual guide:   Click here $60 for a very limited time. Next price is $120   This Indicator only places quality trades when the market is really in your favor with a clear break and retest. Patience is key with this price action strategy! If you want more alert s
PRO Renko Systemは、特別にRENKOチャートを取引するために設計された高精度の取引システムです。 これは、様々な取引商品に適用することができる普遍的なシステムです。 システムは効果的に正確な逆転信号へのアクセスを与えるいわゆる市場の騒音を中和する。 表示器は非常に使いやすく、信号の生成に責任がある1つの変数だけがあります。 あなたは簡単にお好みの任意の取引ツールとレンコバーのサイズにツールを適応させることができます。 私はいつもあなたが私のソフトウェアで収益性の高い取引を支援するために余分なサポートを提供する準備ができています! 私はあなたに幸せで収益性の高い取引をしたいです! ご購入後にご連絡ください! 私はあなたに私のレンコチャートジェネレータを送信します。 私はまた、私の個人的な推奨事項やシステムの他のモジュールを無料で共有します!
現在31%オフ! 初心者やエキスパートトレーダーに最適なソリューション! このインジケータは、独自の機能と秘密の数式を組み込んだ、ユニークで高品質かつ手頃な価格のトレーディングツールです。たった1枚のチャートで28の通貨ペアのアラートを表示します。新しいトレンドやスキャルピングチャンスの引き金となるポイントを正確に把握することができるので、あなたのトレードがどのように改善されるか想像してみてください! 新しい基本的なアルゴリズムに基づいて構築されているため、潜在的な取引の特定と確認がより簡単になります。これは、通貨の強さや弱さが加速しているかどうかをグラフィカルに表示し、その加速のスピードを測定するためです。加速すると物事は明らかに速く進みますが、これはFX市場でも同じです。つまり、反対方向に加速している通貨をペアにすれば、利益を生む可能性のある取引を特定することができるのです。 通貨の勢いを示す縦の線と矢印は、あなたの取引の指針となるでしょう。 ダイナミックマーケットフィボナッチ23レベルはアラートトリガーとして使用され、市場の動きに適応します。もしインパルスが黄色
TrendDecoder Premium
Christophe Pa Trouillas
5 (5)
レンジと次の動きを特定    |  トレンドの最も早いシグナルと強さを得る   |  反転の前に明確な出口を得る   |  価格がテストするフィボ・レベルを見つける。 非リペイント、非遅延インディケータ - マニュアルおよび自動売買に最適 - すべての資産、すべての時間単位に対応 期間限定キャンペーン   >> 50%OFF 購入後、 推奨セッティングについては、このチャンネルで私に連絡してください。 MT5 バージョン: ここをクリック BladeSCALPER   と   PowerZONES   を使った完全な方法を入手する どのようなものですか? TrendDECODERは、トレンド監視をシンプルかつ簡単にするための複数のイノベーションを集約したものです。 Projective TrendLine (投影トレンドライン) - 今後のトレンドのスピードリファレンス。 RealTime TrendLine vs. Projective TrendLine (リアルタイムトレンドライン vs. Projective TrendLine) - 市場が同じ方
TrendMaestro
Stefano Frisetti
5 (3)
note: this indicator is for METATRADER4, if you want the version for METATRADER5 this is the link:  https://www.mql5.com/it/market/product/108106 TRENDMAESTRO ver 2.4 TRENDMAESTRO recognizes a new TREND in the bud, he never makes mistakes. The certainty of identifying a new TREND is priceless. DESCRIPTION TRENDMAESTRO identifies a new TREND in the bud, this indicator examines the volatility, volumes and momentum to identify the moment in which there is an explosion of one or more of these data a
作者のその他のプロダクト
RaysFX (Average Directional Movement Index) Technical indicator (ADX) helps to determine the market trend. It was developed and described in detail by Welles Wilder. The simplest trading method based on the system of directional movement implies comparison of two direction indicators: the 14-period +DI one and the 14-period -DI. To do this, one either puts the charts of indicators one on top of the other, or +DI is subtracted from -DI. W. Wilder recommends buying whenever the +DI crosses ab
RaysFX Supertrend + Alert RaysFX Supertrend è un indicatore di tendenza superiore progettato per i trader che desiderano avere un vantaggio nel mercato. Questo indicatore utilizza una combinazione di CCI (Commodity Channel Index) e ATR (Average True Range) per identificare le tendenze del mercato e fornire segnali di trading accurati. Caratteristiche principali Indicatori CCI e ATR: Utilizza due degli indicatori più popolari e affidabili per identificare le tendenze del mercato e generare segnal
FREE
Il nostro Indicatore Combinato RaysFX CCI-RSI è uno strumento unico che combina due dei più popolari indicatori di analisi tecnica: l’Indice di Forza Relativa (RSI) e l’Indice del Canale delle Materie Prime (CCI). Caratteristiche : Combinazione di CCI e RSI : L’indicatore calcola la differenza tra i valori di CCI e RSI per ogni barra del grafico. Media Mobile Semplice (SMA) : L’indicatore calcola una SMA su queste differenze e traccia due linee sul grafico. Segnali di trading : Ogni volta che qu
FREE
RaysFX Stochastic  L'indicatore RaysFX Stochastic è un indicatore personalizzato per la piattaforma MetaTrader 4. Caratteristiche principali: -Indicatori separati: L'indicatore viene visualizzato in una finestra separata sotto il grafico principale. -Livelli dell'indicatore: L'indicatore ha due livelli predefiniti, 20 e 80, che possono essere utilizzati come livelli di ipervenduto e ipercomprato. -Buffer dell'indicatore: L'indicatore utilizza quattro buffer per calcolare e memorizzare i suo
FREE
RaysFX StepMA+Stoch  Caratteristiche Principali Adattabilità: Il nostro indicatore RaysFX StepMA+Stoch è progettato per adattarsi alle mutevoli condizioni di mercato. Utilizza l’Average True Range (ATR) per misurare la volatilità del mercato e regolare di conseguenza le sue strategie di trading. Precisione: L’indicatore genera segnali di trading quando la linea minima incrocia la linea media. Questi segnali sono rappresentati come frecce sul grafico, fornendo punti di ingresso e di uscita chiari
FREE
Questo indicatore fractal ti invierà un messaggio telefonico (tramite app mt4) non è necessaria la configurazione dell'indicatore, basta impostare l'ID del tuo smartphone e potrai ricevere il messaggio BUY o SELL in tempo reale (affidabilità 80%) per qualsiasi domanda o dubbio non esitate a contattarmi su mql5.com o telegram (link al gruppo disponibile in bio)
RaysFX   EMA  Crossover Scopri i potenziali punti di inversione del mercato con l’indicatore di Crossover EMA di RaysFX. Questo indicatore utilizza una combinazione di due medie mobili esponenziali (EMA) - una più veloce e una più lenta - per identificare i possibili punti di ingresso e uscita. Caratteristiche principali : Due EMA : Utilizza una EMA più veloce e una più lenta per catturare i movimenti di mercato a breve e lungo termine. Segnali di crossover : Genera un segnale quando l’EMA più v
FREE
RaysFX StochRSI Presentiamo un indicatore MQL4 sviluppato da RaysFX, un rinomato sviluppatore nel campo del trading algoritmico. Questo indicatore è una combinazione semplice ma potente di due indicatori popolari: RSI e Stocastico. Caratteristiche principali: RSI : Un indicatore di momentum che misura la velocità e il cambiamento dei movimenti dei prezzi. Stocastico : Un indicatore di momentum che confronta il prezzo di chiusura di un titolo con la gamma dei suoi prezzi durante un certo periodo
FREE
RaysFX Strategy è un sofisticato strumento di trading che genera segnali di ACQUISTO e VENDITA basati su una combinazione di quattro indicatori tecnici: 3 SMA (Simple Moving Average), 1 StochasticRSI , 1 Choppy, e 1 DeMarker. Only M1 TimeFrame! **Segnale di VENDITA** Quando la candela precedente è sotto i 3 SMA, sopra il livello 80 dello Stochastic, sotto il livello 38 del Choppy e sopra il livello 0.3 del DeMarker, l'indicatore genera un segnale di VENDITA, rappresentato da una freccia rossa.
Questa utility di base non agisce in automatico, ma supporterà il trader, ti aiuterà nella gestione dei lotti tramite: possibilità di impostare la size possibilità di   impostare TP e SL (in pip) Consiglio: Questo EA ti aiuterà nella gestione dei tuoi ordini ed è  ottimo abbinarlo a delgi indicatori (trovate nel nostro store molti indicatori utili, fra cui il RaysFX Strategy )
What Is MT4 Candlestick Pattern Indicator Candlestick patterns are groups of candlestick that have a meaning for the trader. These groups are usually composed of two, three, four, or five candles and indicate some form of price action happening. In many cases traders use these patterns to decide what to do next. Candlestick Pattern Indicator for MT4 is a plugin that allows you to see the most common candlestick patterns on your chart. The indicator scans the chart and detects popular patterns, m
Tra le tecniche alternative di trading più utilizzate dagli investitori, uno spazio interessante va dato alla   strategia Ichimoku cloud   che si basasulle nuvole (kumo). Queste ultime sono il vero fulcro del sistema di trading Hichimoku Kinko Hyo. Molti erroneamente pensano che l’Ichimoku Kinko Hyo sia un semplice indicatore trend following, mentre invece è un vero e proprio   sistema di trading completo . Infatti   grazie a UN SOLO grafico (sia pure molto complesso) ci dà una visione complet
Questo indicatore è studiato per analizzare: Lo Stochastic Oscillators , la Moving Averages , il MACD , il crossover MA , e per finire i Parabolic SAR. Il tutto viene racchiuso in un grafico che indicherà con frecce e spettri il momento ideale per aprire un trade. "La precisione dei segnali dipende sempre dai valori impostati, con i valori stock si ha un ottima affidabilità "
Trade Assistant MetaTrader indicator  — a multi-timeframe indicator that is based on three standard indicators:   Stochastic oscillator ,   RSI   (Relative Strength Index), and   CCI   (Commodity Channel Index). It displays current trend directions for M1, M5, M15, M30, H1, H4, D1, W1, and MN1 timeframes. When you follow such an indicator you have a clear picture of the trends across all important timeframes. It doesn't matter which timeframe you attach this indicator to. The indicator can be d
Delfino V6 è un bot progettato da  @xhunterx86 in collaborazione con noi di RaysFX  per operare in modo automatizzato sul mercato finanziario. Questo EA è specializzato nelle principali coppie valutarie che si trovano in fase di lateralizzazione, utilizzando una strategia che si focalizza sulle condizioni di mercato senza tendenza. Utilizzando algoritmi e criteri specifici, Delfino V6  è progettato per identificare opportunità di trading in mercati stabili e laterali. A differenza
RaysFX  Donchian Channel Questo indicatore può essere utile per identificare i livelli di supporto e resistenza, nonché per visualizzare visivamente la gamma di prezzo di un determinato periodo. Variabili Valore Periodo 20 TimeFrame Current Mode High/Low(true) o Close (false) Modalità true Telegram:  https://t.me/SmartSaverOfficial Store:  https://www.mql5.com/it/users/rays96/seller Questo indicatore è stato Progettato da RaysFX
RaysFX TMAT3 è uno strumento potente che combina due tipi di medie mobili per aiutarti a identificare e seguire le tendenze del mercato. L’indicatore utilizza una media mobile triangolare centrata (TMA) e un T3 Moving Average. Queste due medie mobili lavorano insieme per fornire segnali di trading chiari e tempestivi. Quando il T3 Moving Average è inferiore alla TMA, l’indicatore considera che la tendenza del mercato sia al rialzo e genera un segnale di acquisto. Al contrario, quando il T3 Movin
RaysFX Forcaster è un indicatore avanzato per MetaTrader 4, progettato per fornire previsioni accurate del mercato. Questo indicatore utilizza un algoritmo sofisticato per calcolare i valori futuri basandosi su una serie di parametri configurabili dall'utente. Caratteristiche principali: - TimeFrame : Permette all'utente di impostare il timeframe desiderato. Supporta diversi timeframes come M1, M5, M15, M30, H1, H4, D1, W1 e MN. - HalfLength : Questo parametro determina la lunghezza della met
RaysFX Engulfing RaysFX   Engulfing  è uno strumento potente per identificare i pattern di engulfing nel mercato Forex. Questi pattern sono segnali di inversione di tendenza che possono fornire opportunità di trading preziose. Caratteristiche principali : Rilevamento di pattern engulfing : L’indicatore identifica i pattern engulfing rialzisti e ribassisti, che sono segnali di possibili inversioni di tendenza. Segnali visivi : I pattern rilevati vengono evidenziati sul grafico con frecce blu e r
RaysFX DMI Presentiamo l’Oscillatore RaysFX DMI, un indicatore personalizzato per la piattaforma di trading MetaTrader 4. Questo indicatore unico è progettato per fornire segnali di trading chiari e precisi basati sull’Indice di Movimento Direzionale (DMI). Caratteristiche principali: Oscillatore DMI:   Calcola un oscillatore DMI basato su un periodo DMI specificato e un metodo di media mobile. Smoothing:   L’oscillatore DMI viene ulteriormente lisciato in base a un periodo di lisciatura e a u
RaysFX Dynamic Cycle Explorer (DCE) RaysFX Dynamic Cycle Explorer (DCE) è un potente indicatore di trading sviluppato per la piattaforma MetaTrader 4. Progettato con l’obiettivo di fornire ai trader un vantaggio competitivo, DCE utilizza algoritmi avanzati per identificare e segnalare le opportunità di trading più promettenti. Caratteristiche principali Multi-periodo: DCE utilizza sei periodi diversi per calcolare i suoi segnali, offrendo una visione completa del mercato. Super Trend Price: DCE
RaysFX Candlestick Signals RaysFX Candlestick Signals è un potente strumento progettato per migliorare la tua esperienza di trading su MT4. Questo indicatore personalizzato è stato sviluppato con l’obiettivo di fornire segnali di trading precisi e tempestivi basati su specifiche configurazioni di candele e l’indicatore RSI. Caratteristiche principali : Segnali di acquisto e vendita : L’indicatore genera segnali di acquisto e vendita basati su specifiche configurazioni di candele e valori dell’
RaysFX Master Inside Bars Master Inside Bars : L’indicatore identifica una serie di “Inside Bars” consecutive, formando un “Master Inside Bar”. Puoi personalizzare il numero minimo di “Inside Bars” consecutive necessarie per formare un “Master Inside Bar”, così come il colore e la larghezza dell’istogramma del “Master Inside Bar”. Inside Bars : L’indicatore identifica le “Inside Bars”, candele che si trovano completamente all’interno dell’intervallo della candela precedente. Puoi personalizzare
RaysFX Auto Fibo RaysFX Auto Fibo v2.1 è un indicatore di trading essenziale per tutti i trader che utilizzano la piattaforma MetaTrader 4. Questo strumento automaticamente disegna i ritracciamenti di Fibonacci sul tuo grafico, risparmiando tempo e fatica. Caratteristiche principali: Disegno automatico : Non dovrai più tracciare manualmente i livelli di Fibonacci. L’indicatore lo fa per te, risparmiandoti tempo e garantendo precisione. Personalizzabile : Puoi personalizzare il colore, lo stile
RaysFX Reversal Bar RaysFX Reversal Bar è un potente strumento di trading progettato per la piattaforma MetaTrader 4. Questo indicatore è stato sviluppato per individuare le inversioni di mercato basate su un modello di candela specifico. Caratteristiche principali: Rilevamento di inversioni : L’indicatore cerca specifici modelli di inversione di 2 barre nel mercato. Questi modelli includono una barra rialzista seguita da due barre ribassiste per un segnale di acquisto, e una barra ribassist
RaysFX 3 Stoch! Sei un trader alla ricerca di un vantaggio competitivo? L’indicatore RaysFX 3 Stoch è l’aggiunta perfetta al tuo arsenale di trading.  Caratteristiche principali: Stocastico a 3 livelli : L’indicatore RaysFX 3 Stoch utilizza tre livelli di stocastico per fornire segnali di trading accurati e tempestivi. Personalizzabile : Puoi personalizzare i periodi di K, D e Slowing, così come i periodi dei tre stocastici, per adattarsi al tuo stile di trading. Allerta integrata : L’in
RaysFX Supertrend Bar RaysFX Supertrend Bar è un indicatore personalizzato per MetaTrader 4. Utilizza l'indice di canale delle materie prime (CCI) per generare segnali di trading. L'indicatore mostra dei puntini in una finestra separata sotto il grafico principale per indicare i segnali di trading. Caratteristiche principali: Calcola il CCI per diversi periodi temporali. Visualizza puntini per indicare i segnali di trading. Permette all'utente di modificare i periodi temporali e la distanza tra
RaysFX Candlestick Exit  Il RaysFX Candlestick Exit è un indicatore di trading avanzato progettato per i trader che desiderano avere un controllo preciso sulle loro uscite di trading. Questo indicatore utilizza una combinazione di tecniche di trading per fornire segnali di uscita accurati e tempestivi. Caratteristiche principali: Range : Questo parametro consente di impostare il range di candele considerate per il calcolo dell’indicatore. Shift : Questo parametro consente di spostare l’indicato
RaysFX Intraday Fibo RaysFX Intraday Fibo è un indicatore di trading Forex di alta qualità, progettato con precisione e attenzione ai dettagli. Questo indicatore è il risultato di anni di esperienza nel trading Forex e nella programmazione MQL4, ed è stato creato con l’obiettivo di fornire ai trader un vantaggio competitivo nel mercato. Caratteristiche principali: Precisione : L’indicatore RaysFX Intraday Fibo utilizza un algoritmo avanzato per identificare i punti di ingresso e di uscita ottima
RaysFX MACD Divergence Presentiamo RaysFX MACD Divergence, un indicatore di trading avanzato progettato per i trader moderni. Questo indicatore utilizza la divergenza MACD, uno dei metodi più affidabili nel mondo del trading, per fornirti segnali di trading precisi e tempestivi. Caratteristiche principali: Divergenza MACD: L’indicatore identifica e traccia le divergenze MACD, fornendo segnali di trading potenzialmente redditizi. Personalizzabile: Puoi personalizzare i parametri dell’EMA veloce
フィルタ:
レビューなし
レビューに返信