FX Correlation Matrix
- インディケータ
- INTRAQUOTES
- バージョン: 1.2
- アップデート済み: 1 5月 2024
- アクティベーション: 5
Exclusive Limited Time Offer! Grab this powerful indicator for a lifetime at just $65.
Open the power of precise decision-making with our revolutionary product, FX Correlation Matrix. This indicator is your key to understanding multiple FX currency pairs' positive and negative correlations at a glance, providing valuable insights to elevate your trading strategies.
Indicator Features:
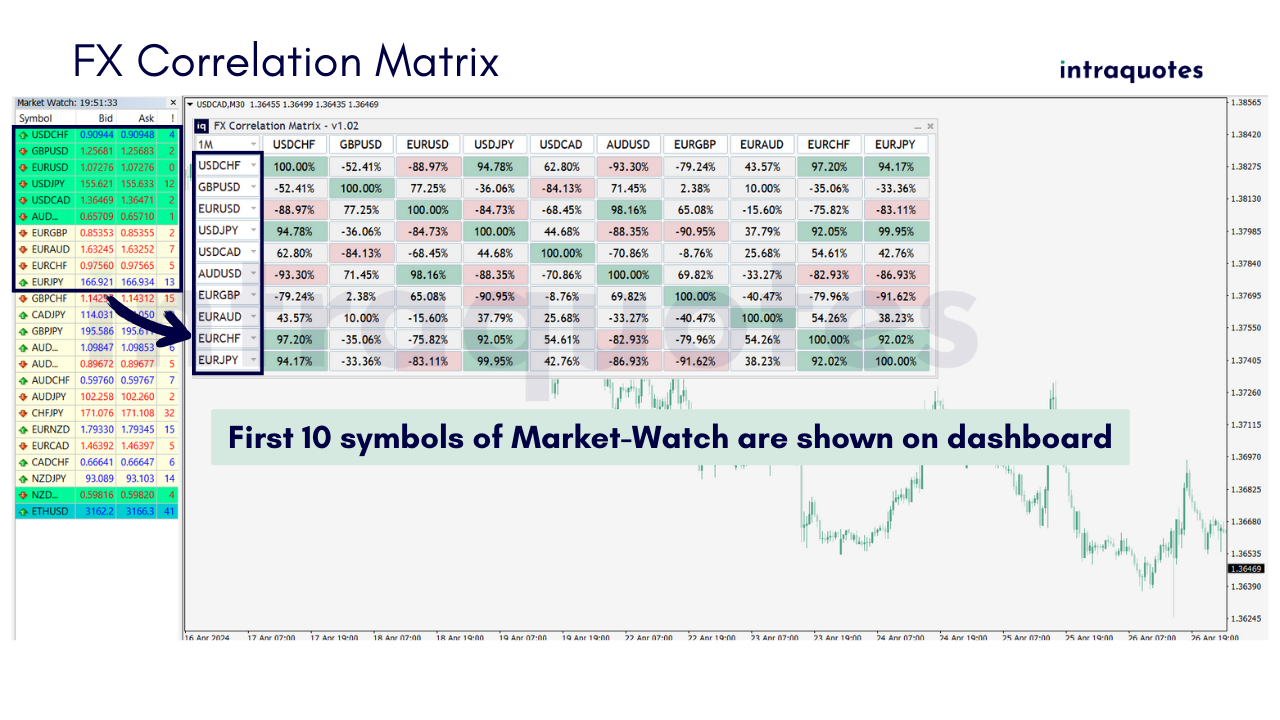
Multiple-Frame Multi-Currency Dashboard:
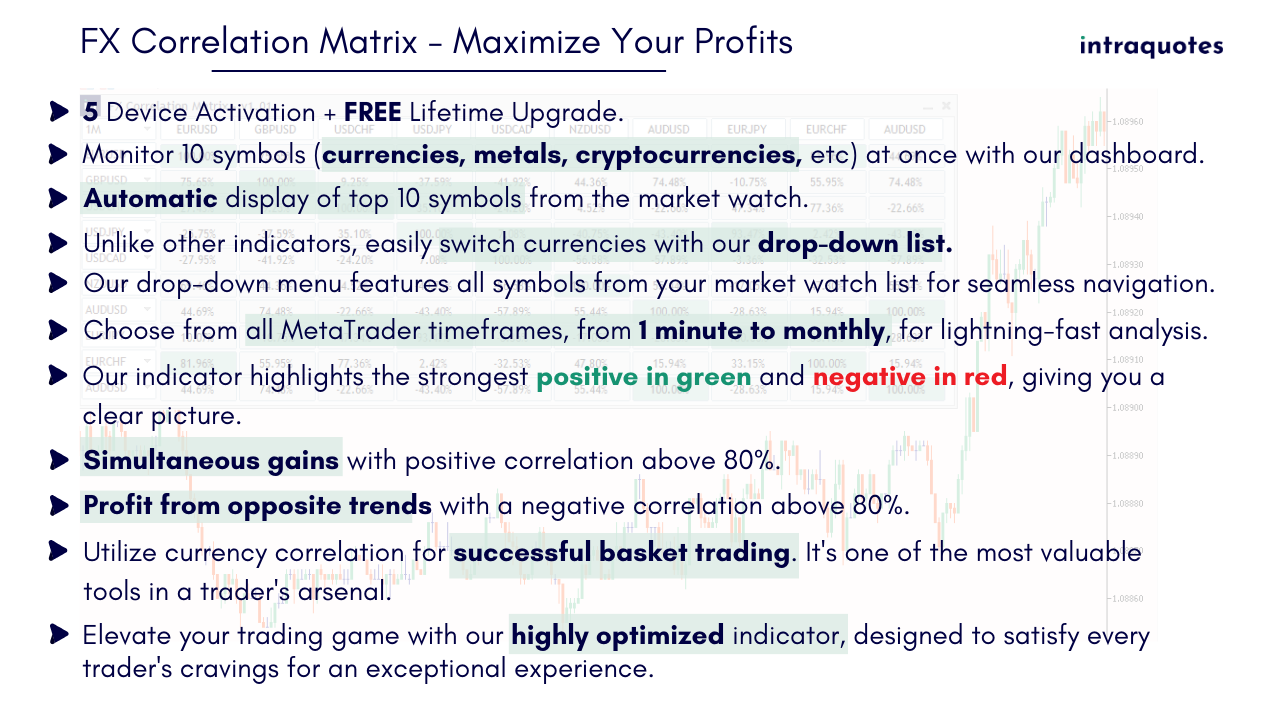
Displays 10 multiple currency pairs positive and negative correlation percentages simultaneously. Highlights the most positive and negative correlation percentages.
5 PC Activation for Multiple Brokers:
Enjoy the flexibility of using the Correlation Matrix on up to 5 different PCs across various brokers, ensuring seamless integration with your preferred trading platforms.
Eye-Pleasing Aesthetic Design:
Immerse yourself in a visually appealing dashboard that not only delivers crucial information but also enhances your overall trading environment.
User Convenience:
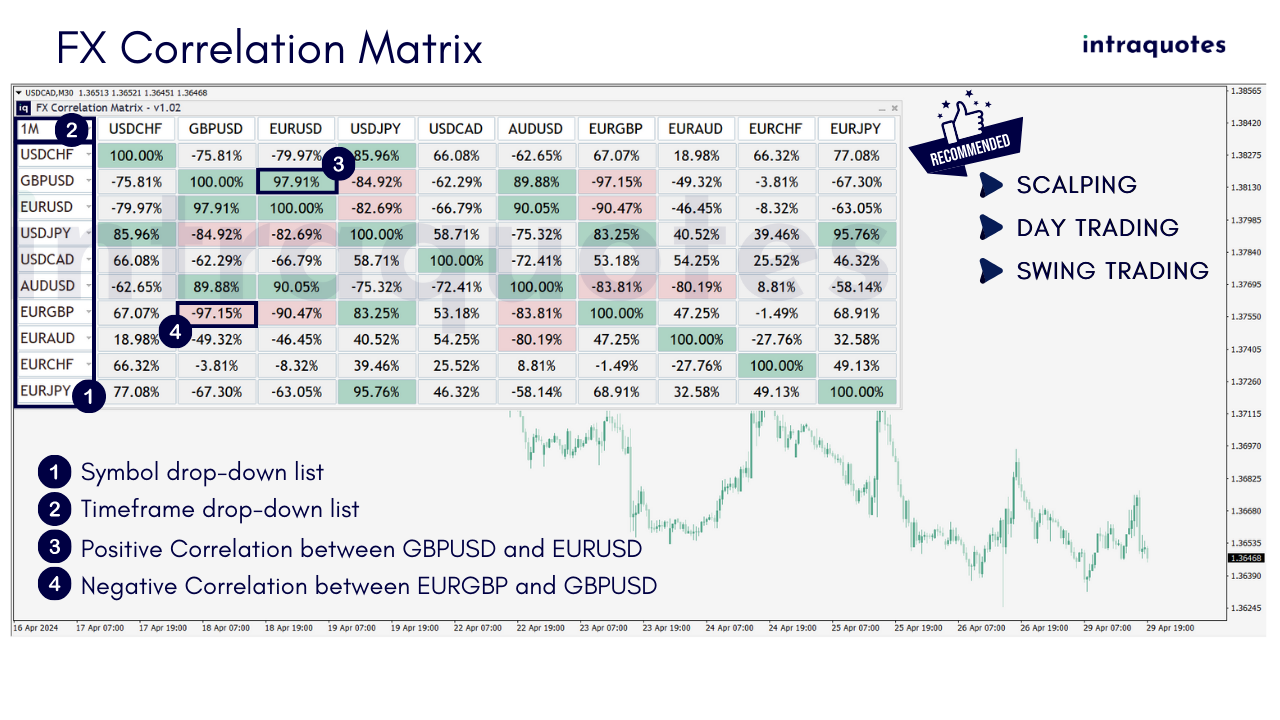
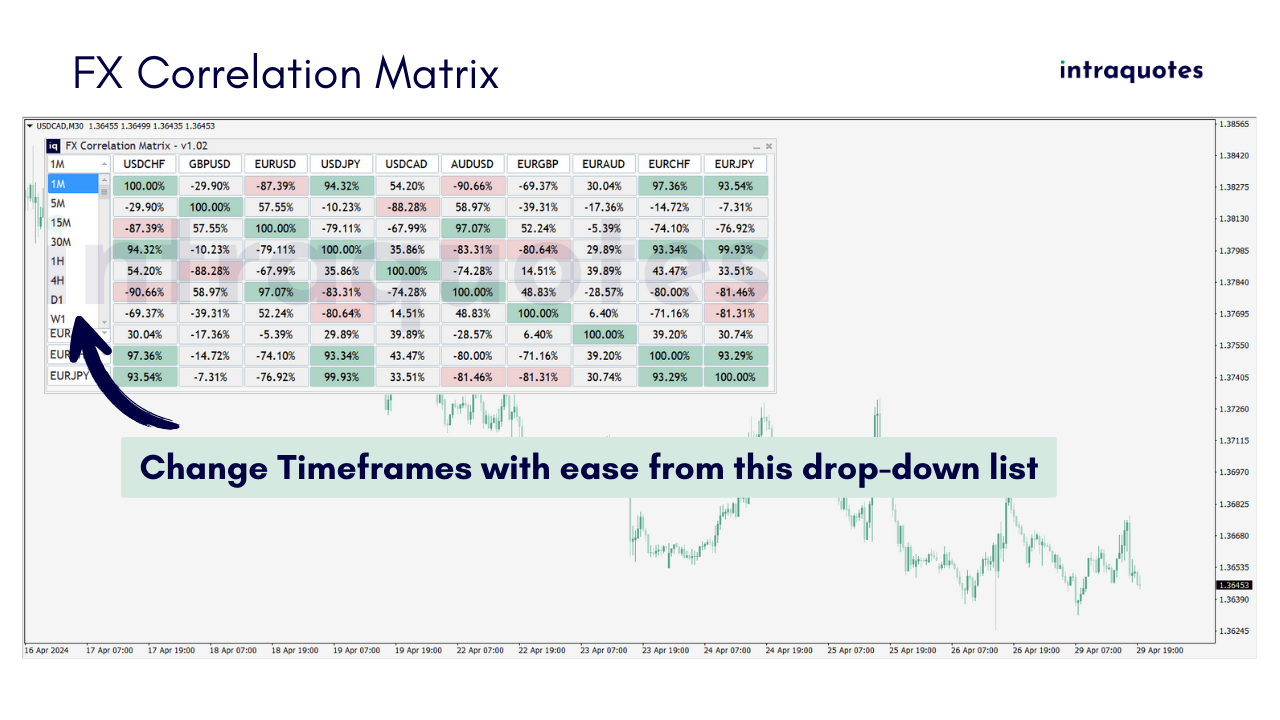
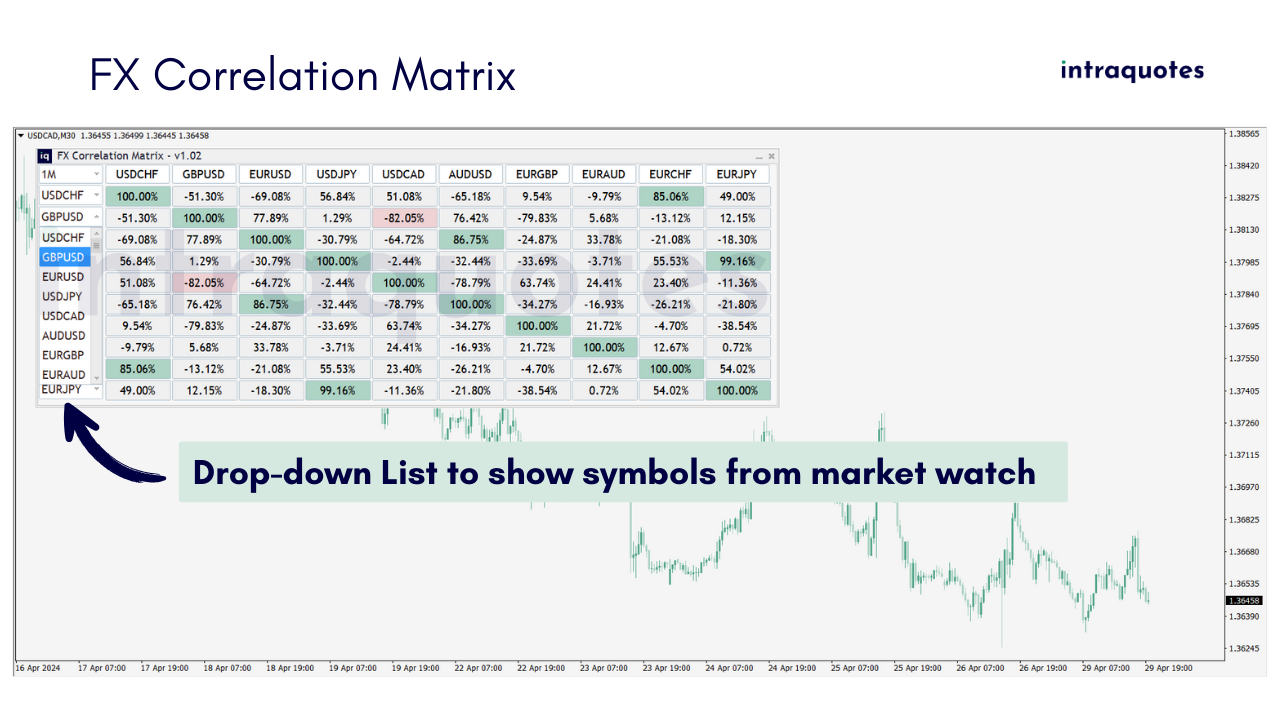
Experience ease of use with the ability to drag, move, and minimize the dashboard effortlessly. Change symbols and timeframes directly from convenient drop-down lists.
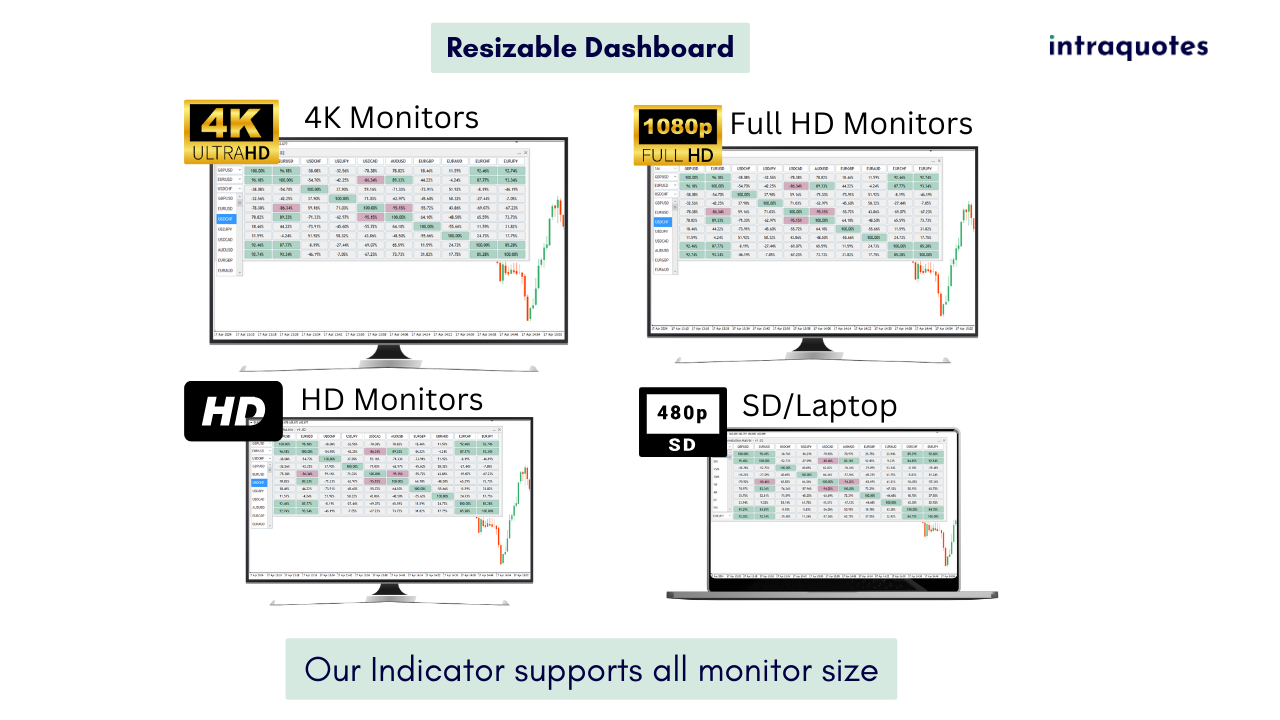
Adaptable Dashboard Sizes:
Tailor the dashboard to your preferences with multiple size options, ensuring compatibility with various monitor sizes, including HD and 4K monitors.
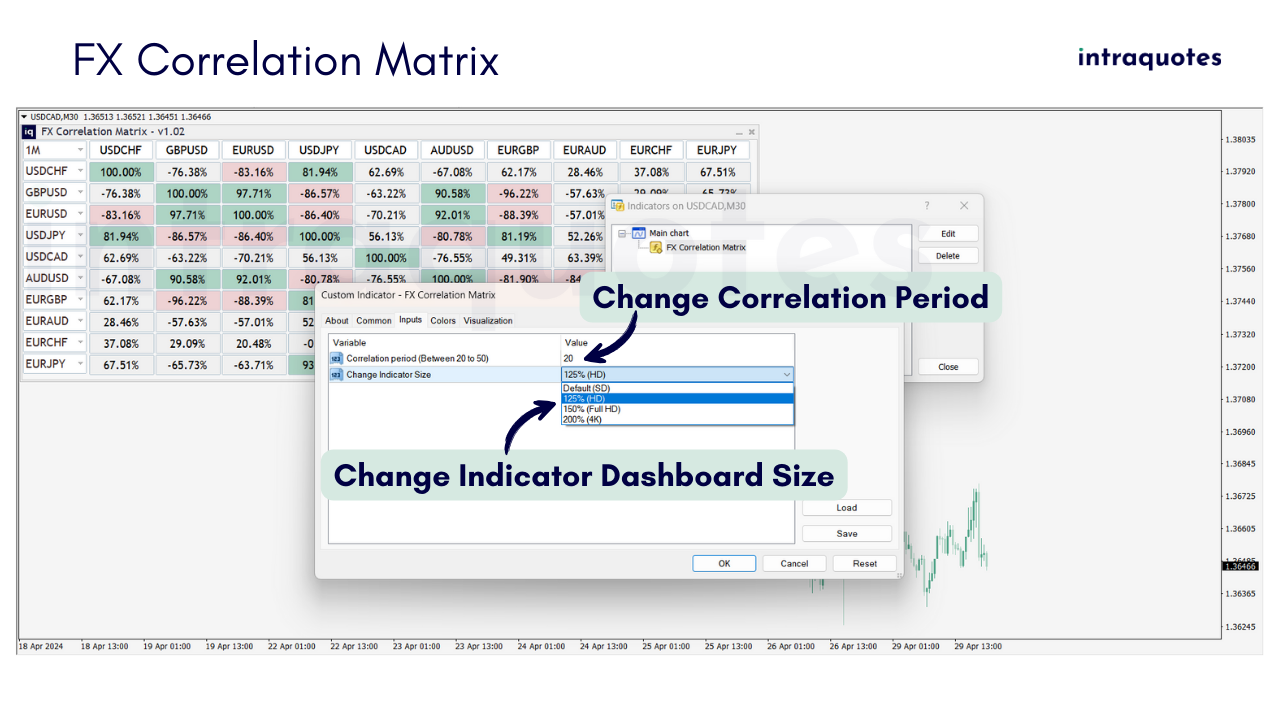
Indicator Settings:
Correlation Period: 20 (Default) (max 50 & min 20)
Change Indicator Size:
- Default (SD)
- 125% (HD)
- 150% (Full HD)
- 200% (4K)
Indicator Strategy:
Indicator shows how currencies are related.
Positive currency correlation means two currencies move in the same direction. For example, if EURUSD and GBPUSD have 80% positive correlation, and EURUSD goes down, GBPUSD also goes down like EURUSD 80% of the time.
Negative currency correlation means two currencies move in opposite directions. For example, if EURUSD and USDJPY have 80% negative correlation, and EURUSD goes up, USDJPY goes down 80% of the time.
Indicator Troubleshooting:
Issue with symbol order:
Symbols are displayed in reverse order and not starting from the first ten of the market list.
Solution:
This issue can differ from one broker to another. To address this, prioritize the symbols you frequently use for trading by placing them at the top of the Market Watch section. Conceal any unnecessary symbols to enhance indicator performance.
Loading data correctly on Indicator:
- Load all desired symbols in your market watch before applying the indicator.
- Ensure MetaTrader historical data is loaded for the chosen symbols in the chart.
- If encountering "Data not synchronized" issues, allow 5-10 minutes for your terminal to load, ensuring a seamless experience.
How to Do a Visual Backtest with Our Indicator:
Step 1: Download the entire history center database first. Press shortcut key F2 to access the History Center.
Step 2: Click on the download button.
Step 3: After the download completes, close, and restart the metatrader.
Possible Issues with Backtesting:
Problem 1:
You see a message that says "Waiting for update" on the chart while backtesting.
Solution:
This means that you don't have enough data or poor internet connection. To avoid this, make sure you download the full History Center data as explained above.
Problem 2:
Metatrader freezes during backtest.
Solution:
This also happens because of insufficient data or bad internet connection. Fix internet connection before starting and follow the steps again.
Contact us:
For any issues, bug reports, or suggestions, feel free to contact us, comment on the product page, or DM us. Your feedback is crucial for an exceptional experience.
Service Limitation:
It is requested that purchases must be refrained from if the buyer is from India, Bangladesh, or Pakistan, as developer support for these regions is unavailable due to legal restrictions.
Risk Disclosure:
Our indicator doesn't guarantee future profits or losses. Trade responsibly, understanding that IntraQuotes or program developer is not liable for any incurred losses or the precision of signals. Our product serves as visual guidance, adding value to informed trading decisions.
Copyright © INTRAQUOTES a brand of Taracode International.
Related to:
Trend analysis, multiple timeframe trend analysis, candlestick charts, bar chart, trend dashboard, scalping, day trading, position trading, swing trading, trade following, trend riding, indicator, trend following, trend reversal, MetaTrader software, currency pairs, market analysis, chart window, mobile alert, trading strategy, multiple timeframe, dashboard, 4K monitors, currency correlation dashboard.