Live Trade Status
- インディケータ
- INTRAQUOTES
- バージョン: 1.4
- アップデート済み: 2 5月 2024
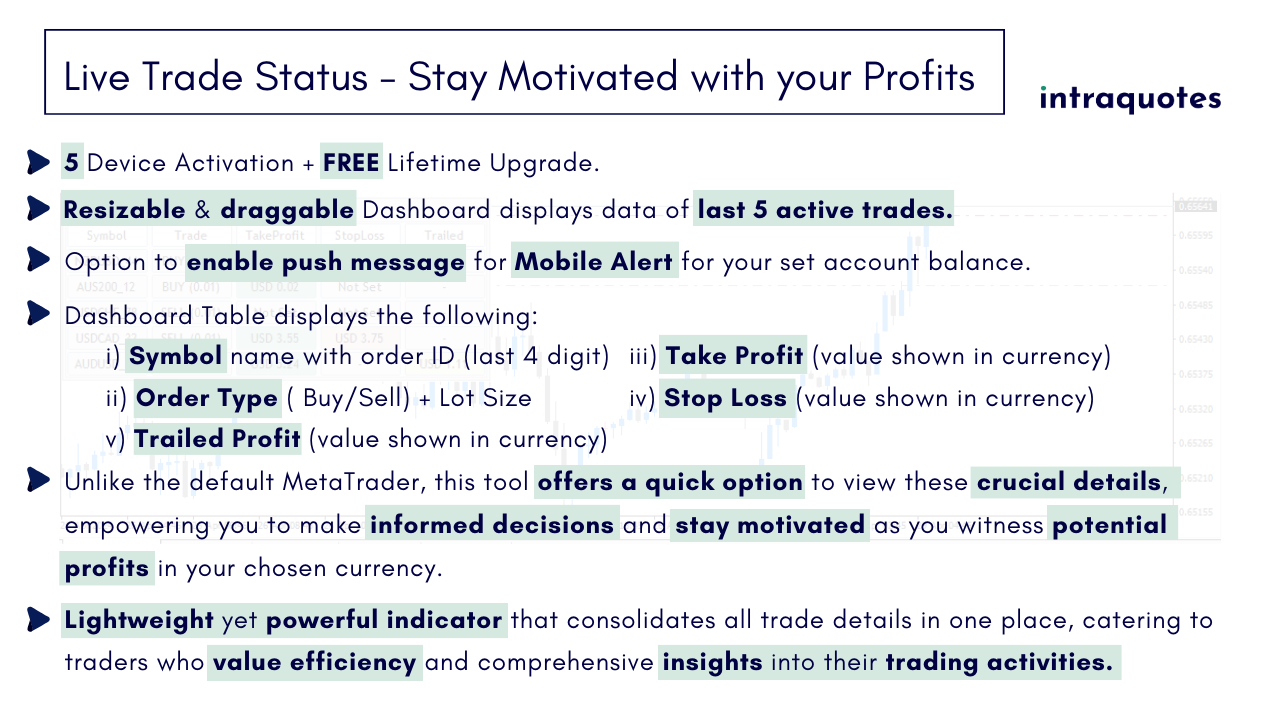
- アクティベーション: 5
Exclusive Limited Time Offer! Grab this useful indicator for a lifetime at just $49.
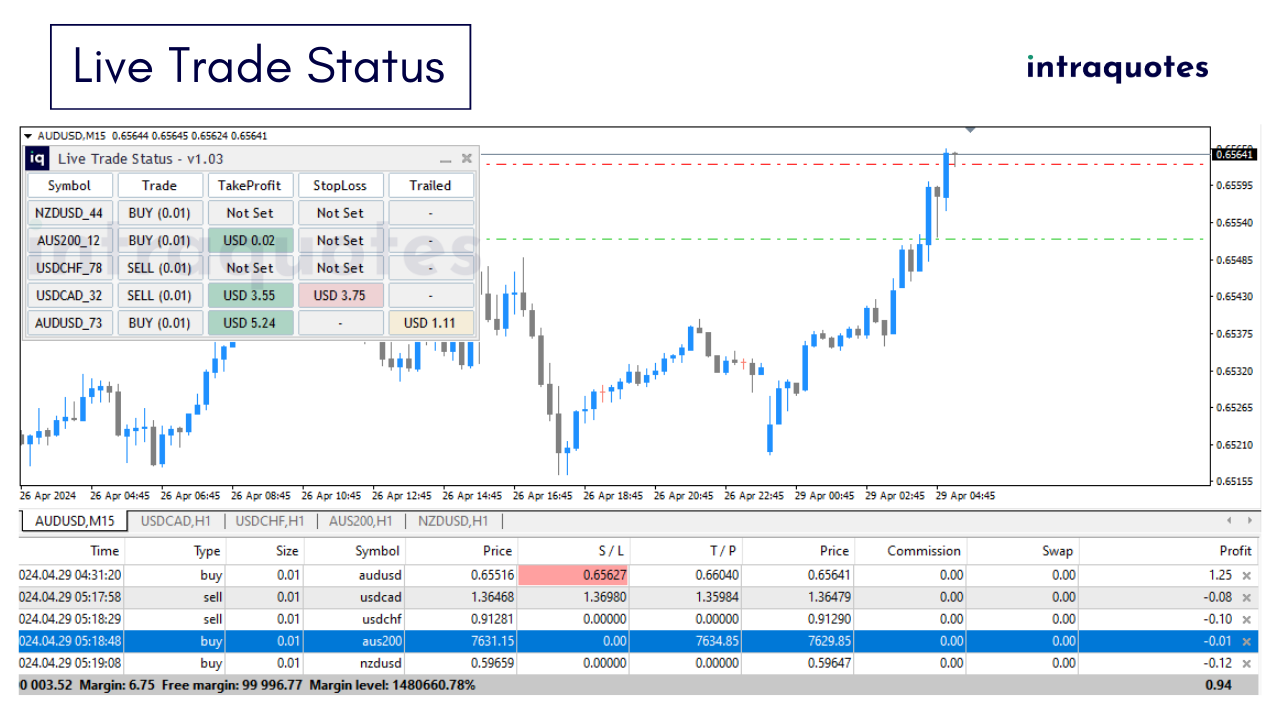
Enhance your trading experience with this amazing Metatrader indicator that tracks your live trade status. The indicator displays live take profit, stop loss & trailed stop loss, or trailed profit value with the best dashboard with account balance alert.
Indicator Features:
Trade Details
The indicator shows the last 5 active trades data in chronological order. Don't miss this opportunity to get your copy today!
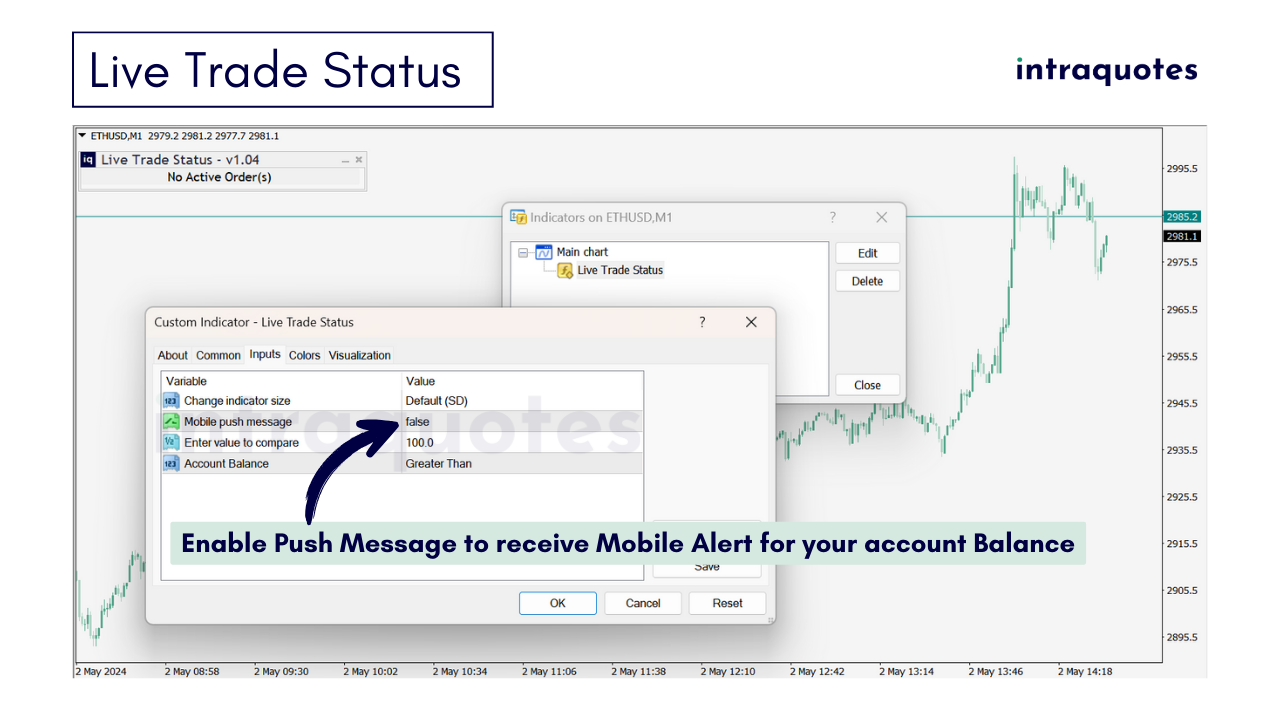
Alert System
Set up a custom alert for your account balance. You can choose any amount you want to be notified about. Receive the alert on your mobile phone as a push notification.
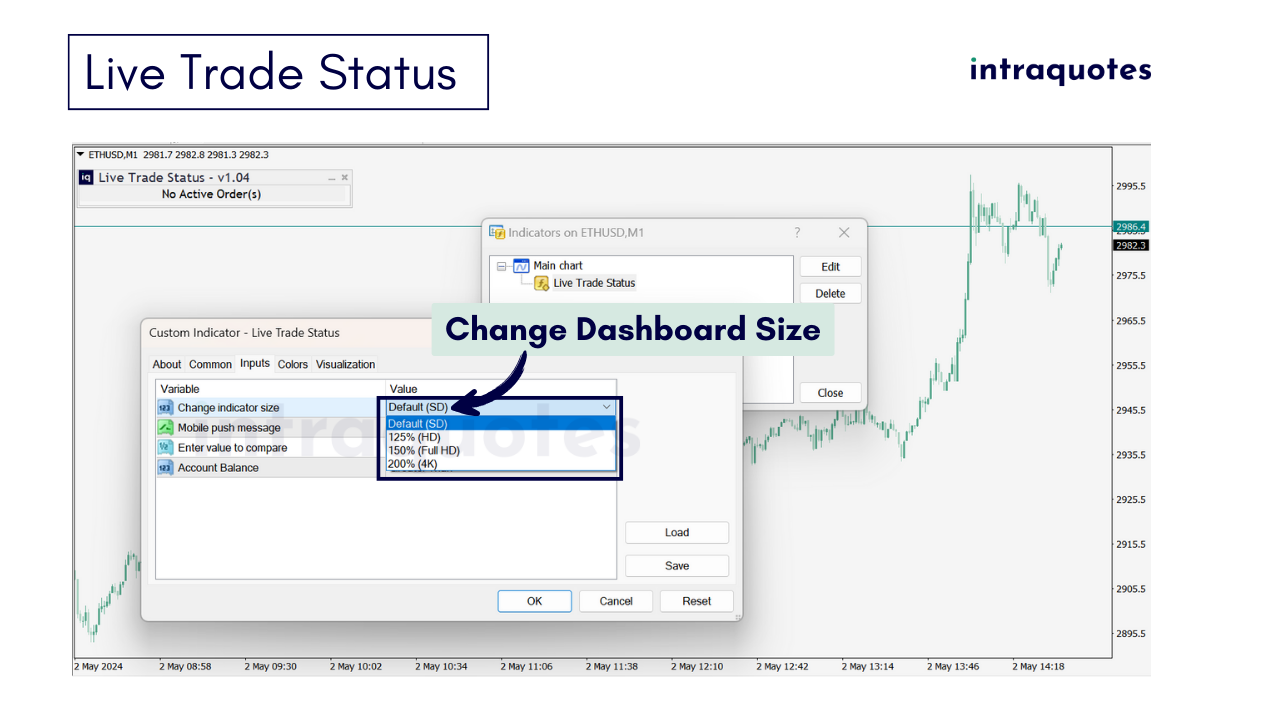
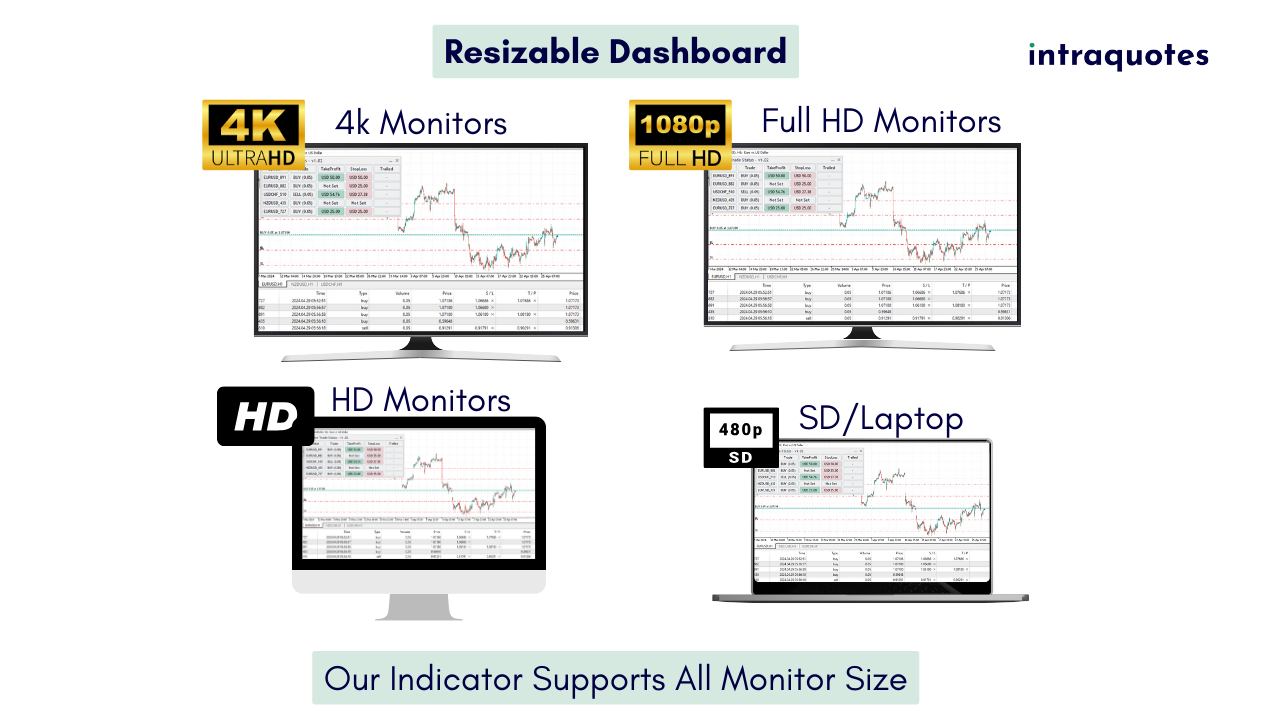
Dashboard Customization
Move the indicator dashboard anywhere on the chart, minimize it, restore it, and resize it according to your preference with just a single click. The indicator fully supports 4K monitors.
Indicator Settings:
Change Indicator Size:
- Default (SD)
- 125% (HD)
- 150% (Full HD)
- 200% (4K)
Mobile Push Message: True / False (Default)
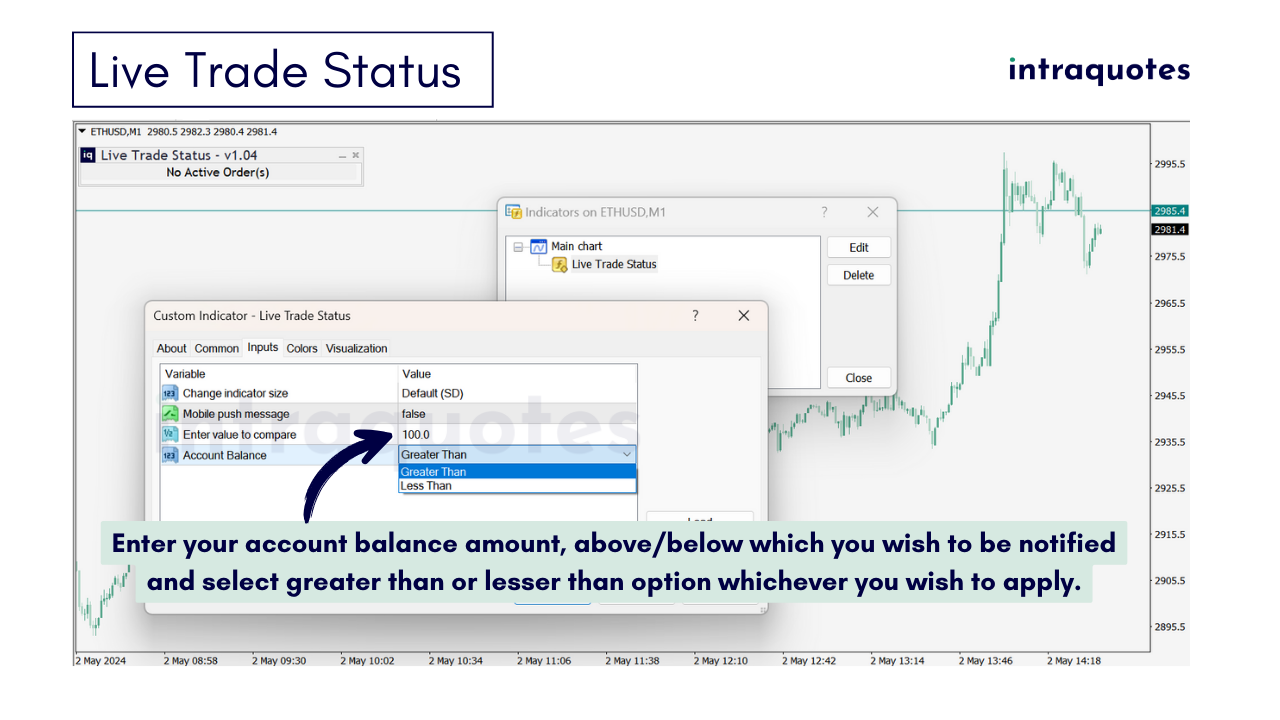
Enter Compare Value: 100 (default)
Enter any number up to 2 decimal. Be default 100 given that means if account balance goes above or below 100, we will receive a notification on mobile.
Account Balance:
- Greater Than (default)
- Less Than
User can select any option to compare the account balance.
Indicator Strategy:
As the indicator shows take profit, stop loss & trailed profit amount for 5 active trades, its very useful in scalping, day trading, position trading to monitor the trade profit loss parameters and helps to make sound decisions.
Indicator Troubleshooting:
To get mobile alerts from Metatrader Desktop:
Choose Tools -> Options from the Menu.
Click on the Notification Tab. Turn on Push notification. Enter your Metaquotes ID (You can see this ID in your mobile metatrader app settings) and then press Test.
How to Do a Visual Backtest with Our Indicator:
Step 1: Download the entire history center database first. Press shortcut key F2 to access the History Center.
Step 2: Click on the download button.
Step 3: After the download completes, close, and restart the metatrader.
Possible Issues with Backtesting:
Problem 1:
You see a message that says "Waiting for update" on the chart while backtesting.
Solution:
This means that you don't have enough data or poor internet connection. To avoid this, make sure you download the full History Center data as explained above.
Problem 2:
Metatrader freezes during backtest.
Solution:
This also happens because of insufficient data or bad internet connection. Fix internet connection before starting and follow the steps again.
Contact us:
For any issues, bug reports, or suggestions, feel free to contact us, comment on the product page, or DM us. Your feedback is crucial for an exceptional experience.
Service Limitation:
It is requested that purchases must be refrained from if the buyer is from India, Bangladesh, or Pakistan, as developer support for these regions is unavailable due to legal restrictions.
Risk Disclosure:
Our indicator doesn't guarantee future profits or losses. Trade responsibly, understanding that IntraQuotes or program developer is not liable for any incurred losses or the precision of signals. Our product serves as visual guidance, adding value to informed trading decisions.
Copyright © INTRAQUOTES a brand of Taracode International.
Related to:
Trend analysis, multiple timeframe trend analysis, candlestick charts, bar chart, trend dashboard, scalping, day trading, position trading, swing trading, trade following, trend riding, indicator, trend following, trend reversal, MetaTrader software, currency pairs, market analysis, chart window, mobile alert, trading strategy, multiple timeframe, dashboard, 4K monitors, risk disclosure, market price action, trading decisions, lag-free, range-bound conditions, bearish signal, bullish signal, correction, higher highs, lower lows, entry signals, downtrend, uptrend, manual, strategy examples, legal restrictions, responsible trading, eurusd, gbpusd,bitcoin, take profit, stop loss, trailed profit, trailed stop loss, trade analysis, trade analyzer.