Volatility Master
- インディケータ
- INTRAQUOTES
- バージョン: 1.3
- アップデート済み: 1 5月 2024
- アクティベーション: 5
Exclusive Limited Time Offer! Grab this useful indicator for a lifetime at just $49.
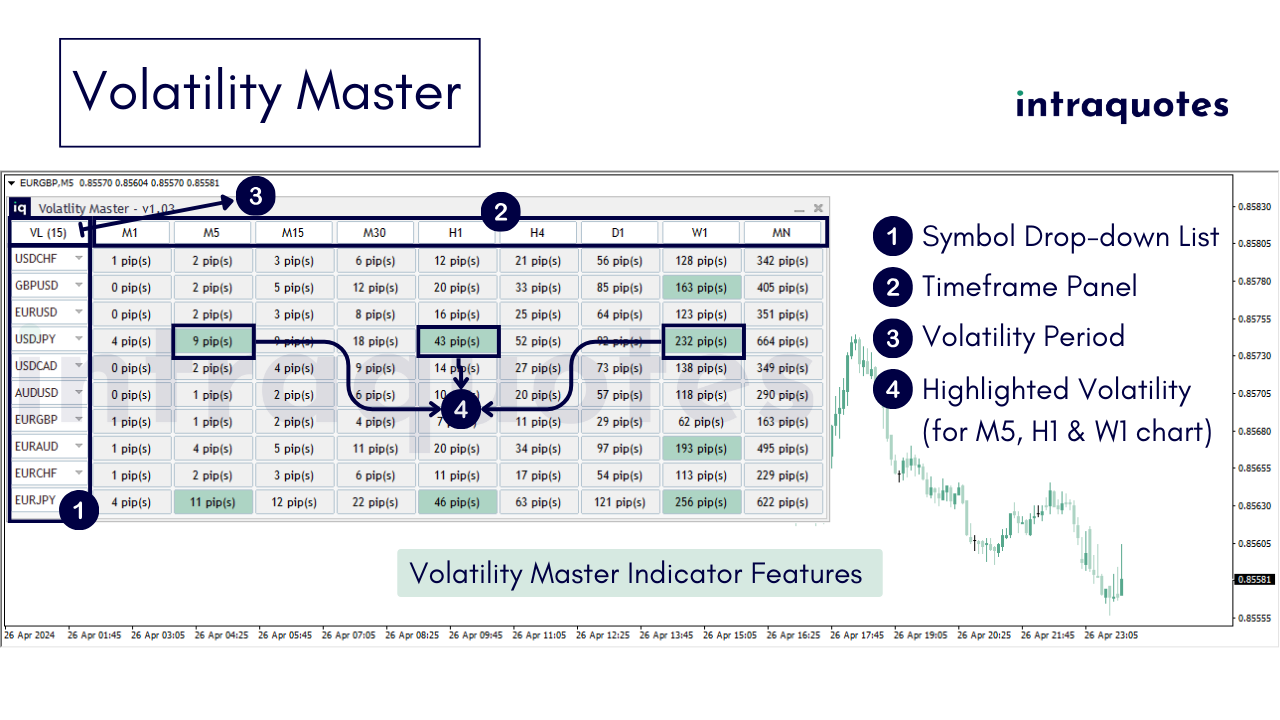
Volatility indicator dashboard designed to revolutionize how traders perceive and navigate market volatility. Track volatile for multiple currency pairs one at time for multiple timeframes. Works best with Forex Market, Gold, Silver, Oil. Available in MT4, MT5.
Indicator Features:
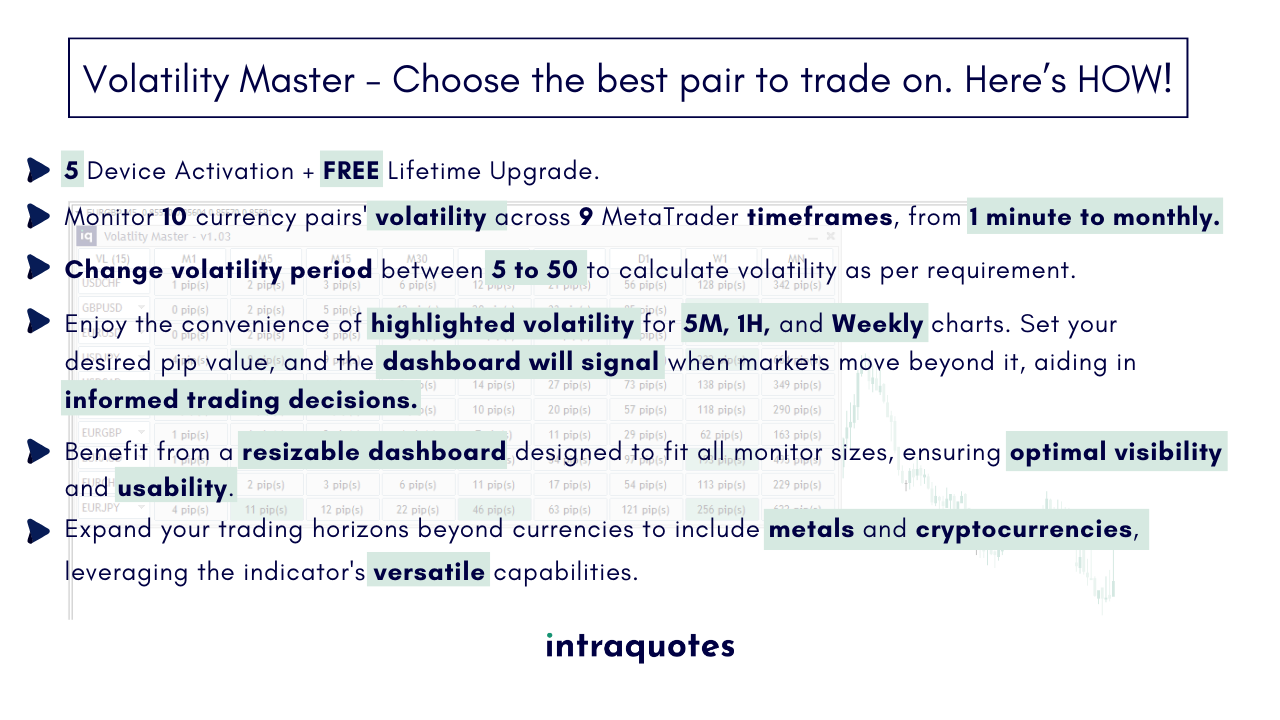
Gain a strategic advantage by simultaneously monitoring volatility across various currencies and timeframes. Identify the most promising pairs to trade and optimize your trading decisions.
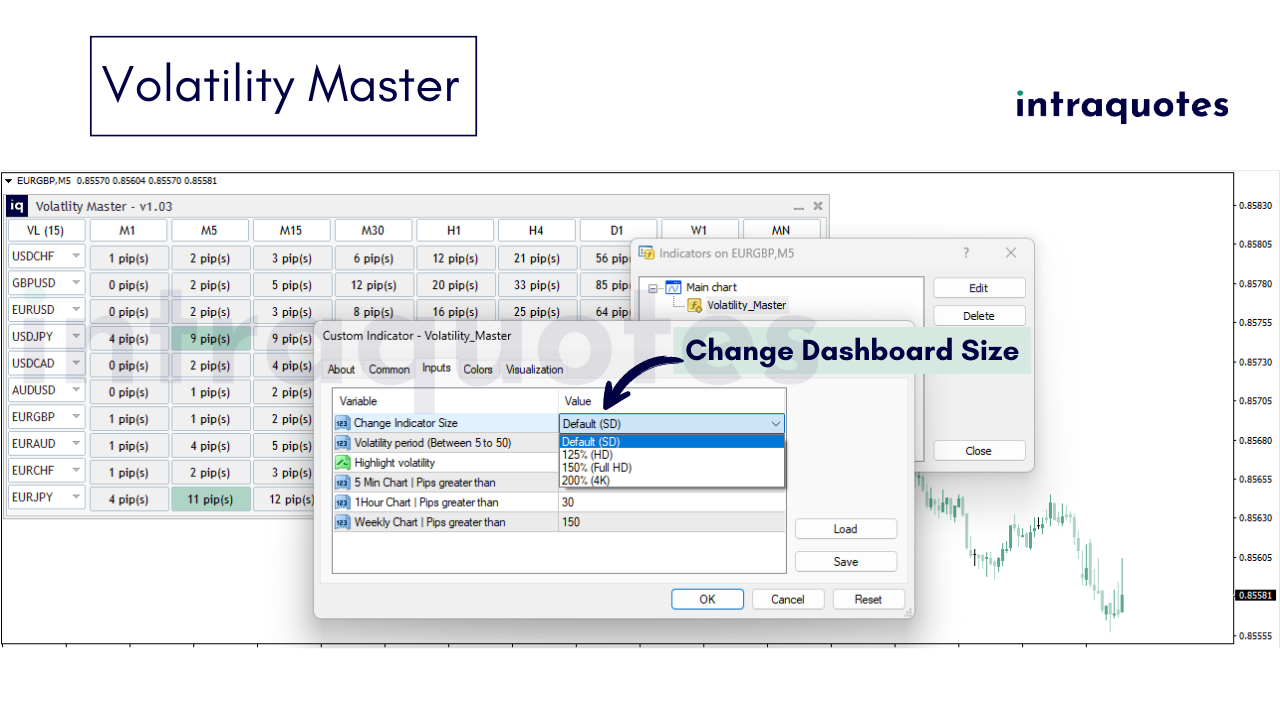
Indicator Settings:
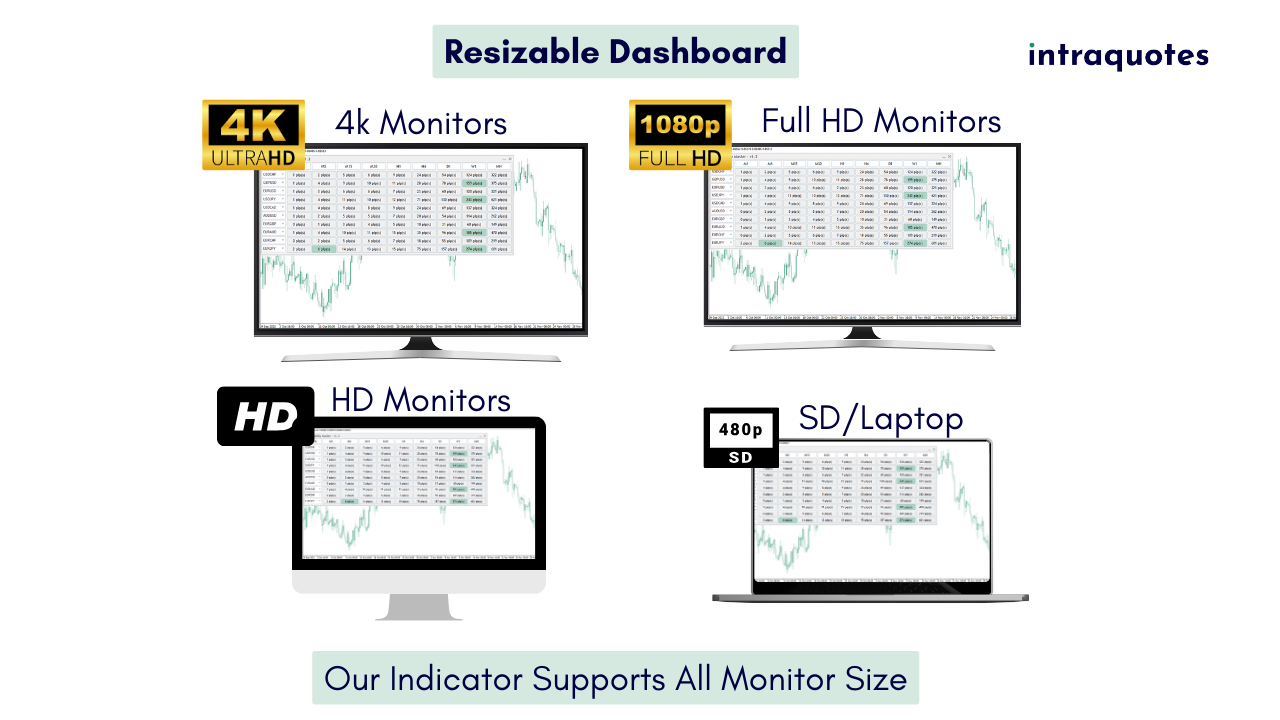
Change Indicator Size:
- Default (SD)
- 125% (HD)
- 150% (Full HD)
- 200% (4K)
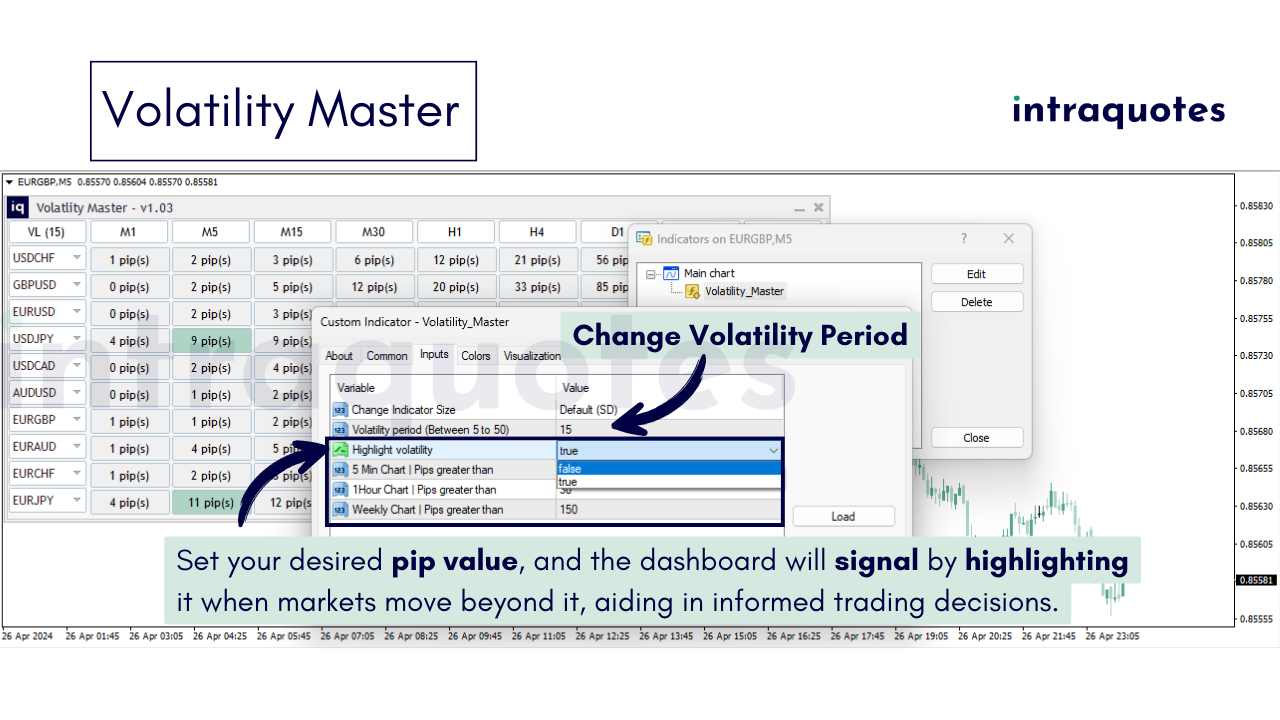
Volatility Period: 15 (Default) (min 5 & max 50 period)
It means indicator will count volatility for last 15 bars across all timeframes.
Indicator Strategy:
The Volatility Master indicator provides insights into market dynamics across various symbols and timeframes. It facilitates a comprehensive understanding of whether the market is currently exhibiting volatility or residing in a subdued range-bound state. Armed with precise pip movement details, traders can make informed decisions about setting stop-loss and take-profit levels. For instance, if the hourly chart displays a symbol's volatility at 30 pips and you intend to hold the trade for an hour, setting a target within the 30-pip range becomes a prudent choice. This versatility extends to its effectiveness in binary options trading as well.
Indicator Troubleshooting:
Issue with symbol order:
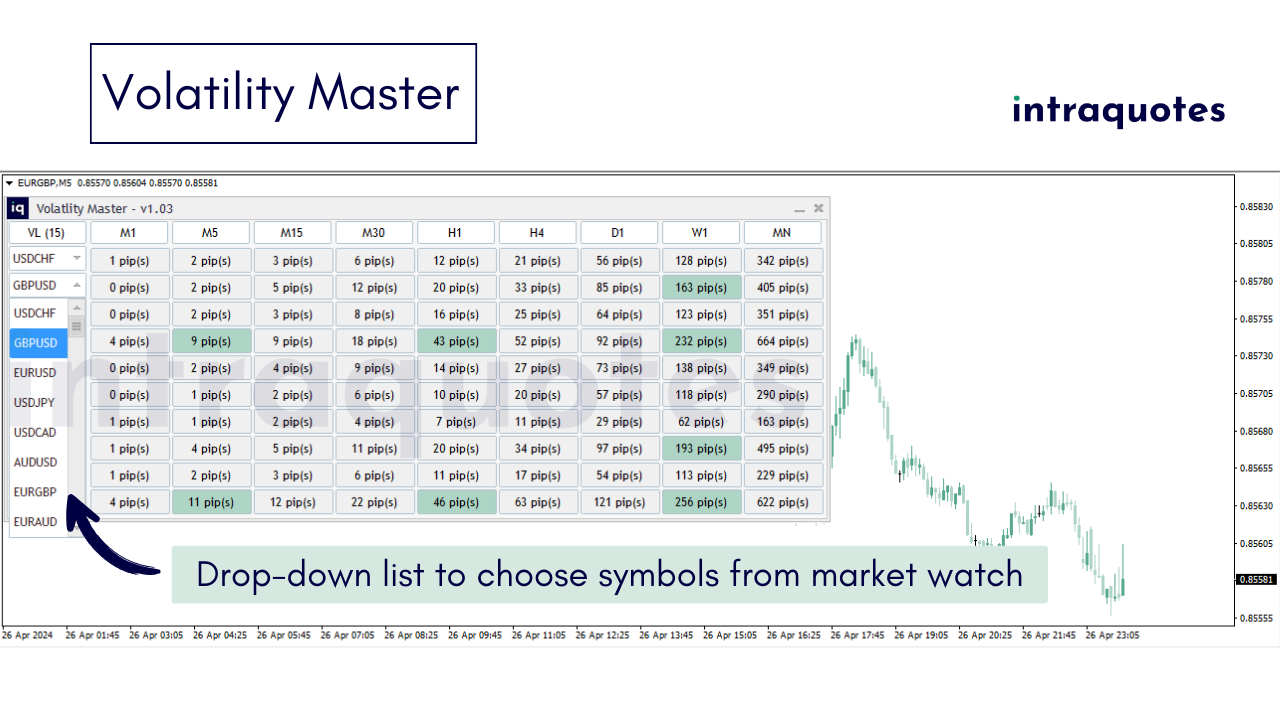
Symbols are displayed in reverse order and not starting from the first ten of the market list.
Solution:
This issue can differ from one broker to another. To address this, prioritize the symbols you frequently use for trading by placing them at the top of the Market Watch section. Conceal any unnecessary symbols to enhance indicator performance.
Loading data correctly on Indicator:
- Load all desired symbols in your market watch before applying the indicator.
- Ensure MetaTrader historical data is loaded for the chosen symbols in the chart.
- If encountering "Data not synchronized" issues, allow 5-10 minutes for your terminal to load, ensuring a seamless experience.
How to Do a Visual Backtest with Our Indicator:
Step 1: Download the entire history center database first. Press shortcut key F2 to access the History Center.
Step 2: Click on the download button.
Step 3: After the download completes, close, and restart the metatrader.
Possible Issues with Backtesting:
Problem 1:
You see a message that says "Waiting for update" on the chart while backtesting.
Solution:
This means that you don't have enough data or poor internet connection. To avoid this, make sure you download the full History Center data as explained above.
Problem 2:
Metatrader freezes during backtest.
Solution:
This also happens because of insufficient data or bad internet connection. Fix internet connection before starting and follow the steps again.
Contact us:
For any issues, bug reports, or suggestions, feel free to contact us, comment on the product page, or DM us. Your feedback is crucial for an exceptional experience.
Service Limitation:
It is requested that purchases must be refrained from if the buyer is from India, Bangladesh, or Pakistan, as developer support for these regions is unavailable due to legal restrictions.
Risk Disclosure:
Our indicator doesn't guarantee future profits or losses. Trade responsibly, understanding that IntraQuotes or program developer is not liable for any incurred losses or the precision of signals. Our product serves as visual guidance, adding value to informed trading decisions.
Copyright © INTRAQUOTES a brand of Taracode International.