ICT Market Structure MT4
- インディケータ
- Yong Jie Su
- バージョン: 1.0
- アクティベーション: 10
あなたはICTコンセプトを取引するための信頼できるインジケーターを探しているということですね。ICTマーケットストラクチャーは、より高度な戦略を使うトレーダーのためのユーザーマニュアルを提供します。
このオールインワンのインジケーターは、ICTコンセプト(スマートマネーコンセプト)に焦点を当て、大手機関がどのように取引しているかを分析し、彼らの動きを予測するのに役立ちます。この戦略を理解し、活用することで、トレーダーは市場の動きに関する貴重な洞察を得ることができ、プライスアクションに基づいてより実用的なエントリーとエグジットを見つけることができます。
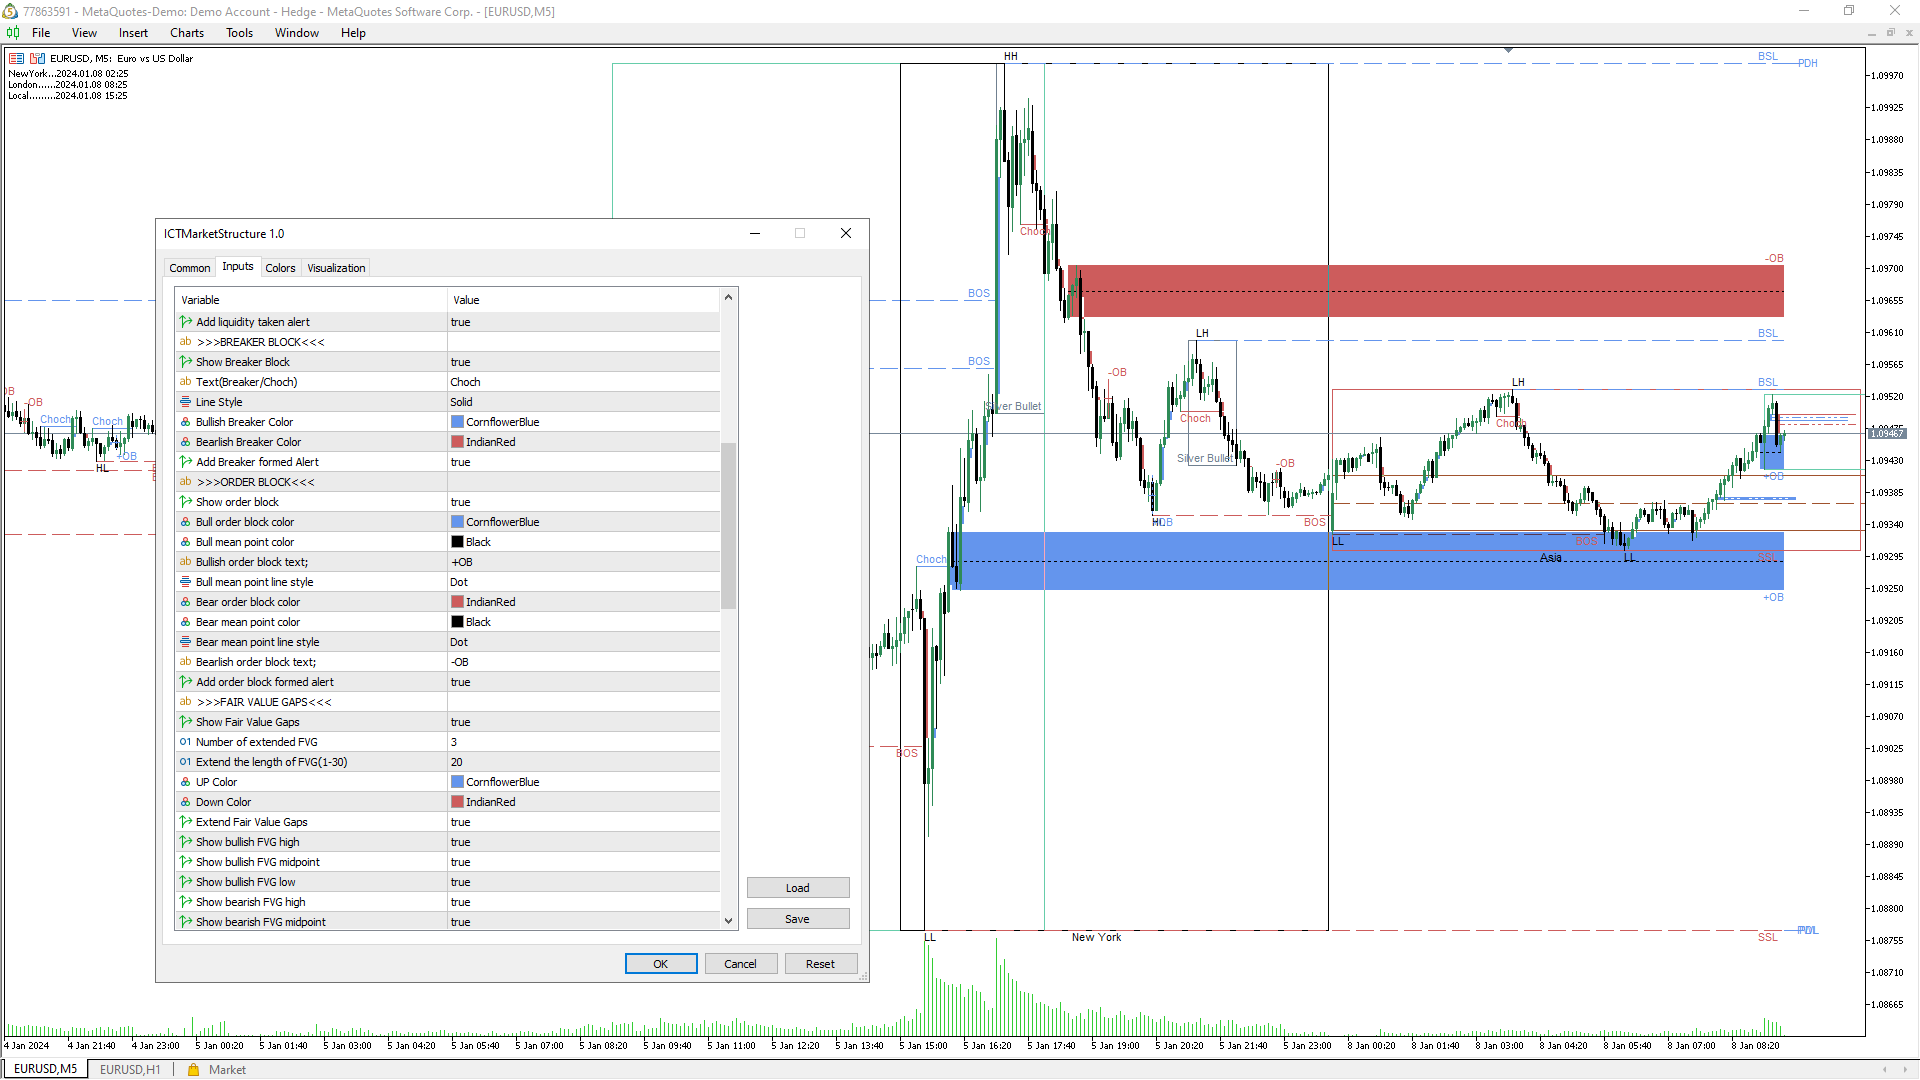
以下は、いくつかの機能の簡単な紹介です:
- 再描画、再描画、遅延のないインジケーター。
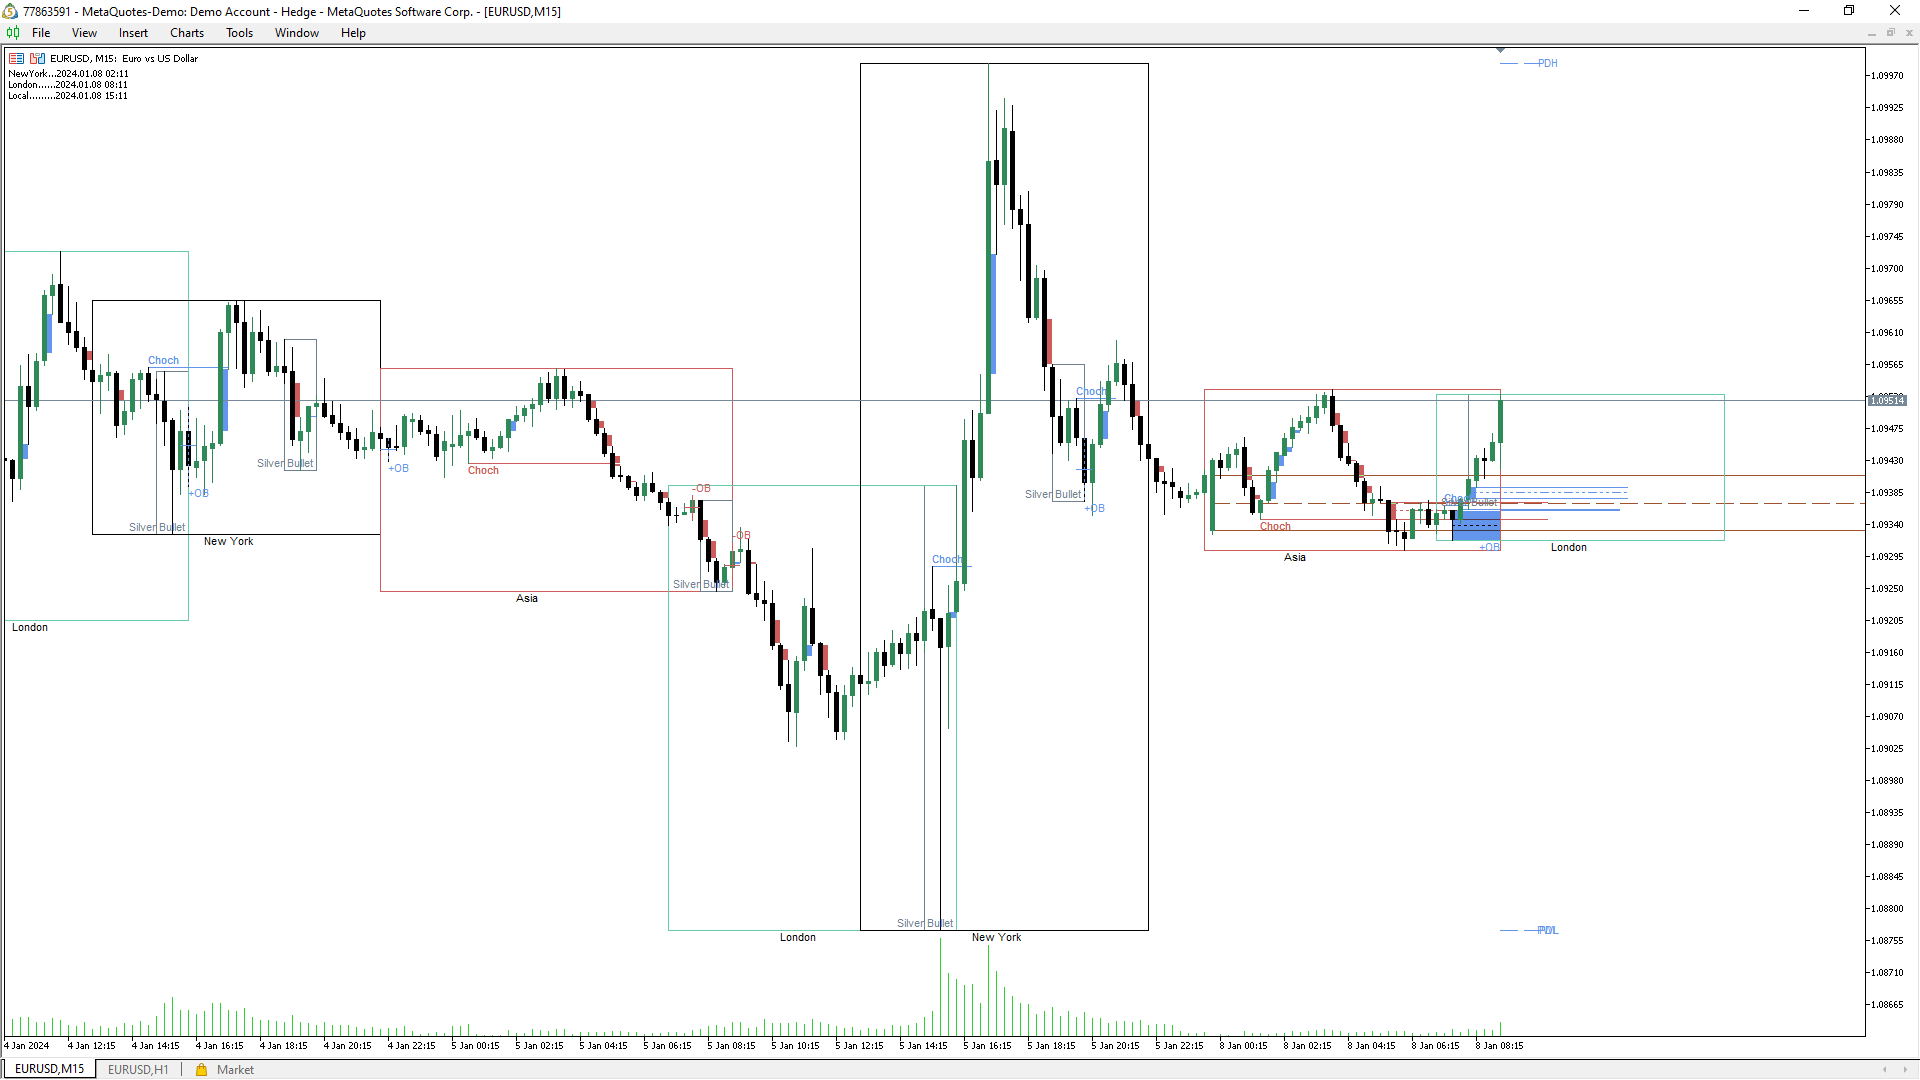
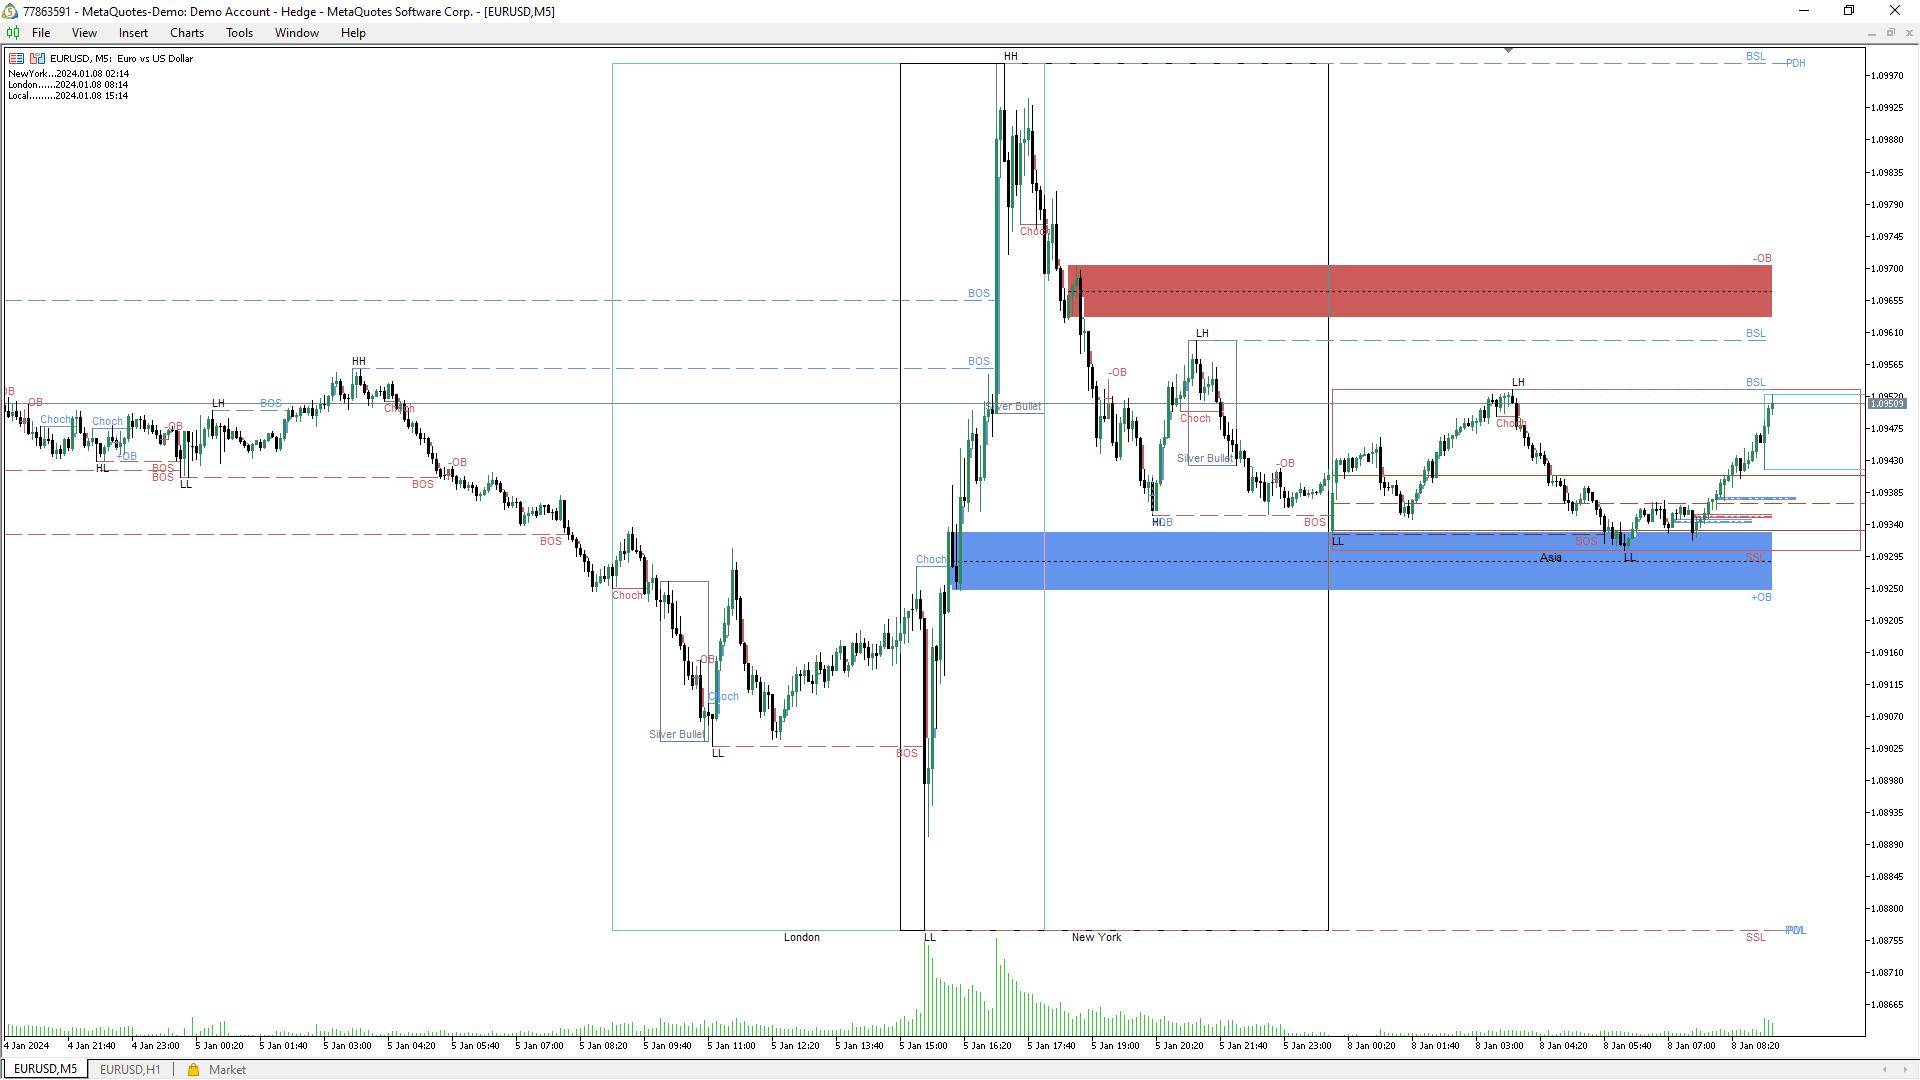
- オーダーブロック(強気と弱気)、ボリュームメトリクスとアラート付きのオーダーブロック。
- リアルタイムのマーケット構造とスイング構造の高値と安値(HH, HL, LL, LH)とアラート。
- 構造の崩壊(BOS)、性格の変化(CHoCH)/モメンタムシフト(MS)。
- ブレーカーブロックのラベリングとアラート。
- 公正価値ギャップ(強気と弱気のFVG)の検出とアラート。
- シルバーバレットタイムの表示。
- 取引時間セッションの表示:ニューヨーク、ロンドン、アジア。
- すべてのテキストとブロックの色をカスタマイズできます。
関連トピック:
機関の視点、流動性分析、 機関取引、 市場予測、 価格変動、取引機関、トレンド分析、 プライスアクション、 マーケット構造 、オーダーブロック、 オーダーブロック、 モメンタムシフト、 供給・需要 、強いアンバランス 、高値更新 、公正価値 、フィボナッチ・リトレースメント、 同値高値 、同値安値 、マルチタイムフレーム、 マルチタイムフレーム、ダッシュボード、 高いタイムフレーム 、高いタイムフレームの構造 、流動性の空白 、マーケット構造 、タイムゾーン 、マーケットセッション 、テクニカル分析 、流動性プール 、市場操作、 市場センチメント 、価格分析 、市場洞察、 市場参加者、 出来高分析 、市場心理、 オーダーフロー 、市場の解釈、 市場の予測 、トレーディングパターン