Projected Volume
- インディケータ
- Fernando Lahude Ritter
- バージョン: 2.0
- アップデート済み: 5 12月 2023
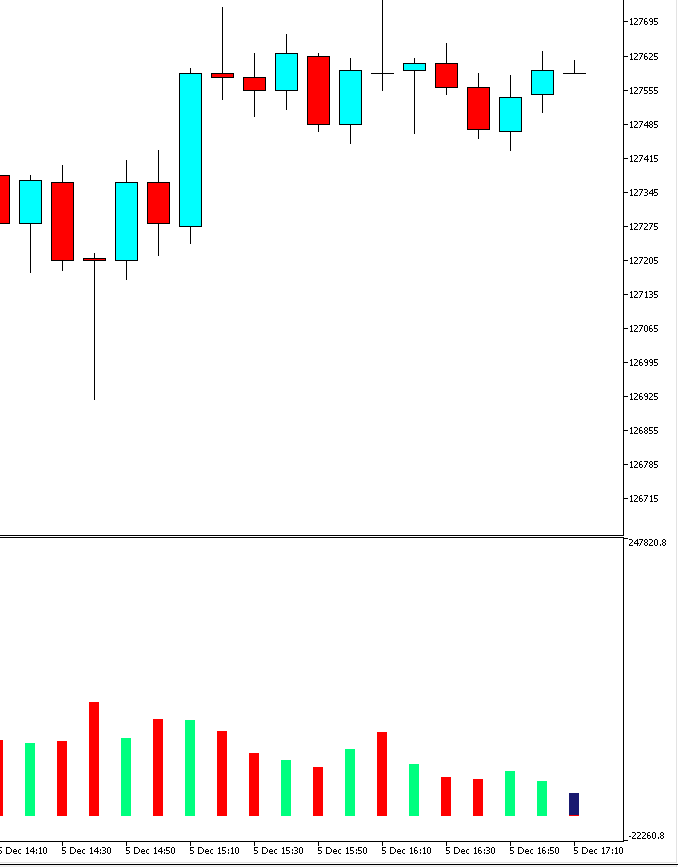
Volume Projection Indicator
The Volume Projection Indicator is a specialized tool designed for traders who focus on the relationship between volume and price action. This intuitive indicator projects the expected volume for the ongoing candle, aiding in decision-making during live market conditions. The indicator presents volume data in a histogram format directly on the chart for quick analysis.
Features:
- Bullish Volume Representation: Each green bar in the histogram signifies the volume for a bullish candle, allowing traders to visualize buying pressure.
- Bearish Volume Representation: Conversely, red bars depict the volume for bearish candles, indicating selling pressure in the market.
- Volume Projection: The distinctive dark blue bar forecasts the volume for the current candle, giving traders a real-time insight into market sentiment and potential momentum before the candle closes.
- No Configuration Hassle: With no input parameters to set, the indicator is a plug-and-play tool for any trading session, simplifying the user experience while delivering valuable market insights.
The simplicity of this indicator lies in its ability to display complex volume data in an easily digestible histogram format, all while requiring no input from the user, making it an essential addition to any trader's toolkit.
Note: This indicator is most effective when used in conjunction with other technical analysis tools and within a comprehensive trading strategy.
Buffer 0 - Projected Volume
Buffer 1 - Actual Volume
Buffer 2 - Color