• 概要
  • レビュー
  • コメント

SyntheticaFX Spike Hunter

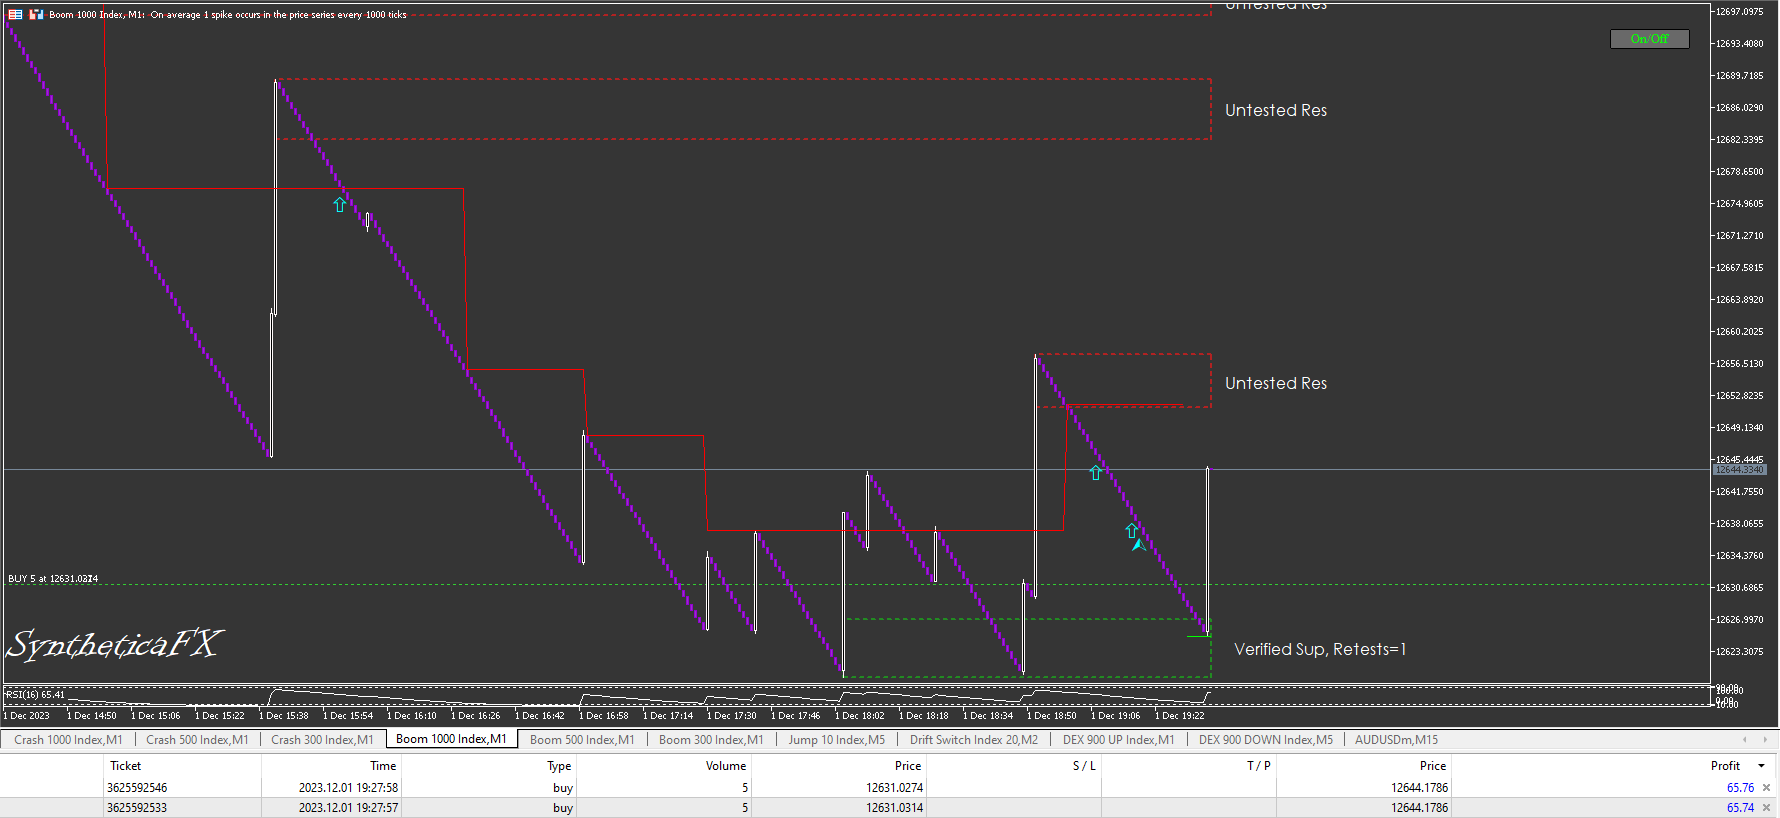
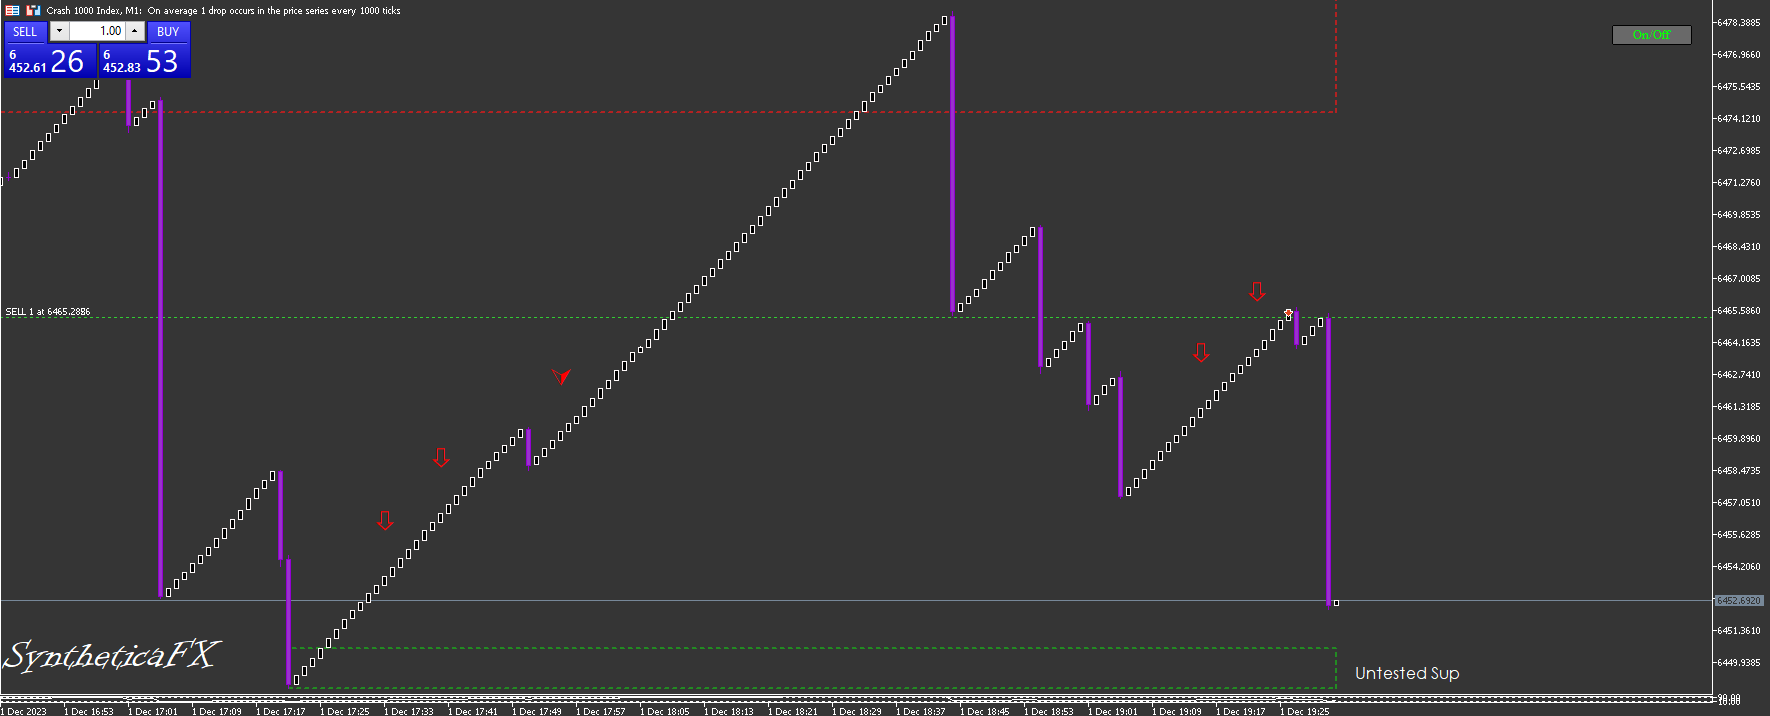
SyntheticaFX Spike Hunter Indicator is a powerful tool that helps you identify potential spikes in the market. It works on the 1-minute timeframe and shows arrows on the chart when a spike is likely to happen. It is designed for Crash and Boom markets, such as Crash 300, 500 and 1000, and Boom 300, 500 and 1000. It is non-repainting and only indicates spikes when Crash markets are in downtrend and Boom markets are in uptrend. 

However, no indicator can always be 100% accurate as the market can change at any time. Therefore, you should always apply proper risk management and follow the instructions for stop loss and take profit. The stop loss for entries is 20-30 candles. When the market spikes into profits, you should hold C3 and B3 for 2-3 candles before closing, B5 and C5 for 3-5 candles before closing, and B1 and C1 for 5-7 candles before closing. For Crash pairs, you should set the buy entries color to none, and for Boom pairs, you should set the sell entries color to none.

SyntheticaFX Spike Hunter Indicator is a great way to catch the spikes and make profits in the volatile Crash and Boom markets. Try it today and see the difference!


おすすめのプロダクト
Renko Plus
Eadvisors Software Inc.
With Renko Plus you can use the features in the Indicator functionality, just add it to the Metatrader5 chart.             The Renko chart is a type of chart, developed by the Japanese, that is constructed using price movement rather than standardized prices and time intervals like most charts. It is believed to be named after the Japanese word for bricks, "renga", as the graphic looks like a series of bricks.             A new brick is created when the price moves a specified p
Gino Renko
Stephane, Andr Valette
1 (1)
Another renko-based indicator. It returns different usable values ​​for an EA, and is directly displayed on the main chart. Its setting is very simple: The size of the renko The number of bars taken into account The falling color The color on the rise Returned values: Buffer 0 : Value of the middle Buffer 1 : Value of the Top Buffer 2 : Value of the Bottom Buffer 3 : Direction of renko (0.0 for top ; 1.0 for bottom) Buffer 4 : Ratio of the renko, for example, if it is twice, 3 times, ro more of
Big Player Range
Thalles Nascimento De Carvalho
5 (2)
「BigPlayerRange」インジケーターへようこそ。これは金融機関が市場で示す重要なエリアを特定するために開発されたテクニカル分析ツールです。このインジケーターは、主要な市場参加者が相当な活動と興味を示す価格範囲を正確に分析します。 主な特徴: 1. 金融機関の関心エリアのマッピング:「BigPlayerRange」は金融機関が強い活動を示すチャート上のエリアを正確に強調表示します。これらのポイントは戦略的に重要であり、市場の将来の動きについての洞察を提供します。 2. 出口の基準としてのプロジェクション:関心のあるエリアを特定するだけでなく、このインジケーターはプロジェクションを使用して可能な出口の基準としています。これらのプロジェクションは市場が将来どの方向に動くかに基づいて戦略を計画するのに役立ちます。 3. 識別された範囲に戻るときの引き戻しの確率:「BigPlayerRange」のユニークな機能の1つは、価格が関心のある範囲に戻ったときの引き戻しの確率を計算できることです。これは潜在的なトレンドの反転を評価するのに役立ちます。 「BigPl
MT4版  |  FAQ Owl Smart Levels Indicator は、 Bill Williams の高度なフラクタル、市場の正しい波構造を構築する Valable ZigZag、エントリの正確なレベルをマークする Fibonacci レベルなどの一般的な市場分析ツールを含む 1 つのインジケーター内の完全な取引システムです。 利益を得るために市場と場所に。 戦略の詳細な説明 インジケータを操作するための指示 顧問-取引助手 プライベートユーザーチャット ->購入後に私に書いて、私はプライベートチャットにあなたを追加し、あなたはそこにすべてのボーナスをダウンロードすることができます 力はシンプルさにあります! Owl Smart Levels 取引システムは非常に使いやすいので、専門家にも、市場を勉強し始めて自分で取引戦略を選択し始めたばかりの人にも適しています。 戦略と指標に秘密の数式や計算方法が隠されているわけではなく、すべての戦略指標は公開されています。 Owl Smart Levels を使用すると、取引を開始するためのシグナルをすばやく確認し、注文を出すため
Was: $249  Now: $99   Market Profile defines a number of day types that can help the trader to determine market behaviour. A key feature is the Value Area, representing the range of price action where 70% of trading took place. Understanding the Value Area can give traders valuable insight into market direction and establish the higher odds trade. It is an excellent addition to any system you may be using. Inspired by Jim Dalton’s book “Mind Over Markets”, this indicator is designed to suit the
This indicator uses a mathematical calculation algorithm . This algorithm calculates the remainder between the updated model and the actual values and produces the possible progress of the graph on the graph. It is not a super prophet in trading, but it is very good for the trader when entering the market and to analyze it before entering. Applicable for all currencies. Данный индикатор использует алгоритм математических вычислений . Данный алгоритм вычисляет остаток между обновленной моделью и
Robust median Renko style indicator for creating custom charts resembling Median Renko, Mean Renko, Turbo Renko and Better Renko candles as well as vanilla Renko with wicks plus Point-O charts. This all in one package provides all of the signals needed by day traders, scalpers, and even long-term traders. Main characteristics The indicator is an overlay on the main chart so it is possible to utilize one-click trading and order manipulation directly on the custom charts. Visual order placement
インディケータは現在のクオートを作成し、これを過去のものと比較して、これに基づいて価格変動予測を行います。インジケータには、目的の日付にすばやく移動するためのテキスト フィールドがあります。 オプション: シンボル - インジケーターが表示するシンボルの選択; SymbolPeriod - 指標がデータを取る期間の選択; IndicatorColor - インジケータの色; HorisontalShift - 指定されたバー数だけインディケータによって描画されたクオートのシフト; Inverse - true は引用符を逆にします。false - 元のビュー。 ChartVerticalShiftStep - チャートを垂直方向にシフトします (キーボードの上下矢印)。 次は日付を入力できるテキストフィールドの設定で、「Enter」を押すとすぐにジャンプできます。
All about time and price by ICT. This indicator provides a comprehensive view of ICT killzones, Silver Bullet times, and ICT Macros, enhancing your trading experience.  In those time windows price either seeks liquidity or imbalances and you often find the most energetic price moves and turning points. Features: Automatic Adaptation: The ICT killzones intelligently adapt to the specific chart you are using. For Forex charts, it follows the ICT Forex times: In EST timezone: Session: Asia: 20h00-0
基本練行インジケーターは、メインチャートに練行ボックスを表示します。 MT4のバージョン その利点は、メインチャートと練行チャートの両方に同時にアクセスできることです。 さらに、各練行ボックスを形成するのに要したバーの数を知ることができます。 反転が発生すると、インジケーターはポップアップ、プッシュ、電子メールアラートで通知します。 このインジケーターには複雑な設定はなく、初心者からプロまで簡単に戦略に使用できます。 入力 Box Size : ボックスのサイズはポイントに基づいています Upward Box Color : 強気ボックスカラー Downward Box Color : 弱気のボックスの色 Box Opacity : 不透明度の量 (0 から 100 までの数値) で、不透明度が減少すると透明度も増加します。 Text Color : 各ボックス内のバーの数をカウントする数字の色 Font Size : 数字のテキストサイズ Max Bars : インジケーターが計算を実行するバーの最大数 [ゼロは利用可能なすべてのバーを意味します] Po
FREE
無限からの通貨の強さを測定するためのこの革新的な指標は、長い間取引されているダフ屋やトレーダーにとって不可欠な助手です。 通貨の強さ/弱さを分析するためのシステムは、世界の主要なトレーダーによって市場で長い間知られており、使用されてきました。 任意の裁定取引は、この分析なしでは完全ではありません。 私たちの指標は、互いに関連して基本通貨の強さを簡単に決定します。 これは、インスタント分析を可能にし、最強のエントリポイントを検索し、すべてまたは現在の通貨ペアの折れ線グラフが表示されます。 インジケータは直感的で、すぐに見つけて任意のペアに切り替えることができ、地下室とメインチャートの両方に配置できるモバイルパネルがあります。 通貨の強さの変化の通知のタイマーモードは、トレーダーに電話で通知を受け取る機会を与えます。  通貨パワーメーターインフィニティ指標を使用するためのいくつかの戦略: 1. 通貨の強さの線形表示のチャートを使用して、交差点を新興トレンドの信号として検索します 2. トレンド反転信号が表示された後、強い通貨の方向に頭皮 3. 通貨の強さの発散分析を使用して、
PipFinite Trend PRO MT5
Karlo Wilson Vendiola
4.87 (665)
Breakthrough Solution For Trend Trading And Filtering With All Important Features Built Inside One Tool! Trend PRO's smart algorithm detects the trend, filters out market noise and gives entry signals with exit levels. The new features with enhanced rules for statistical calculation improved the overall performance of this indicator. Important Information Revealed Maximize the potential of Trend Pro, please visit www.mql5.com/en/blogs/post/713938 The Powerful Expert Advisor Version Automa
A machine translation from English product description was used. We apologies for possible imprecisions. 英語の製品説明からの機械翻訳が使用されました。   不正確な可能性があることをお詫び申し上げます。 お気に入りのろうそく足の価格アクションパターンの視覚化システム。 アタッチされると、インジケーターはチャート上の次のパターンを自動的にマークします。 ピノキオバー - 長い「鼻」を持つ小さなボディのバー、非常によく知られている逆のパターン。 内側のバー - 範囲が前のバーの範囲内にあるバー。   それは市場の不確実性を表しています。 外側のバー - 範囲が前のバーの範囲を超えるバー。   それは市場の不確実性を表しています。 レールパターン - ほぼ等しく、より大きなボディを持つ 2 つの結果として生じる反対側のバー。   逆のパターン。これは、より高い時間枠のピノキオバーパターンと実際に一致します。 マスターキャンドル パターン - キャンドルの 5 つ、後続の 4 つのキャンド
Indicator and Expert Adviser  EA Available in the comments section of this product. Download with Indicator must have indicator installed for EA to work. Mt5 indicator alerts for bollinger band and envelope extremes occurring at the same time. Buy signal alerts occur when A bullish candle has formed below both the lower bollinger band and the lower envelope  Bar must open and close below both these indicators. Sell signal occur when A bear bar is formed above the upper bollinger band and upp
Introduction to Smart Renko The main characteristics of Renko Charting concern price movement. To give you some idea on its working principle, Renko chart is constructed by placing a brick over or below when the price make the movement beyond a predefined range, called brick height. Therefore, naturally one can see clear price movement with less noise than other charting type. Renko charting can provide much clearer trend direction and it helps to identify important support and resistance level
Advanced 4xZeovo MT5 Indicator (MetaTrader 5)   Product Description  4xZeovo is a powerful trading indicator system monitoring 24/7 financial markets. Metatrader5 tool designed to find the best buying/selling opportunities and notifies the user.    Making life easy for traders in helping with the two most difficult decisions with the use of advanced innovate trading indicators aiming to encourage users to hold the winning positions and take profit at the best times.    Equipped with a unique tra
The trend is your friend! Look at the color of the indicator and trade on that direction. It does not  repaint. After each candle is closed, that's the color of the trend. You can focus on shorter faster trends or major trends, just test what's most suitable for the symbol and timeframe you trade. Simply change the "Length" parameter and the indicator will automatically adapt. You can also change the color, thickness and style of the lines. Download and give it a try! There are big movements
トレンドトレーディング は、タイミングのプルバックとブレイクアウトにより、市場で起こっているトレンドから可能な限り利益を得るように設計された指標です。確立されたトレンドの中で価格が何をしているかを分析することにより、取引の機会を見つけます。 [ インストールガイド | 更新ガイド | トラブルシューティング | よくある質問 | すべての製品 ] 自信を持って効率的に金融市場を取引する むち打ちにならずに確立されたトレンドから利益を得る 収益性の高いプルバック、ブレイクアウト、早期の逆転を認識する この指標は、独自の品質とパフォーマンスを分析します 複数時間枠のダッシュボードを実装します インジケーターは再描画されていません 電子メール/音声/視覚アラートを実装します 確立されたトレンドは多くの取引機会を提供しますが、ほとんどのトレンド指標はそれらを完全に無視しています。インジケーターの解釈はかなり簡単です: (1) トレンドの変化 (2) トレンドの方向への後退 (3) トレンドの方向へのブレイクアウト 赤いダッシュ は下降トレンド中の修正です 青いダッシュ は上昇ト
プレミアムレベルは、正しい予測の精度が80%を超える独自の指標です。 この指標は、最高のトレーディングスペシャリストによって2か月以上テストされています。 あなたが他のどこにも見つけられない作者の指標! スクリーンショットから、このツールの正確さを自分で確認できます。 1は、1キャンドルの有効期限を持つバイナリーオプションの取引に最適です。 2はすべての通貨ペア、株式、商品、暗号通貨で機能します 手順: 赤い矢印が表示されたらすぐにダウントレードを開き、青い矢印が表示されたら閉じます。青い矢印の後に開くこともできます。 試してテストしてください!推奨設定はデフォルトです! 日足チャートで最高の精度を示します! インディケータは、2600 Pipsの収益性に対して、約10Pipsという非常に小さなマージンを使用します。
Price reach indicator. It also serves as the perfect term for supports and resistance. I use it in two experts. The basic tool for professional trading. The indicator analyzes the last 500 bar and uses this to determine the levels ( but it doesn't predict the future ) . Personally, I use it on TF H1.  It is very simple. Four lines on chart and that's all. Only two input parameters.  Thousands of indicators. Why this? Is good ? No! Is very good. Please test the indicator prior to purchasing. You
数列の一つに「森林火災数列」があります。これは、最も美しい新しいシーケンスの 1 つとして認識されています。その主な特徴は、このシーケンスが線形トレンドを回避することです。最短のものであってもです。この指標の基礎を形成したのはこのプロパティです。 財務時系列を分析する場合、この指標は可能なすべての傾向オプションを拒否しようとします。そして失敗した場合にのみ、トレンドの存在を認識し、適切なシグナルを発します。このアプローチにより、新しいトレンドの始まりの瞬間を正しく判断できます。ただし、偽陽性の可能性もあります。それらの数を減らすために、このインジケーターに追加のフィルターが追加されました。新しいバーが開くとシグナルが生成されます。いずれの場合も再描画は発生しません。 指標パラメータ: Applied Price   - 適用価格定数; Period Main   - インディケータのメイン期間、その有効な値は 5 ~ 60 です。 Period Additional   - 追加の期間。このパラメーターの有効な値は 5 ~ 40 です。 Signal Filter   - 追加の信号
This indicator shows a candle combination based on dodge, dodge and pin bar. The logic of the pattern is to stand on the side of strength, after uncertainty. The indicator is universal and is useful for trading binary options, forex, ETFs, cryptocurrency, stocks. The indicator supports timeframes from M5 to MN, including non-standard TF presented in MT5. (М5,М6,М10,M12, M15, M20, M30, H1, H2, H3, H4, H6, H8, H12, D1, W1, MN). The ability to enable and disable TF is implemented. Sound alerts and
A professional tool for trading - the divergence indicator between the WPR and the price, which allows you to receive a signal about a trend reversal in a timely manner or catch price pullback movements (depending on the settings). The indicator settings allow you to adjust the strength of the divergence due to the angle of the WPR peaks and the percentage change in price, which makes it possible to fine-tune the signal strength. The indicator code is optimized and is tested very quickly as par
FREE
This is a multi-symbol and multi-timeframe table-based indicator designed for a candlestick patterns detection with 46 patterns for META TRADER 5. Each formation has own image for easier recognition. Here you find most popular formations such as "Engulfing", "Hammer", "Three Line Strike", "Piercing" or Doji - like candles. Check my full list of patterns on my screenshots below. Also you can not only switch all bearish or bullish patterns from input, but also select formation for a specified symb
The market is unfair if only because 10% of participants manage 90% of funds. An ordinary trader has slim changes to stand against these "vultures". This problem can be solved. You just need to be among these 10%, learn to predict their intentions and move with them. Volume is the only preemptive factor that faultlessly works on any timeframe and symbol. First, the volume appears and is accumulated, and only then the price moves. The price moves from one volume to another. Areas of volume accumu
This indicator is used to compare the relative strength of the trade on the chart against the other several selected symbols. By comparing the price movement of each traded variety based on the same base day, several trend lines of different directions can be seen, reflecting the strong and weak relationship between the several different traded varieties, so that we can have a clearer understanding of the market trend. For example, you can apply this indicator on a EurUSD chart and compare it
Order Book, known also as Market Book, market depth, Level 2, - is a dynamically updated table with current volumes of orders to buy and to sell specific financial instument at price levels near Bid and Ask. MetaTrader 5 provides the means for receiving market book from your broker, but in real time only, without access to its history. The indicator OrderBook Cumulative Indicator accumulates market book data online and visualizes them on the chart. In addition, the indicator can show the market
Noize Absorption Index - is the manual trading system that measures the difference of pressure between bears forces and bulls forces. Green line - is a noize free index that showing curent situation. Zero value of index shows totally choppy/flat market.Values above zero level shows how powerfull bullish wave is and values below zero measures bearish forces.Up arrow appears on bearish market when it's ready to reverse, dn arrow appears on weak bullish market, as a result of reverse expectation.
Trend Master Chart MT5
Frederic Jacques Collomb
5 (2)
Trend Master Chart、必要なトレンド指標です。 チャートをオーバーレイし、色分けを使用してさまざまな市場のトレンド/動きを定義します。 2 つの移動平均と異なるオシレーターを組み合わせたアルゴリズムを使用します。 これら 3 つの要素の周期は変更可能です。 どの時間枠やペアでも機能します。 上昇トレンドまたは下降トレンド、およびこのトレンドへのさまざまなエントリーポイントを一目で識別できます。 たとえば、顕著な上昇トレンド (薄緑色) では、このトレンド内のさまざまな市場インパルスが濃い緑色のローソク足で表示されます。 設定可能なアラートを使用すると、これらの衝動を決して見逃すことがなくなります。 MT4のバージョンです。 入力パラメータ: Period 1: 高速期間移動平均。 Period 2: 低速期間の移動平均。 Oscillator period: オシレーター周期。 Sell/Buy alert: 市場衝動アラート、トレンドエントリーポイント。 Bullish/Bearish alert: トレンドが
FREE
Cumulative delta indicator As most traders believe, the price moves under the pressure of market buying or selling. When someone redeems an offer standing in the cup, the deal is a "buy". If someone pours into the bid standing in the cup - the deal goes with the direction of "sale". The delta is the difference between purchases and sales. A cumulative delta - the difference between the cumulative sum of purchases and sales for a certain period of time. It allows you to see who is currently contr
このプロダクトを購入した人は以下も購入しています
まず第一に、このトレーディングシステムがノンリペイント、ノンリドロー、ノンラグのインジケーターであることを強調する価値がある。これにより、手動取引とロボット取引の両方に理想的なものになっています。 「スマートトレンドトレーディングシステム MT5」は、新規および経験豊富なトレーダー向けにカスタマイズされた包括的なトレーディングソリューションです。10以上のプレミアムインジケーターを組み合わせ、7つ以上の堅実なトレーディング戦略を備えており、多様な市場状況に対応する多目的な選択肢となっています。 トレンドフォロー戦略:トレンドを効果的に乗り越えるための正確なエントリーとストップロス管理を提供します。 リバーサル戦略:潜在的なトレンドの反転を特定し、トレーダーがレンジ相場を活用できるようにします。 スキャルピング戦略:高速で正確なデイトレードおよび短期取引のために設計されています。 安定性:すべてのインジケーターはノンリペイント、ノンリドロー、ノンラグであり、信頼性の高いシグナルを保証します。 カスタマイズ:個々の取引の嗜好に合わせたカスタム戦略をサポートします。7つ以上の戦略と組み合わせ
まず第一に、この取引インジケーターは再描画されず、再描画されず、遅延しないことを強調する価値があります。これにより、手動取引とロボット取引の両方に理想的なものになります。 アトミックアナリストは、価格の強さとモメンタムを利用して市場でより良いエッジを見つけるためのPA価格アクションインジケーターです。ノイズや誤ったシグナルを除去し、取引ポテンシャルを高めるための高度なフィルターを備えています。複雑なインジケーターの複数のレイヤーを使用して、アトミックアナリストはチャートをスキャンし、複雑な数学的計算をシンプルなシグナルと色に変換します。これにより、どのような初心者トレーダーでも理解して使用し、一貫した取引の決定を行うことができます。 「アトミックアナリスト」は、新規および経験豊富なトレーダー向けにカスタマイズされた包括的な取引ソリューションです。プレミアムインジケーターとトップノッチの機能を1つの取引戦略に組み合わせ、すべてのタイプのトレーダーにとって汎用性のある選択肢にします。 デイリートレーディングとスキャルピング戦略:高速で正確なデイトレーディングおよび短期トレード
FX Volume MT5
Daniel Stein
4.94 (17)
mql5と Telegramの モーニング・ブリーフィングで、詳細とスクリーンショットを含む毎日のマーケット・アップデートをご覧 ください! FX Volumeは、ブローカーの視点から市場のセンチメントをリアルに洞察する、最初で唯一の出来高インジケーターです。 ブローカーのような機関投資家が外国為替市場でどのようなポジションをとっているか、COTレポートよりもはるかに速く、素晴らしい洞察を提供します。 この情報をチャート上で直接見ることは、あなたの取引にとって真のゲームチェンジャーであり、画期的なソリューションです。 以下のようなユニークなマーケットデータ洞察から利益を得てください。 比率は 、通貨のロングポジションとショートポジションの比率をパーセントで表示します。 比率の変化は 、選択した期間内のロング比率とその変化率を表示します。 Volumes Totalは 、通貨の取引量(ロングとショート)の合計をロット単位で表示します。 Volumes Long :全通貨のロングポジションの取引量を表示します。 Volumes(ショート )は、全通貨のショートポジションの取引量を表示
ご紹介   クォンタム トレンド スナイパー インジケーターは 、トレンド反転を特定して取引する方法を変革する画期的な MQL5 インジケーターです。 13年以上の取引経験を持つ経験豊富なトレーダーのチームによって開発されました。     クォンタムトレンドスナイパーインジケーター   は、非常に高い精度でトレンドの反転を識別する革新的な方法で、あなたのトレーディングの旅を新たな高みに押し上げるように設計されています。 ***Quantum Trend Sniper Indicatorを購入すると、Quantum Breakout Indicatorを無料で入手できます!*** クォンタム ブレイクアウト インジケーターは、トレンドの反転を特定するとアラートを発し、矢印を示し、3 つのテイクプロフィットレベルを提案します。 初心者トレーダーにもプロのトレーダーにも適しています。 量子EAチャネル:       ここをクリック MT4のバージョン:       ここをクリック 推奨事項: 期間:すべての時間枠。最良の結果を得るには、M
ご紹介     Quantum Breakout PRO は 、ブレイクアウト ゾーンの取引方法を変革する画期的な MQL5 インジケーターです。 13年以上の取引経験を持つ経験豊富なトレーダーのチームによって開発されました。     クォンタム ブレイクアウト プロ   は、革新的でダイナミックなブレイクアウト ゾーン戦略により、あなたのトレーディングの旅を新たな高みに押し上げるように設計されています。 クォンタム ブレイクアウト インジケーターは、5 つの利益ターゲット ゾーンを備えたブレイクアウト ゾーン上のシグナル矢印と、ブレイクアウト ボックスに基づいたストップロスの提案を提供します。 初心者トレーダーにもプロのトレーダーにも適しています。 量子EAチャネル:       ここをクリック 重要!購入後、インストールマニュアルを受け取るためにプライベートメッセージを送ってください。 推奨事項: 時間枠: M15 通貨ペア: GBPJPY、EURJPY、USDJPY、NZDUSD、XAUUSD アカウントの種類: ECN、Raw、またはス
現在33%オフ 初心者にもエキスパートトレーダーにも最適なソリューション このインジケーターは独自の機能と新しい公式を多数内蔵しており、ユニークで高品質かつ手頃な取引ツールです。このアップデートでは、2つの時間枠ゾーンを表示できるようになります。より長いTFだけでなく、チャートTFとより長いTF(ネストゾーンを表示)の両方を表示できます。すべてのSupply Demandトレーダーの皆さんのお気に召すはずです。:) 重要情報の公開 Advanced Supply Demandの可能性を最大化するには、 https://www.mql5.com/ja/blogs/post/720245 にアクセスしてください。   エントリーまたはターゲットの正確なトリガーポイントを正確に特定できれば取引がどのように改善されるか想像してみてください。新しい基盤となるアルゴリズムに基づいて構築されているため、買い手と売り手の間の潜在的な不均衡をさらに簡単に特定できます。これは、最も強い需要と供給のゾーンと、過去のパフォーマンス(古いゾーンを表示)がグラフィカルに表現されるためです。これらの機能は、最適
Quantum平均足PRO のご紹介 市場のトレンドに対する明確な洞察を提供するように設計された平均足キャンドルは、ノイズを除去し、誤ったシグナルを排除する能力で知られています。混乱を招く価格変動に別れを告げ、よりスムーズで信頼性の高いチャート表現を導入しましょう。 Quantum Heiken Ashi PRO を真にユニークなものにしているのは、従来のローソク足データを読みやすい色のバーに変換する革新的なフォーミュラです。赤と緑のバーはそれぞれ弱気トレンドと強気トレンドをエレガントに強調し、潜在的なエントリーポイントとエグジットポイントを驚くほど正確に見つけることができます。 量子EAチャネル:       ここをクリック MT4のバージョン:       ここをクリック この注目すべき指標には、いくつかの重要な利点があります。 明確性の向上: 価格変動を平滑化することで、平均足バーは市場トレンドをより明確に表現し、有利な取引機会を特定しやすくします。 ノイズの削減: 誤ったシグナルを引き起こすことが多い不安定な価格変動に別れを告げます。 Quantum Heik
A key element in trading is zones or levels from which decisions to buy or sell a trading instrument are made. Despite attempts by major players to conceal their presence in the market, they inevitably leave traces. Our task was to learn how to identify these traces and interpret them correctly. Reversal First Impulse levels (RFI)   -  Version MT4                  INSTRUCTIONS                 RUS                 ENG                         R ecommended to use with an indicator   -  TREND PRO  
まず第一に、この取引ツールはノンリペイント、ノンリドロー、ノンラグの指標であり、プロの取引に理想的ですことを強調する価値があります。 スマートプライスアクションコンセプトインジケーターは、新米から経験豊富なトレーダーまで、非常 に強力なツールです。Inner Circle Trader AnalysisやSmart Money Concepts Trading Strategiesなど、20以上の有用な指標を1つに組み合わせています。このインジケーターはスマートマネーコンセプトに焦点を当て、大手機関の取引方法を提供し、彼らの動きを予測するのに役立ちます。 特に、流動性分析に優れており、機関がどのように取引しているかを理解しやすくしています。市場のトレンドを予測し、価格の動きを慎重に分析するのに優れています。機関の戦略とトレードを合わせることで、市場の動向についてより正確な予測ができます。このインジケーターは多目的であり、市場構造を分析し、重要な注文ブロックを特定し、さまざまなパターンを認識するのに優れています。 このインジケーターはBOSやCHoCHなどのパターンの識
mql5と Telegramの モーニング・ブリーフィングで、詳細とスクリーンショットを含む毎日のマーケット・アップデートをご覧 ください! FX Power MT5 NGは 、長年の人気を誇る通貨強度計FX Powerの次世代モデルです。 この次世代ストレングスメーターは何を提供するのでしょうか?初代FXパワーの魅力すべて プラス GOLD/XAUの強さ分析 より正確な計算結果 個別に設定可能な分析期間 カスタマイズ可能な計算上限値により、さらに優れたパフォーマンスを実現 もっと見たい人のための特別なマルチインスタンス設定 すべてのチャートでお好みの色を無限に設定可能 数え切れないほどの通知オプションにより、重要なことを見逃すことはありません。 Windows 11とmacOSのスタイルで角を丸くした新しいデザイン 魔法のように動くインジケーターパネル FXパワーの主な機能 すべての主要通貨の強さの完全な履歴 すべての時間枠における通貨の強さの履歴 すべてのブローカーとチャートで同一の計算結果 100%信頼できるリアルタイム計算 -> リペイントなし ドロップダウン・リストから
TPSpro TRENDPRO  - is a trend indicator that automatically analyzes the market and provides information about the trend and each of its changes, as well as giving signals for entering trades without redrawing! The indicator uses each candle, analyzing them separately. referring to different impulses - up or down impulse. Exact entry points into transactions for currencies, crypto, metals, stocks, indices!  -  Version MT4                  DETAILED DESCRIPTION        /       TRADING SETUPS       
IX Powerは 、FX Powerの無敵の精度をついにFX以外のシンボルにも提供します。 お気に入りの指数、株式、コモディティ、ETF、さらには暗号通貨の短期、中期、長期のトレンドの強さを正確に判断します。 お使いの端末が提供する すべてを分析する ことができます。ぜひお試しいただき、取引 タイミングが大幅に改善 されることをご体験ください。 IXパワーの主な特徴 100%正確で再描画されない計算結果 - ターミナルで利用可能なすべての取引シンボルに対して 予め設定され、さらに個別に設定可能な強度分析期間のドロップダウン選択 Eメール、メッセージ、モバイル通知による無数の通知オプション EAリクエストのためのアクセス可能なバッファ カスタマイズ可能な計算制限により、さらに優れたパフォーマンスを実現 もっと見たい人のための特別なマルチインスタンス設定 すべてのチャートでお好みの色を無限に設定可能 Windows 11とmacOSのスタイルで角を丸くした新しいパネルデザイン サブ・ウィンドウとメイン・チャートの間をシームレスに移動する、魔法のように動くイン
これはほぼ間違いなく、MetaTraderプラットフォームで見つけることができる最も完全な調和価格形成自動認識インジケーターです。 19種類のパターンを検出し、フィボナッチプロジェクションをあなたと同じように真剣に受け止め、潜在的逆転ゾーン(PRZ)を表示し、適切なストップロスとテイクプロフィットレベルを見つけます。 [ インストールガイド | 更新ガイド | トラブルシューティング | よくある質問 | すべての製品 ] 19の異なる調和価格形成を検出します プライマリ、派生および補完フィボナッチ投影(PRZ)をプロットします 過去の価格行動を評価し、過去のすべてのパターンを表示します この指標は、独自の品質とパフォーマンスを分析します 適切なストップロスとテイクプロフィットのレベルを表示します ブレイクアウトを使用して適切な取引を通知します すべてのパターン比をグラフにプロットします 電子メール/音声/視覚アラートを実装します スコット・M・カーニーの本に着想を得て、この指標は最も純粋で急を要するトレーダーのニーズを満たすように設計されています。ただし、トレードを
Gartley Hunter Multi - An indicator for searching for harmonic patterns simultaneously on dozens of trading instruments and on all classic timeframes: (m1, m5, m15, m30, H1, H4, D1, Wk, Mn). Manual (Be sure to read before purchasing) | Version for MT4 Advantages 1. Patterns: Gartley, Butterfly, Shark, Crab. Bat, Alternate Bat, Deep Crab, Cypher 2. Simultaneous search for patterns on dozens of trading instruments and on all classic timeframes 3. Search for patterns of all possible sizes. Fr
MetaForecast M5
Vahidreza Heidar Gholami
5 (2)
MetaForecastは、価格データのハーモニクスに基づいて、どんな市場の未来を予測し視覚化します。市場が常に予測可能ではありませんが、価格にパターンがある場合、MetaForecastは可能な限り正確な未来を予測できます。他の類似製品と比較して、MetaForecastは市場のトレンドを分析することでより正確な結果を生成することができます。 入力パラメータ Past size (過去のサイズ) MetaForecastが将来の予測を生成するために使用するバーの数を指定します。モデルは選択したバー上に描かれた黄色の線で表されます。 Future size (将来のサイズ) 予測すべき将来のバーの数を指定します。予測された将来は、ピンクの線で表示され、その上に青い回帰線が描かれます。 Degree (程度) この入力は、MetaForecastが市場で行う分析のレベルを決定します。 Degree 説明  0 Degree 0の場合、価格の全てのピークや谷、そして詳細をカバーするために、「Past size」の入力に大きな値を使用することが推奨されています。  1 (推奨) Degr
今、147ドル(いくつかの更新後に499ドルに増加します) - 無制限のアカウント(PCSまたはMac) RelicusRoad ユーザー マニュアル + トレーニング ビデオ + プライベート Discord グループへのアクセス + VIP ステータス 市場の新しい見方 RelicusRoad は、外国為替、先物、暗号通貨、株式、および指数の世界で最も強力な取引インジケーターであり、トレーダーに収益を維持するために必要なすべての情報とツールを提供します。初心者から上級者まで、すべてのトレーダーが成功するためのテクニカル分析と取引計画を提供します。これは、将来の市場を予測するのに十分な情報を提供する重要な取引指標です。意味をなさないチャート上のいくつかの異なる指標ではなく、完全な解決策を信じています.これは、信号、矢印 + 価格アクション情報を表示するオールインワンのインジケーターで、他に類を見ない非常に正確です。 強力な AI に基づいて、RelicusRoad は不足している情報とツールを提供して、あなたを教育し、トレーディングのプロ、成功したトレーダーにします。
これはMT5のインジケーターで、再描画なしで取引に参入するための正確なシグナルを提供します。 外国為替、暗号通貨、金属、株式、インデックスなど、あらゆる金融資産に適用できます。かなり正確な見積もりを提供し、取引を開始して終了するのに最適な時期を教えてくれます。1つのシグナルを処理しただけでインジケーターの元が取れた例の 動画 (6:22)をご覧ください。Entry PointsPro インジケーターの助けを借りたほとんどのトレーダーの最初の1週間の結果が改善しています。 Telegramグループ に登録してください。Entry Points Proインジケーターのメリットは次の通りです。 再描画のないエントリーシグナル 再描画されるインジケーターでは一度表示されたシグナルが削除されて大きな金銭的損失につながることがありますが、これと異なり、表示されて確認されたシグナルは消えることがありません。 エラーなしの取引開始 インジケーターアルゴリズムによって取引を開始する(資産を売買する)理想的な瞬間を見つけることができます。それを使用するすべてのトレーダーの成功率が向上します。
Matrix Arrow Indicator MT5
Juvenille Emperor Limited
5 (14)
マトリックスアローインジケーターMT5は、すべてのシンボル/商品(外国為替、商品、暗号通貨、インデックス、株式)で使用できる100%再描画されていないマルチタイムフレームインジケーターに続くユニークな10in1トレンドです。マトリックスアローインジケーターMT5は、初期段階で現在のトレンドを判断し、最大10の標準インジケーターから情報とデータを収集します。 平均方向移動指数(ADX) 商品チャネルインデックス(CCI) クラシック平研アシキャンドル 移動平均 移動平均収束発散(MACD) 相対活力指数(RVI) 相対力指数(RSI) 放物線SAR ストキャスティクス ウィリアムズのパーセント範囲 すべてのインジケーターが有効な買いまたは売りシグナルを与えると、対応する矢印がチャートに印刷され、次のろうそく/バーの開始時に強い上昇トレンド/下降トレンドを示します。ユーザーは、使用するインジケーターを選択し、各インジケーターのパラメーターを個別に調整できます。マトリックスアローインジケーターMT5は選択されたインディケーターからのみ情報を収集し、それらのデータのみに基づいてアローを印
The Volume by Price Indicator for MetaTrader 5 features Volume Profile and Market Profile TPO (Time Price Opportunity). Get valuable insights out of currencies, equities and commodities data. Gain an edge trading financial markets. Volume and TPO histogram bar and line charts. Volume Footprint charts. TPO letter and block marker charts including split structures. Versatile segmentation and compositing methods. Static, dynamic and flexible ranges with relative and/or absolute visualizations. Lay
Was: $299  Now: $99   Supply Demand uses previous price action to identify potential imbalances between buyers and sellers. The key is to identify the better odds zones, not just the untouched ones. Blahtech Supply Demand indicator delivers functionality previously unavailable on any trading platform. This 4-in-1 indicator not only highlights the higher probability zones using a multi-criteria strength engine, but also combines it with multi-timeframe trend analysis, previously confirmed swings
クリスマスセール!40% OFF!1月1日に価格が$250に値上がり! GoldenGate Entriesをご紹介します:最先端のトレーディングソリューション! GoldenGate Entries(GGE)を使用して取引する革新的なアプローチを発見しましょう。GGEは、取引体験を向上させるために設計された先進的なインジケーターで、ユーザーに正確性と自信を持たせるための包括的な機能を提供します。 通貨ペア:Any(FX - 商品 - 株式 - 株式 - クリプト) タイムフレーム:15分からH1 主な特徴: 買いと売りの矢印の指示:常に情報を受け取るために、買いと売りの矢印の指示をポップアップアラートとともに受け取ります。 GoldenGate_Algo:GoldenGate_Algoを使用して市場の状況を把握し、市場が「売り過ぎ」または「買い過ぎ」かどうかを評価する強力なツールです。 現在のトレンド分析:視聴中のタイムフレームで現在のトレンドにアクセスして、取引を市場の主流方向に合わせることができます。 組み込みのピボットポイント:組み込まれた
Good day! I present to you a trading technical indicator for Deriv broker synthetic indices. This indicator ONLY works with the following indices: Boom 300 Index Boom 500 Index Boom 1000 Index Crash 300 Index Crash 500 Index Crash 1000 Index The indicator was created to give signals to open medium-term trades in the direction of Spikes. But you can open trades in the opposite direction to Spikes, at your own risk. Trade only on M1. Other TFs do not guarantee the correct operation of the indic
初心者やエキスパートトレーダーに最適なソリューション! このインジケータは、独自の機能と秘密の数式を組み込んだ、ユニークで高品質かつ手頃な価格のトレーディングツールです。たった1枚のチャートで28の通貨ペアのアラートを表示します。新しいトレンドやスキャルピングチャンスの引き金となるポイントを正確に把握することができるので、あなたのトレードがどのように改善されるか想像してみてください! 新しい基本的なアルゴリズムに基づいて構築されているため、潜在的な取引の特定と確認がより簡単になります。これは、通貨の強さや弱さが加速しているかどうかをグラフィカルに表示し、その加速のスピードを測定するためです。加速すると物事は明らかに速く進みますが、これはFX市場でも同じです。つまり、反対方向に加速している通貨をペアにすれば、利益を生む可能性のある取引を特定することができるのです。 通貨の勢いを示す縦の線と矢印は、あなたの取引の指針となるでしょう。 ダイナミックマーケットフィボナッチ23レベルはアラートトリガーとして使用され、市場の動きに適応します。もしインパルスが黄色のトリガーラインに当た
Step into the realm of Forex trading with confidence and precision using XQ, a cutting-edge Forex indicator designed to elevate your trading game to unprecedented heights. Whether you're a seasoned trader or just stepping into the world of currency exchange, XQ Forex Indicator empowers you with the insights and signals needed to make informed trading decisions. The signal conditions are a combination of three indicators, and XQ Forex Indicator only display  medium and long-term trends . The ind
Gartley Hunter - An indicator for searching for harmonic patterns (Gartley patterns) and their projections. The indicator is equipped with a system of alerts and push notifications. Manual (Be sure to read before purchasing) | Version for MT4 Advantages 1. 12 harmonic patterns: 7 classical and 5 exotic. New patterns will be added as the indicator develops. 2. Constant automatic search for harmonic patterns. The indicator is capable of finding from the smallest to the largest patterns. 3. Autom
123パターン は、最も人気のある強力で柔軟なチャートパターンの1つです。このパターンは、3つの価格ポイントで構成されています。ボトム、ピークまたはバレー、および38.2%〜71.8%のフィボナッチリトレースメントです。パターンは、価格が最後のピークまたは谷、インディケーターが矢印をプロットし、アラートを上昇させ、取引を行うことができる瞬間を超えたときに有効と見なされます。 [ インストールガイド | 更新ガイド | トラブルシューティング | よくある質問 | すべての製品 ] クリアな取引シグナル カスタマイズ可能な色とサイズ パフォーマンス統計を実装します カスタマイズ可能なフィボナッチリトレースメントレベル 適切なストップロスおよび利益レベルを表示します インジケーターを使用して、継続パターンまたは反転パターンを見つけることができます 再描画および非再描画ではありません 電子メール/音声/視覚アラートを実装します 123パターン は、継続パターンまたは反転パターンとして現れます。物事を簡単にするために、このインジケーターを使用して、検索するパターンのタイプを選択でき
Wolfe Wavesは、すべての金融市場に存在する自然に発生する取引パターンであり、均衡価格への戦いを表しています。これらのパターンは、短期および長期の時間枠で発生する可能性があり、現在の最も信頼性の高い予測反転パターンの1つであり、通常は強い長期の価格変動に先行します。 [ インストールガイド | 更新ガイド | トラブルシューティング | よくある質問 | すべての製品 ] クリアな取引シグナル 驚くほど簡単に取引できます カスタマイズ可能な色とサイズ パフォーマンス統計を実装します 適切なストップロスおよび利益レベルを表示します 電子メール/音声/視覚アラートを実装します インジケーターはパターンとブレイクアウト矢印を同時に描画し、インジケーターが展開するときにパターンが再描画されないようにします。ただし、エントリのブレイクアウトが何度も発生し、インジケータが再描画される場合、あまり頻繁にではなく控えめに再描画される可能性があります。インジケータは非バックペインティングです。 オオカミの定義 ウルフ波には、次の特性が必要です。 ( 例を見るにはここをクリック ) ウ
iPumpインジケーターは、3つのカテゴリーのインジケーターの利点を組み合わせた用途の広いインジケーターです。 複数のTFでの同時トレンド検出 抵抗とサポートのゾーンを定義する 買われ過ぎと売られ過ぎのゾーンの決定 インジケーター機能: トレンドの定義 この機能は、現在の市場の方向性を客観的に評価し、主観を避けたいすべてのトレーダーに必要です。ほんの一瞬で、最も重要な時間枠でトレンドの方向を比較することができ、これは明確で直感的になります。 サポートとレジスタンスレベルの決定 iPumpインジケーターを使用すると、数秒以内に資産の潜在的な価格障壁を評価できます。 また、インジケーターは目の前にあるレベルのタイプを示します。 テストレベル(抵抗/サポート) 逆転レベル 弱いレベル テストされていないレベル 買われ過ぎと売られ過ぎのゾーンの決定 このタスクでは、インジケーターに遅延や再描画のないシグナルオシレーターがあり、アセットの現在の状態を示します。このデータに基づいて、次のことができます。 購入するのが面白くなる時期を正確に知る 資産を売却することが興味深い
My products are currently 50% off. Explore them and build your own strategy. Royal Scalping Indicator is an advanced price adaptive indicator designed to generate high-quality trading signals. Built-in multi-timeframe and multi-currency capabilities make it even more powerful to have configurations based on different symbols and timeframes. This indicator is perfect for scalp trades as well as swing trades. Royal Scalping is not just an indicator, but a trading strategy itself. Features Price A
Golden Spikes Detector This indicator is based on an advanced strategy primarily for trading spikes on Boom and Crash Indices. Complex algorithms were implemented to detect high probability entries only. It alerts on potential Buy and Sell entries. To trade spikes on the Deriv or Binary broker, only take Buy Boom and Sell Cash alerts. It was optimised to be loaded on 5-minute timeframe although multiple timeframe analysis is done in the background. Features ·             Desktop pop up and sound
作者のその他のプロダクト
The "SyntheticaFX Power Indicator" is an exceptional trading tool designed to offer valuable insights into market strength and potential changes, without revealing its proprietary methodology. This powerful indicator is ideally utilized in conjunction with our specialized tools, the " SyntheticaFX CrashSlayer and " BoomSlayer " Spike Indicators, to provide traders and investors with a comprehensive and dynamic trading experience. When employed alongside our SyntheticaFX CrashSlayer and BoomSlaye
FREE
SyntheticaFX Zones
Hendrik Lodewyk Coetsee
5 (1)
The SyntheticaFX Zones Indicator simplifies the process of identifying key levels in the market where price reversals are likely to occur. By incorporating this tool into their trading strategies, traders can improve their decision-making, enhance risk management, and ultimately increase their chances of success in the financial markets. However, like all technical indicators, it should be used in conjunction with other analysis methods and not relied upon as the sole basis for trading decisions
FREE
SyntheticaFX Spears
Hendrik Lodewyk Coetsee
5 (1)
The SyntheticaFX Indicator serves as a valuable tool for identifying potential regions of price reversal in the market. It achieves this by scrutinizing how an asset's price has historically reacted to specific levels, enabling it to pinpoint areas where a shift in market direction may be imminent. This indicator is presented in a dedicated window, featuring bars along with a central reference line set at 0.00. These elements collectively convey crucial information about the prevailing market se
FREE
SyntheticaFXは、すべてのCrashおよびBoom合成通貨ペア向けに設計された非リペイントのスパイク検出器です。1分間の時間枠で動作します。 ルールはシンプルです。エントリー矢印が表示されたら、それは迫るスパイクを示しています。取引を開始し、1分間のキャンドル15から25本の間にストップロスを設定します。スパイクが発生しない場合、損失を受け入れ、新しいエントリーシグナルを待ちます。スパイクが利益をもたらすと、即座に利益を取るか、3〜5本のキャンドルを保持してから取引を終了します。 これは私にとって効果的であることが証明された戦略に基づいてエントリーシグナルを提供するだけの指標であることに注意してください。SyntheticaFXゾーンインジケーターおよびSyntheticaFXインジケーターと併用することをお勧めします。 インストールしたら、CrashペアではBuy Entryの矢印の色をNoneに変更し、BoomペアではSell Entryの矢印の色をNoneに変更してください。 適切なリスク管理を行い、過度なレバレッジを避けてください。
フィルタ:
レビューなし
レビューに返信