Follow the trends
- インディケータ
- Shengzu Zhong
- バージョン: 1.1
- アクティベーション: 10
5部ごとにコピーが販売されるごとに価格が30ドル上昇します。
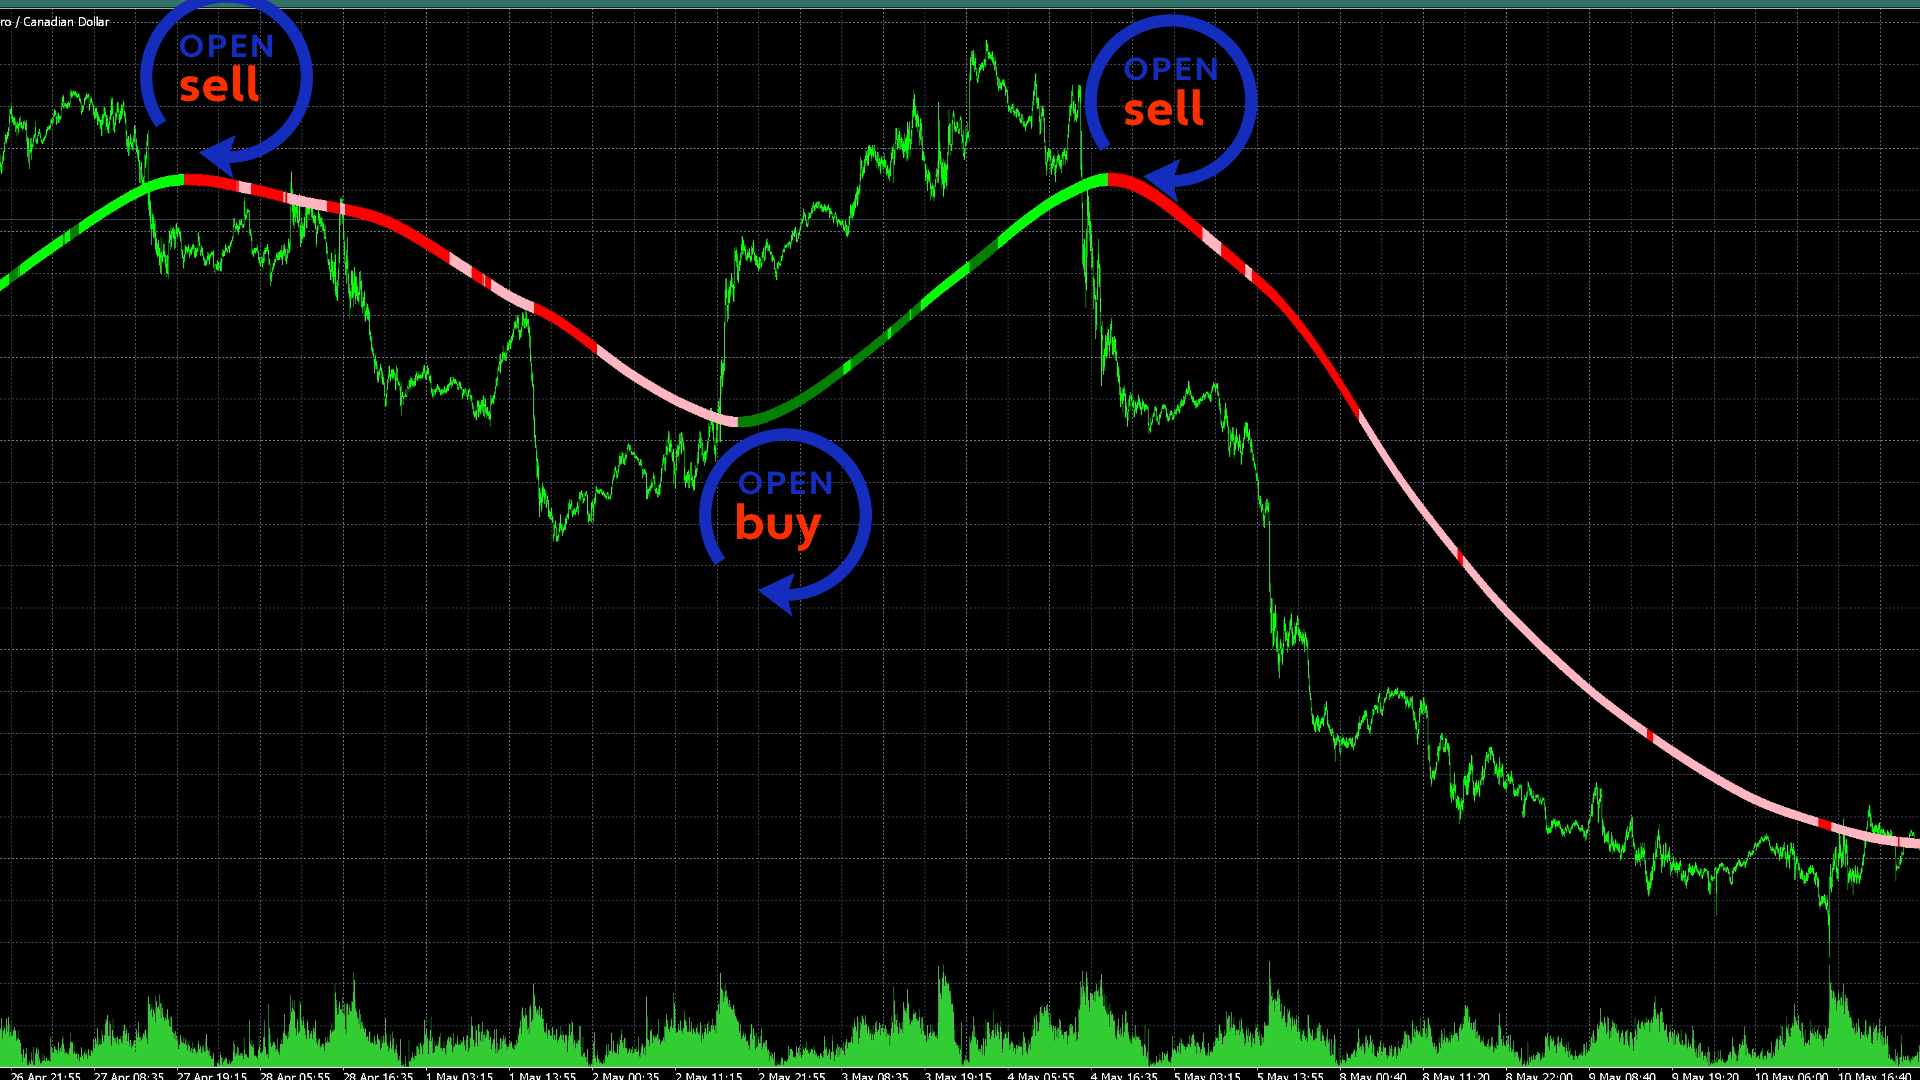
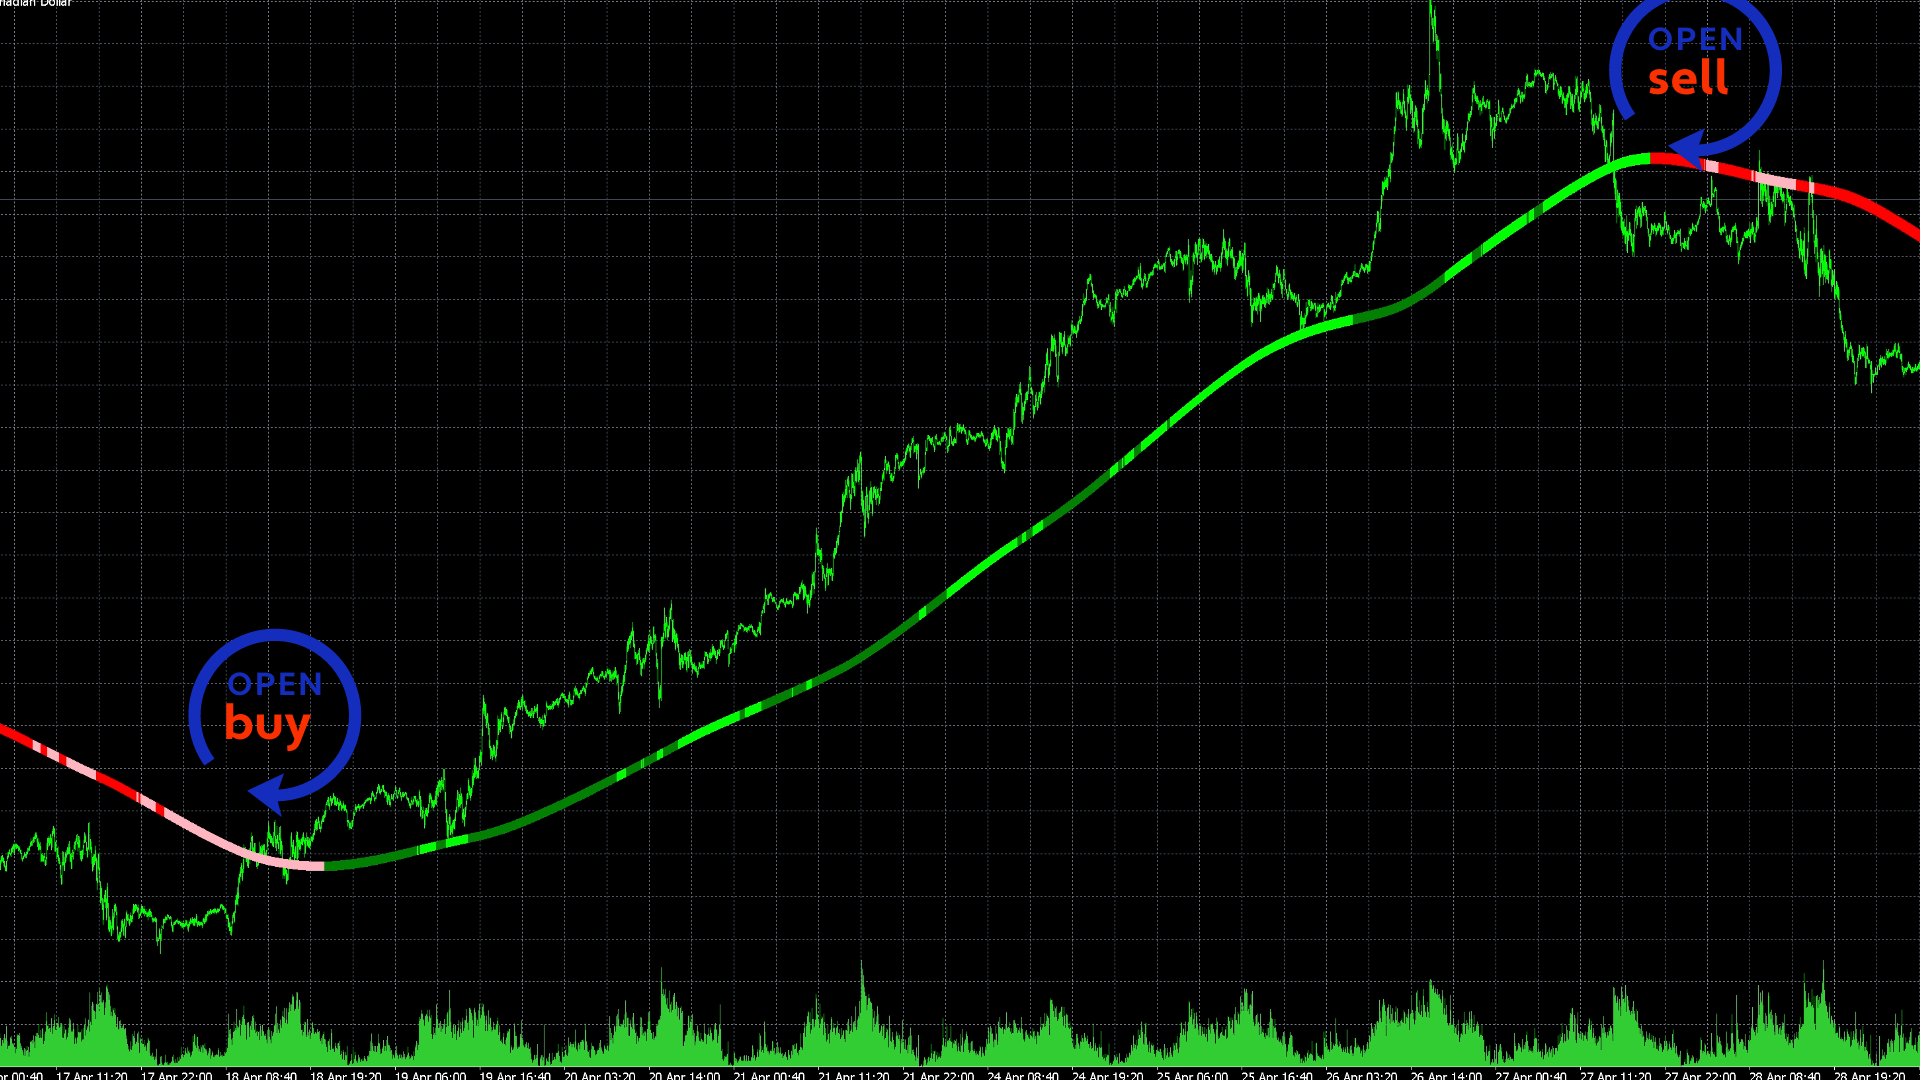
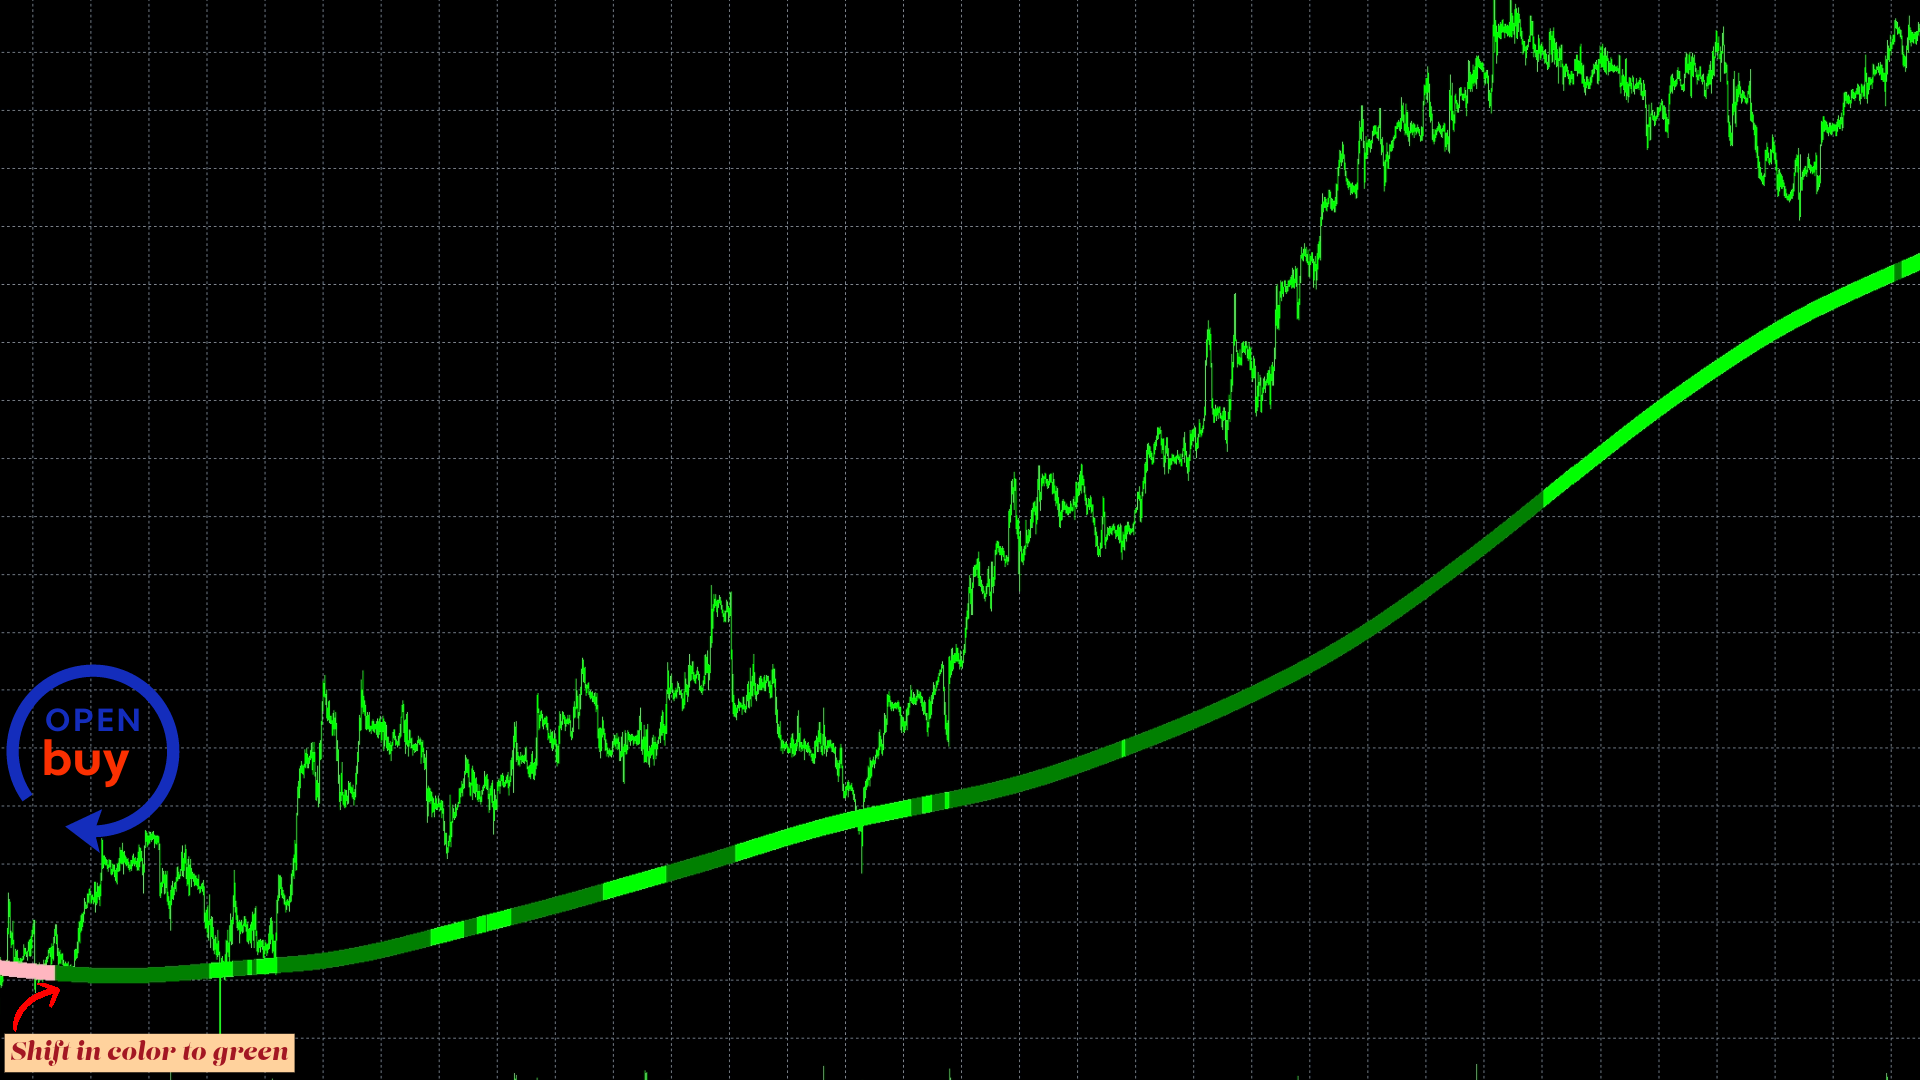
主要なインディケーターは、市場全体の傾向を特定することを目指しています。明るい色と暗い色のカラーシステムは、強い市場と弱い市場の状態を特定する努力です。
私の意見では、このインディケーターは無類です。市場が動き始めるときに非常に効果的に機能します。
より長い時間枠(1時間、4時間、またはデイリーなど)でこのインディケーターを使用する場合、より良い結果が得られるでしょう。
色が緑に変わると、買いの機会を示し、色が赤に変わるとショートポジションを開く提案があります。
最適な結果を得るためには、トレンドのある通貨ペアで取引を検討してください。
これが役立つといいですね。これを活用する方法を見つけたら、ぜひ友達と共有してください。ありがとうございます。