• 概要
  • レビュー
  • コメント

Point Trend Indicator

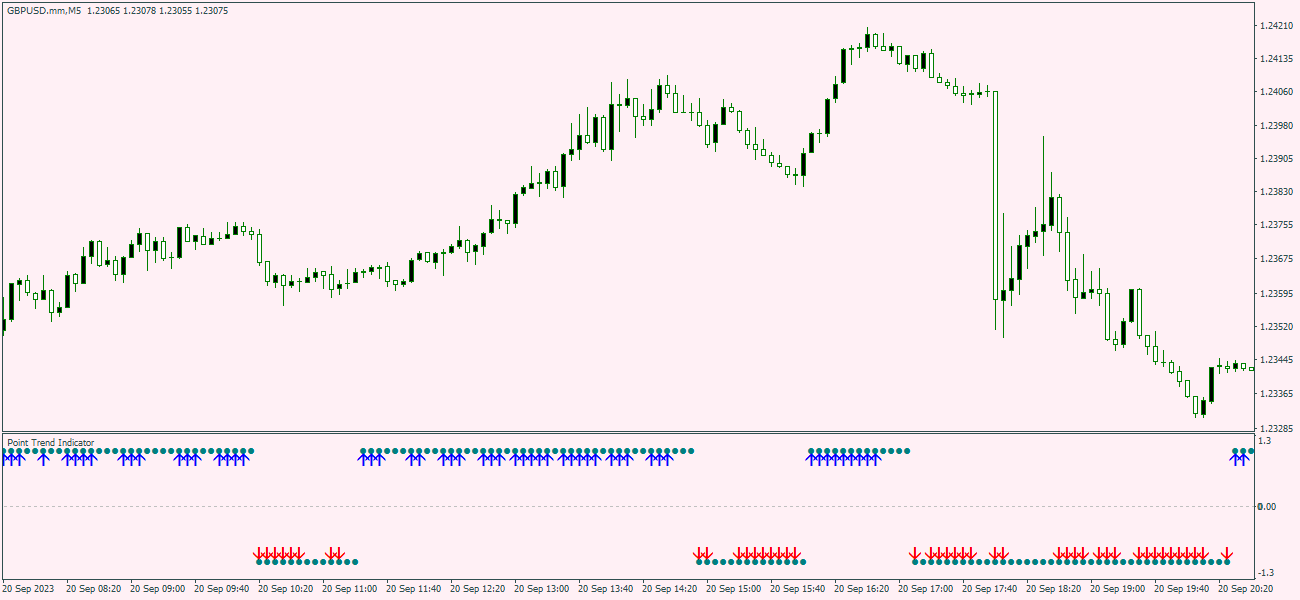
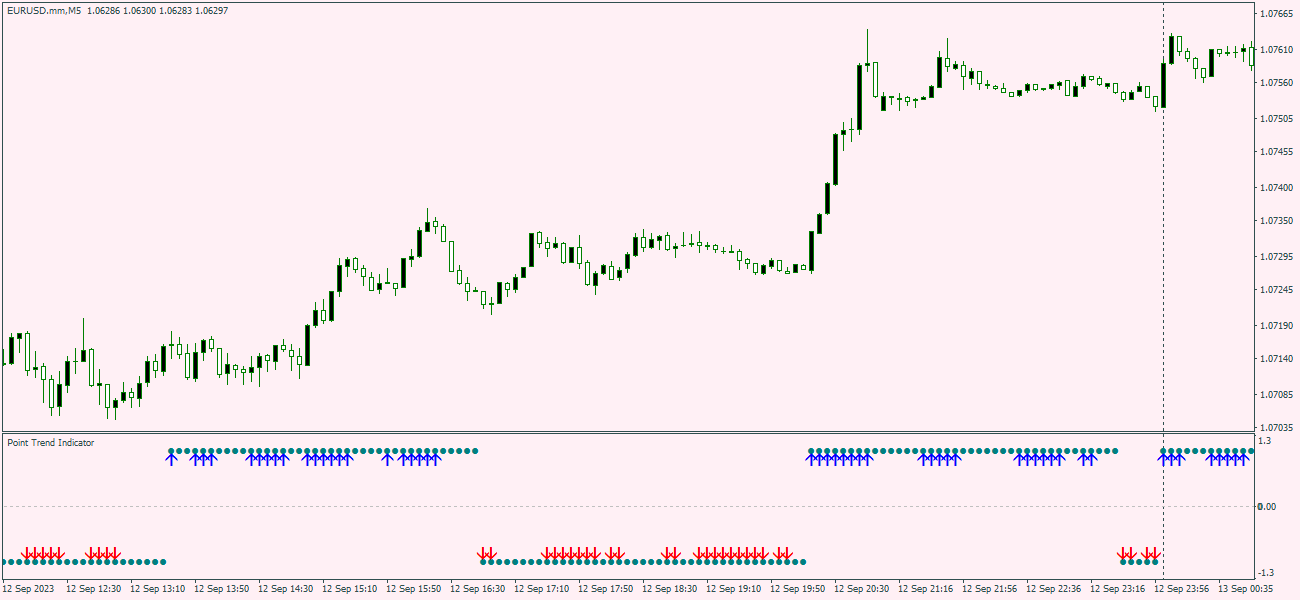
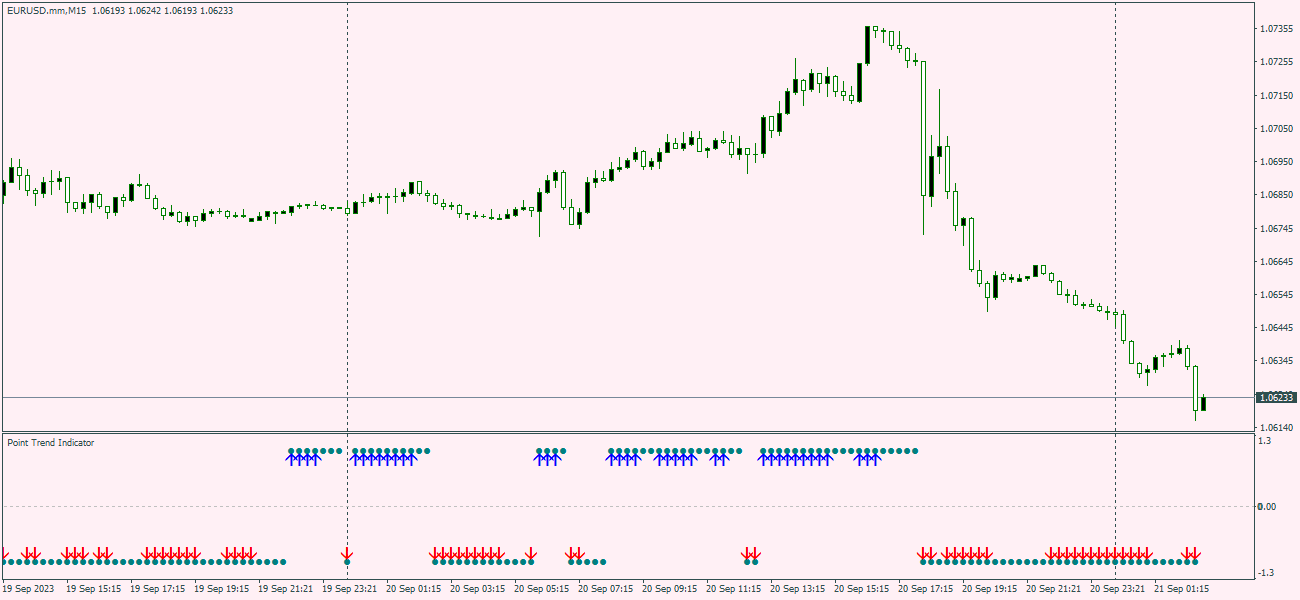
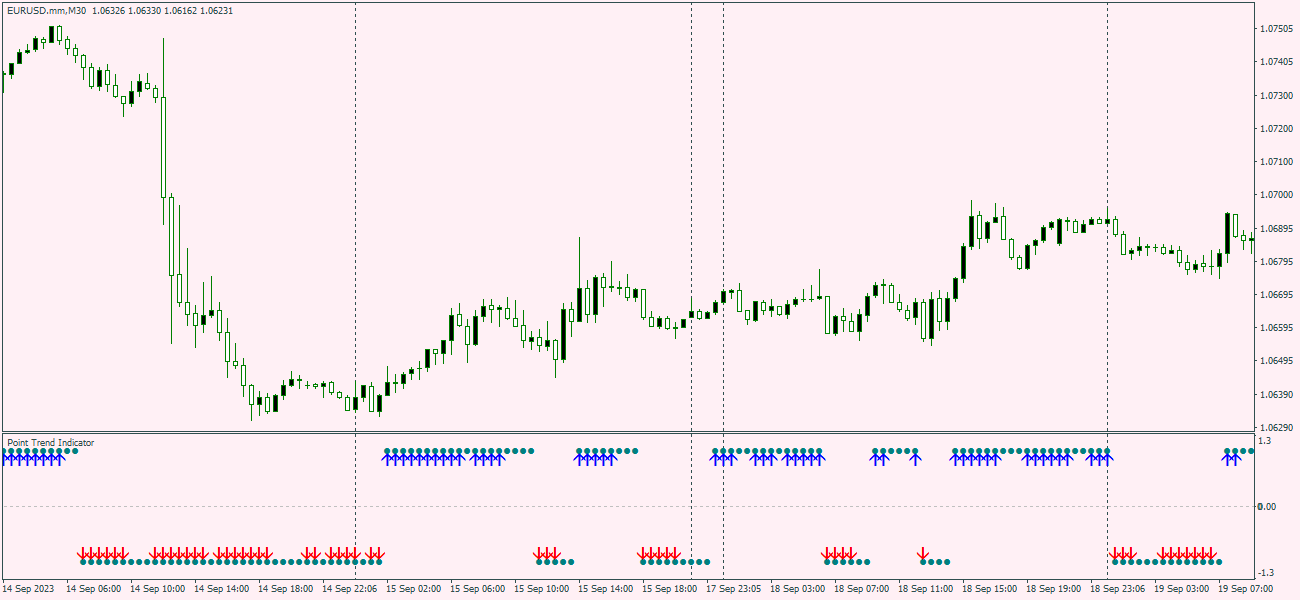
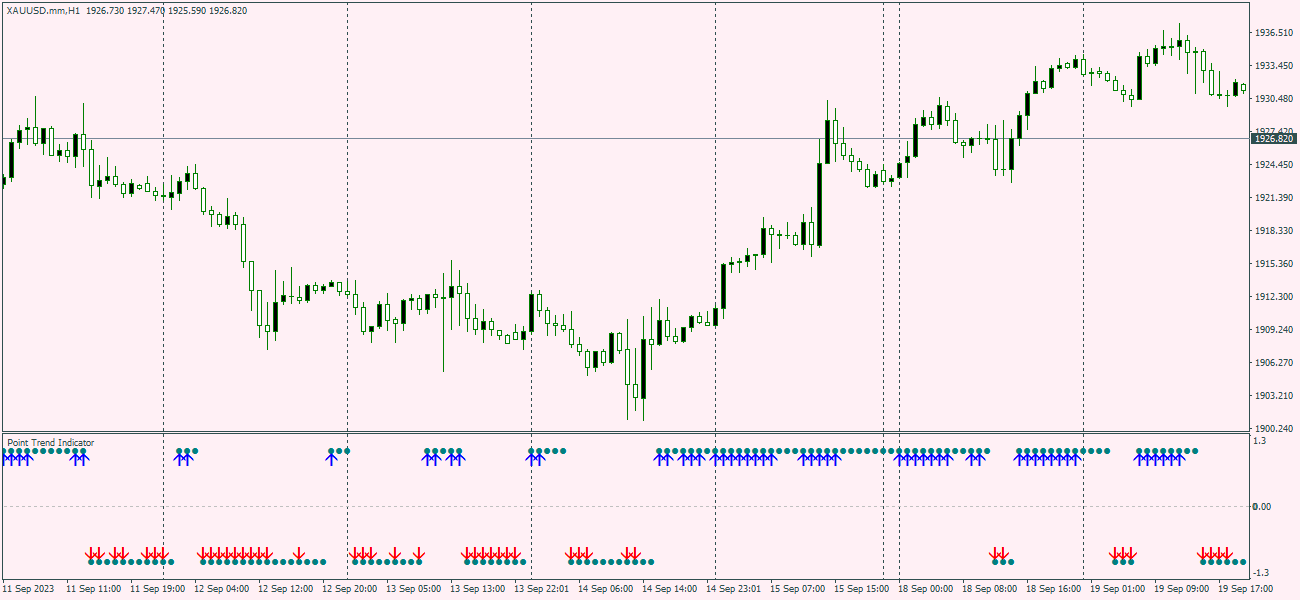
Point Trend Indicator - An indicator of the upper and lower level of the trend, which can determine the trend direction and indicate its strengthening. The trend direction is determined by round dots; if the points are above the zero line, the trend is bullish; if below, the trend is bearish. The increase in directional movement is indicated by arrows. It has the only parameter for manual adjustment - Duration of the trend direction.
 
Possibilities
  • Works on all time frames
  • Adapts to any financial instrument (Forex, Stocks, Metals, Cryptocurrency)
  • Does not redraw (Signals are generated at the close of the candle)
  • Signals have several types of alerts.
  • A simple interface that does not load the visibility of the chart.
  • Can be used alone or complement any trading system.
おすすめのプロダクト
The SuperRSI indicator is an advanced index of internal strength. The indicator shows not the relative strength of the trading instruments being compared, but the internal strength of a single instrument, therefore, it is the “Internal Strength Index”. This is an advanced form of the SuperRSI indicator. It converts the signal so that low-frequency components are delayed much more than high-frequency components. In general, the data of the last bar have more weight than previous data, like an exp
Market Trend - a comprehensive system for determining the trend direction. Analyzes the market using a formula which considers the values of multiple technical indicators and other trading strategies. IT determines not only the current trend direction, but also its movement strength. The indicator is intuitive and very easy to use. The information on the current trend direction and its movement strength are displayed on the chart. If the indicator shows "UP!" then an uptrend is currently present
Determining the current trend is one of the most important tasks of a trading regardless of the trading style. The Atom Trend indicator can help in doing that with a fairly high probability. Atom Trend is a trend recognition indicator, which uses an original calculation algorithm. You can use it on any currency pair and every time frame. It does not change its values. The tick volume can also be used in the calculations as an additional filter. Indicator Parameters Main Settings : VolMode - if
L TL T indicator
Shaban Mir Fazlolah Oreynab
To download the one-month demo version of the indicator, refer to the following link https://s21.picofile.com/file/8445191876/L_TL_T_exp_2022_02_02.ex4 Supply and demand  In all indicators that have the task of drawing support and resistance, the number of levels is so high that it causes a trader to make a mistake.  We draw the last 4 important and valid levels for you using the Price Action method  These surfaces are not easily broken and their breaking is done with long and powerful candlest
Possible Price reversals levels - based on  Fibonacci + Support +  Resistance Levels Auto levels drawn based on input index (Bars Count )  ---->>> Price Over 50% Fibo line ---> UP TREND ---> BUY when price drop near Support Lines  ---->>> Price Down 50% Fibo line ---> DOWN TREND ---> SELL when price goes up  near Resistance Lines  --->>> The more close price levels ----> the more possibility for price reversals --->>> are you a scalper --> try it on M1 charts with big index like 5000 bars  or
Purpose Trend - analyzes the current trend gives an excellent understanding of which direction the market is aimed at, at what point it should be expected in the near future. Unfortunately, most of the popular indicators in practice give a huge number of false signals, since they all work without any consideration of global trends. That is why in today's conditions, when the market is far from stable price movement, it is almost impossible to build a strategy without using trend indicators. H
The Unique Trend indicator tracks market trends, ignoring sharp fluctuations and market noise. The indicator is suitable for trading on small timeframes because it ignores sudden price jumps or price corrections due to the reduction of market noise around the average price. The scan at minima and maxima forms the internal boundaries (channel) when calculating the indicator signals. The channel allows you to remove market noise. iMA and iATR are used to generate signals using the author's algo
Description Shows Heikin-Ashi candles (often misspelled Heiken-Ashi) on the chart and can alert when candles change color. The alert is useful for both entry and exit. The number of candles of the new color before an alert is raised can be set. The alert can be controlled interactively, directly from the chart. Also includes bonus indicators of current spread and ask/bid prices in large text, color coded as price changes. Usage Heikin-Ashi candles give a much better insight to the underlying tre
Dark Sniper arrow indicator. complete lack of redrawing percentage of correct indicator predictions from 80 85% The arrow indicates the direction of the next candle and the possible direction of the trend in the future.  suitable for small m1 timeframes. It is recommended to open deals from 1 to 2 candles. The signal appears on the last candle advantages of the indicator: 1. leading signals. 2.complete lack of redrawing 3. high signal accuracy.
The King of Forex Trend Cloud Indicator is a trend following indicator based on moving averages. The Indicator is meant to Capture both the beginning and the end of a trend. This indicator can be used to predict both short and long terms market trends.  The king of Forex Trend Cloud if paired together with the King of Forex Trend Indicator can give a broad picture in market analysis and forecasts. I have attached images for both the  The king of Forex Trend Cloud on its own and  The king of Fore
can recognize candlestick patterns he also recognizes the lows and highs of the price for a certain time. MTF works on all currency pairs in futures and sulfur, cryptocurrency does not redraw. his work can be seen in the test. you can trade at any time of the day but the preferred trading time during the European American session ----------------------------------------------------------------------------------------------------------------------------------------------------------
Indicator captures the trend reversals with no-repaint Buy and Sell Arrow signals. CyberZingFx Trend Reversal Indicator - your go-to solution for accurate and reliable trend reversal signals. With its  advanced trading strategy , the indicator offers you Buy and Sell Arrow signals that do not repaint, making it a reliable tool for catching Swing Highs and Swing Lows in any market and any time frame. Indicator works on  any market  and  any time frames . __________________________________________
「勾配適応rsi mt4」 - 価格チャートに勾配として表示される適応外国為替指標RSI。 この指標は、トレーダーが現在のトレンドの方向、トレンドの強さ、トレンド反転ポイントを判断するのに役立ちます. 「勾配適応rsi mt4」 - Metatrader4プラットフォーム用に作成され、すべての通貨ペアと時間枠で動作します. 設定の助けを借りて、この「勾配適応rsi mt4」インジケーターは、さまざまな取引戦略で動作するように適応させることができます. 「勾配適応rsi mt4」インジケーターは、その作業にメモリ交換バッファーを使用するため、任意のロボットに簡単に統合して自動化できます。 「 勾配適応rsi mt4」インジケーターの利点: とても素敵で、トレンドの方向性を視覚的に示しています 価格反転ポイントを表示 トレンドの強さを示しています 「勾配適応rsi mt4」インジケーターの設定: Step_period - 指標計算期間。 Smooth - 値を平滑化する方法。 Relativity - 値適応係数。 barsー - インジケーターが表示されるチャート上のバーの数
The indicator algorithm with the highest accuracy generates input signals using the arrows. Strategy for trading in a flat, all the necessary functions built into one tool! The principle of the indicator is to automatically determine the current state of the market when it is placed on a chart, analyze historical data, based on historical data and display instructions to the trader for further actions. The system itself shows in the form of arrows when to buy and when to sell.
The indicator is designed for opening trades for a long period. he is set up to get as many points from each trade as possible. he uses the scalping method... you can trade on any currency pairs indicator is already  you can trade at any time of the day but the preferred time of trading during the European American session. currency pairs eur / jpy, eur / usd currency pairs with high volatility then the results are much better.
Draw by Hand Tool
John Louis Fernando Diamante
5 (1)
This tool provides a freehand drawing method, to treat the chart space as a blackboard and draw by-hand. Drawings can be made to stick to the CHART (moves with chart scroll), or to stick to the WINDOW (does not move with chart scroll). Features: all drawings are individually styled, color, width show/hide each drawing type delete last drawing drawings, on chart and on window, remain through TF changes and terminal re-starts, until the indicator is removed Panel: stylable colors scalable in
This indicator is designed for trend trading and it helps in determining the best entry points. To identify the points, it is necessary to follow the signal line. Once the line crosses the zero level upwards - buy, and when it crosses downwards - sell. In addition to the signal line, the indicator also displays the so-called market "mood" in real time in the form of a histogram. The indicator works on all timeframes and with all instruments. The indicator operation required the Moving Average in
Glazz
Andrei Gerasimenko
Glazz is a great mix of standard Bollinger Bands and ZigZag . The essence of the strategy - is the search for extreme points - possible reversals. When building a signal, we use Bands of a large period and a small ZigZag period. When the indicator has calculated the entire value for signal search, it shows an arrow to buy/sell and gives a sound signal. Simply put, ZigZag is looking for a possible reversal, and Bollinger Bands confirms this reversal. The indicator settings are simple. By defau
Simple indicator that supports decision makers. You will have the candles directions for different timeframes on your screen. That will allowed you to be one more scenario to analyze before you open your orders. In case you would like to have more details, just let me know.. so we can add it to the chart. Multicurrency that in inform you the directions for multi-timeframes!
The Storm Prices indicator is trendy, arrow family. It is easy to work and understand when the first red arrow appears, you need to buy, when the first blue arrow appears, sell. The indicator is used for scalping and pipsing. The indicator makes calculations based on several technical indicators. Determines the direction of the trend and gives a fairly clear indication of the position. The indicator allows you to determine the opportunities for entering the market for a short time. There is a sw
Divergence Formation Hurst (hereinafter "Diver") is based on Hurst exponent used as a measurement of long term memory of time series. Classic (regular) and Reversal (hidden) Divergences - at your choice. Adjustable sizes and all parameters Flexible settings including VOID levels (alert function in place, arrows to show in which direction to trade) No re-paint / No re-draw (must set CalcOnOpenBar =false) "SetIndexBuffer" available for all variables (can be used in EA) Auto-detect 4- and 5-digit p
VictoryTMA  (Triangular Moving Average) is a channel indicator without redrawing, built on the basis of moving averages. The key difference of the  VictoryTMA  indicator from other channel indicators (for example, from the same Bollinger) is that  VictoryTMA  does not take into account simple moving averages, but twice smoothed, which, on the one hand, allows you to more clearly determine the market movement, but the other hand, makes the indicator less sensitive.
The Ceres Trend Indicator displays polynomial regression on history and in the current time. In the indicator settings: module - degree of regression (1 - linear, 2 - parabolic, 3 - cubic, etc.) koeff is the standard deviation channel multiplier. The main direction of application of this indicator is the ability to determine the likelihood of further growth. If there is an intersection of the linear regression line from below, then this indicates a trend inhibition and a possible reversal.
This is an arrow indicator without a future function,developed based on the most advanced profit trading algorithms.It has the most innovative and advanced dual trend analysis module, as well as the latest and highly effective market trend prediction algorithm.Trends are your friends, and following larger trends can earn the maximum profit in foreign exchange. This indicator helps traders identify current trends and track them. Someone once made a profit of 10 times in a week by relying on it.No
Heiken Ashi Smoothed Strategy is a very simple but powerful system to get forex market trend direction. This indicator is actually 2 indicators in 1 pack, Heiken Ashi and Heiken Ashi Smoothed Moving Average both included. Because HA (Heiken Ashi) and HAS (Heiken Ashi Smoothed) are calculated in the same one system event with necessary buffers and loop only, so it is the FAST, OPTIMIZED and EFFICIENT HA having the combined indicator of MetaTrader 4. You can choose to display HA and HAS in the sam
Dear Traders here is my another tool called the "Sell Index". My goal is to come up with different tools to help you trade successfully. No matter the strategy and trading style you use but what matters most at the end is "making money out of the market".  Go with a strategy that works for you and it should be the one you find easy to use. The philosophy behind this tool is "Focus only on sell signals" meaning that if the market is currently bearish why should you focus on buy signals?. Sometime
This indicator supports fast drawing of trendlines 1. Support drawing the next peak higher than the previous peak 2. Support drawing the lower peak after the previous peak 3. Support drawing the lower bottom of the bottom. 4. Support to draw the lower bottom higher than the previous bottom. 5. Support drawing trendline across the price zone. Peak connected vertex 6. Support drawing trendline across price range. Bottom connected Link to download and use for free. Including 02 files s
Crypto Trend Pro
Paulo Martins Barbosa
3 (1)
Concept Crypto Trend  is a system that identify the safest cryptocurrency price trends. This system is focused on a long-term stable growth . It does not need to be constantly updated as it adapts naturally to varied market conditions. No martingale, no grid, no hedge, no other dangerous strategy. Only strict rule-based approach to trading, allowing to maximise return while having risks under control . Get Crypto Trend Pro and never miss the big cryptocurrency movements again. Results
MT4 Indicator Get ahead of the curve with the Wamek Trend Consult indicator . Designed to identify early and continuation trends, this powerful tool empowers traders to enter the market at precisely the right moment, utilizing powerful filters to reduce the number of fake out signals and improve the accuracy of your trades. By precisely analyzing market trends and filtering out false signals, using its advanced algorithms and unparalleled accuracy, the Trend Consult indicator provides traders wi
Dear Traders here is my another tool called the   "Buy Index". My goal is to come up with different tools to help you trade successfully. No matter the strategy and trading style you use but what matters most at the end is "making money out of the market". Go with a strategy that works for you and it must be the one you find easy to use. The philosophy behind this tool is   "Focus only on buy signals"   meaning that if the market is currently bullish why should you focus on sell signals?. Someti
このプロダクトを購入した人は以下も購入しています
Gann Made Easy は、ミスター・ギャンの理論を使用した取引の最良の原則に基づいた、プロフェッショナルで使いやすい外国為替取引システムです。 W・D・ガン。このインジケーターは、ストップロスとテイクプロフィットレベルを含む正確な買いと売りのシグナルを提供します。 PUSH通知を利用して外出先でも取引可能です。 購入後はご連絡ください!私の取引のヒントと素晴らしいボーナスインジケーターを無料で共有します! おそらく、ギャンの取引手法についてはすでに何度も聞いたことがあるでしょう。通常、ギャンの理論は初心者のトレーダーだけでなく、すでにある程度の取引経験がある人にとっても非常に複雑なものです。なぜなら、ギャンの取引手法は理論的にはそれほど簡単に適用できるものではないからです。私はその知識を磨き、最良の原則を私の外国為替インジケーターに組み込むために数年を費やしました。 このインジケーターは非常に簡単に適用できます。必要なのは、それをチャートに添付し、簡単な取引推奨事項に従うだけです。このインジケーターは常に市場分析の仕事を行い、取引の機会を探します。適切なエントリーポイントを検出
まず第一に、この取引インジケーターは再描画されず、再描画されず、遅延しないことを強調する価値があります。これにより、手動取引とロボット取引の両方に理想的なものになります。 アトミックアナリストは、価格の強さとモメンタムを利用して市場でより良いエッジを見つけるためのPA価格アクションインジケーターです。ノイズや誤ったシグナルを除去し、取引ポテンシャルを高めるための高度なフィルターを備えています。複雑なインジケーターの複数のレイヤーを使用して、アトミックアナリストはチャートをスキャンし、複雑な数学的計算をシンプルなシグナルと色に変換します。これにより、どのような初心者トレーダーでも理解して使用し、一貫した取引の決定を行うことができます。 「アトミックアナリスト」は、新規および経験豊富なトレーダー向けにカスタマイズされた包括的な取引ソリューションです。プレミアムインジケーターとトップノッチの機能を1つの取引戦略に組み合わせ、すべてのタイプのトレーダーにとって汎用性のある選択肢にします。 デイリートレーディングとスキャルピング戦略:高速で正確なデイトレーディングおよび短期トレード
現在26%オフ 初心者やエキスパートトレーダーに最適なソリューション! このインジケーターは、独自の機能と新しい計算式を取り入れた、ユニークで高品質、かつ手頃な価格のトレーディングツールです。たった1枚のチャートで28の為替ペアの通貨強度を読み取ることができます。新しいトレンドやスキャルピングチャンスの引き金となるポイントを正確に特定することができるので、あなたのトレードがどのように改善されるか想像してみてください。 ユーザーマニュアルはこちら  https://www.mql5.com/en/blogs/post/697384 これが最初の1本、オリジナルだ! 価値のないクローンを買わないでください。 特別な サブウィンドウの矢印で強い通貨の勢いを表示 GAPがあなたのトレードを導く! 基準通貨や気配値が売られすぎ・買われすぎのゾーン(外相フィボナッチレベル)にあるとき、個別チャートのメインウィンドウに警告表示。 通貨がレンジの外側から反落した場合、プルバック/リバーサルのアラート。 クロスパターンの特別なアラート 複数の時間枠を選択可能で、トレンドを素早く
まず第一に、この取引ツールはノンリペイント、ノンリドロー、ノンラグの指標であり、プロの取引に理想的ですことを強調する価値があります。 スマートプライスアクションコンセプトインジケーターは、新米から経験豊富なトレーダーまで、非常 に強力なツールです。Inner Circle Trader AnalysisやSmart Money Concepts Trading Strategiesなど、20以上の有用な指標を1つに組み合わせています。このインジケーターはスマートマネーコンセプトに焦点を当て、大手機関の取引方法を提供し、彼らの動きを予測するのに役立ちます。 特に、流動性分析に優れており、機関がどのように取引しているかを理解しやすくしています。市場のトレンドを予測し、価格の動きを慎重に分析するのに優れています。機関の戦略とトレードを合わせることで、市場の動向についてより正確な予測ができます。このインジケーターは多目的であり、市場構造を分析し、重要な注文ブロックを特定し、さまざまなパターンを認識するのに優れています。 このインジケーターはBOSやCHoCHなどのパターンの識
Scalper Vault は、スキャルピングを成功させるために必要なすべてを提供するプロフェッショナルなスキャルピング システムです。このインジケーターは、外国為替およびバイナリー オプションのトレーダーが使用できる完全な取引システムです。推奨される時間枠は M5 です。 システムは、トレンドの方向に正確な矢印シグナルを提供します。また、トップとボトムのシグナルとギャン マーケット レベルも提供します。 インジケーターは、プッシュ通知を含むすべてのタイプのアラートを提供します。 インジケータの購入後にご連絡ください。私の個人的な取引の推奨事項と素晴らしいボーナス指標を無料で共有します! 幸せで有益な取引をお祈りします!
TPSpro TRENDPRO  - is a trend indicator that automatically analyzes the market and provides information about the trend and each of its changes, as well as giving signals for entering trades without redrawing! The indicator uses each candle, analyzing them separately. referring to different impulses - up or down impulse. Exact entry points into transactions for currencies, crypto, metals, stocks, indices!  -  Version MT5               DETAILED DESCRIPTION        /       TRADING SETUPS           
Trend Screener
STE S.S.COMPANY
4.83 (86)
トレンドインジケーター、1つのツールに組み込まれたすべての重要なトレンド機能を備えたトレンドトレーディングとフィルタリングのための画期的なユニークなソリューション! これは、すべてのシンボル/商品(外国為替、商品、暗号通貨、インデックス、株式)で使用できる100%再描画されていないマルチタイムフレームおよびマルチ通貨インジケーターです。 トレンドスクリーナーは、チャート内のドットで矢印トレンドシグナルを提供するインジケーターに続く効率的なインジケーターです。 トレンド分析インジケーターで使用できる機能: 1.トレンドスキャナー。 2.最大利益分析を備えたトレンドライン。 3.トレンド通貨強度メーター。 4.アラート付きのトレンド反転ドット。 5.アラート付きの強いトレンドドット。 6.トレンド矢印 毎日の分析例、毎日のシグナルパフォーマンス...など、トレンドスクリーナーインジケーターを使用して、ここで見つけることができます: ここをクリックしてください 期間限定オファー:トレンドスクリーナーインジケーターは、50ドルと生涯でのみご利用いただけます。 (元の価格125 $) MQ
現在20%OFF! 初心者やエキスパートトレーダーのためのベストソリューション! このダッシュボードソフトウェアは、28の通貨ペアで動作しています。それは私達の主要な指標(高度な通貨の強さ28と高度な通貨インパルス)の2に基づいています。それは全体の外国為替市場の大きい概観を与えます。それは、すべての(9)時間枠で28の外国為替ペアのための高度な通貨の強さの値、通貨の動きの速度と信号を示しています。チャート上で1つのインディケータを使用して市場全体を観察し、トレンドやスキャルピングの機会をピンポイントで見つけることができたら、あなたのトレードがどのように改善されるか想像してみてください。 このインディケータには、強い通貨と弱い通貨の識別、潜在的な取引の識別と確認がより簡単になるような機能が搭載されています。このインディケータは、通貨の強さや弱さが増加しているか減少しているか、また、すべての時間枠でどのように機能しているかをグラフィカルに表示します。 新機能として、現在の市場環境の変化に適応するダイナミックなマーケットフィボナッチレベルが追加され、すでに当社のAdvan
SALE NOW! Limited Time Offer! An exclusive indicator that utilizes an innovative algorithm to swiftly and accurately determine the market trend. The indicator automatically calculates opening, closing, and profit levels, providing detailed trading statistics. With these features, you can choose the most appropriate trading instrument for the current market conditions. Additionally, you can easily integrate your own arrow indicators into Scalper Inside Pro to quickly evaluate their statistics and
A key element in trading is zones or levels from which decisions to buy or sell a trading instrument are made. Despite attempts by major players to conceal their presence in the market, they inevitably leave traces. Our task was to learn how to identify these traces and interpret them correctly. Reversal First Impulse levels (RFI)   -  Version MT5                INSTRUCTIONS                 RUS                 ENG                                       R ecommended to use with an indicator   -  
ご紹介   クォンタム トレンド スナイパー インジケーターは 、トレンド反転を特定して取引する方法を変革する画期的な MQL5 インジケーターです。 13年以上の取引経験を持つ経験豊富なトレーダーのチームによって開発されました。     クォンタムトレンドスナイパーインジケーター   は、非常に高い精度でトレンドの反転を識別する革新的な方法で、あなたのトレーディングの旅を新たな高みに押し上げるように設計されています。 ***Quantum Trend Sniper Indicatorを購入すると、Quantum Breakout Indicatorを無料で入手できます!*** クォンタム ブレイクアウト インジケーターは、トレンドの反転を特定するとアラートを発し、矢印を示し、3 つのテイクプロフィットレベルを提案します。 初心者トレーダーにもプロのトレーダーにも適しています。 量子EAチャネル:       ここをクリック MT5のバージョン:       ここをクリック 推奨事項: 期間: すべての時間枠。最良の結果を得るには、
ご紹介     Quantum Breakout PRO は 、ブレイクアウト ゾーンの取引方法を変革する画期的な MQL5 インジケーターです。 13年以上の取引経験を持つ経験豊富なトレーダーのチームによって開発された Quantum Breakout PROは 、革新的でダイナミックなブレイクアウトゾーン戦略により、あなたの取引の旅を新たな高みに押し上げるように設計されています。 クォンタム ブレイクアウト インジケーターは、5 つの利益ターゲット ゾーンを備えたブレイクアウト ゾーン上のシグナル矢印と、ブレイクアウト ボックスに基づいたストップロスの提案を提供します。 初心者トレーダーにもプロのトレーダーにも適しています。 量子EAチャネル:       ここをクリック MT5バージョン:   ここをクリック 重要!購入後、インストールマニュアルを受け取るためにプライベートメッセージを送ってください。 推奨事項: 時間枠: M15 通貨ペア: GBPJPY、EURJPY、USDJPY、NZDUSD、XAUUSD アカウントの種類: ECN、Raw、また
Advanced Supply Demand
Bernhard Schweigert
4.92 (310)
現在33%オフ 初心者にもエキスパートトレーダーにも最適なソリューション このインジケーターは独自の機能と新しい公式を多数内蔵しており、ユニークで高品質かつ手頃な取引ツールです。このアップデートでは、2つの時間枠ゾーンを表示できるようになります。より長いTFだけでなく、チャートTFとより長いTF(ネストゾーンを表示)の両方を表示できます。すべてのSupply Demandトレーダーの皆さんのお気に召すはずです。:) 重要情報の公開 Advanced Supply Demandの可能性を最大化するには、 https://www.mql5.com/ja/blogs/post/720245 にアクセスしてください。   エントリーまたはターゲットの正確なトリガーポイントを正確に特定できれば取引がどのように改善されるか想像してみてください。新しい基盤となるアルゴリズムに基づいて構築されているため、買い手と売り手の間の潜在的な不均衡をさらに簡単に特定できます。これは、最も強い需要と供給のゾーンと、過去のパフォーマンス(古いゾーンを表示)がグラフィカルに表現されるためです。これらの機能は、最適
カスタムMT4インジケーターで外国為替取引を成功させるための秘密を発見してください! 外国為替市場で成功を達成し、リスクを最小限に抑えながら一貫して利益を得る方法を疑問に思ったことはありますか? これがあなたが探している答えです! 取引へのアプローチに革命をもたらす独自のMT4インジケーターを導入できるようにします。 ユニークな汎用性 私たちのインジケータは、RenkoとRangeBarのろうそくのフォーメーションを好むユーザー向けに特別に設計されています。 これらのチャートタイプは多くの経験豊富なトレーダーに好まれていることを理解しています。そのため、私たちのインジケーターはそれらとシームレスに統合され、比類のない市場分析を提供します。 クリアトレンドシグナル 複雑な分析を忘れてください! 私たちのインジケーターは、鮮やかな色と明確なドット構造を利用して、市場の動向を明確に示しています。 赤と青の点は、価格の動きの方向性について疑いの余地がなく、取引の迅速な意思決定を可能にします。 HH/HL HL/LL戦略とのアライメント HH/HLおよびHL/LL構
驚異的なFXインジケーター「Miraculous」をご紹介します。完璧な結果を得るための1時間足を含むすべてのタイムフレームで効果的に機能する、最強の強力な特殊MT4フォレックスインジケーターです。 すべてのタイムフレームで優れた結果を提供する最高のFXインジケーターを探し続けるのに疲れましたか?これ以上探す必要はありません!「Miraculous」フォレックスインジケーターをご紹介します。このインジケーターは、トレーディングの経験を変革し、収益を新たなレベルに引き上げるために設計されました。 先進のテクノロジーと長年にわたる緻密な開発に基づいて構築された「Miraculous」フォレックスインジケーターは、FX市場における力と正確さの頂点となります。この素晴らしいツールは、すべてのレベルのトレーダーのニーズを満たすように設計されており、一貫した収益性を追求する上で比類のない優位性を提供します。 「Miraculous」フォレックスインジケーターの他との違いは、その非常に適応性にあります。デイトレーダー、スウィングトレーダーであろうと、長期ポジションを好む方であろうと、このインジケータ
Break & Retest is unstoppable when combined with our other divergence indicator. After purchase, send us a message and you could get this  2nd indicator  for  FREE  as a  BONUS! ‍You can visually backtest Break & Retest to see how it behaved in the past!    Manual guide:   Click here $59  for the first 25 copies ( 4  left)! Next price is $120 .  After many months of hard work and dedication, we are extremely proud to present you our  Break and Retest price action indicator crea
これはMT4のインジケーターで、再描画なしで取引に参入するための正確なシグナルを提供します。 外国為替、暗号通貨、金属、株式、インデックスなど、あらゆる金融資産に適用できます。かなり正確な見積もりを提供し、取引を開始して終了するのに最適な時期を教えてくれます。1つのシグナルを処理しただけでインジケーターの元が取れた例の 動画 (6:22)をご覧ください。Entry PointsPro インジケーターの助けを借りたほとんどのトレーダーの最初の1週間の結果が改善しています。 Telegramグループ に登録してください。Entry Points Proインジケーターのメリットは次の通りです。 再描画のないエントリーシグナル 再描画されるインジケーターでは一度表示されたシグナルが削除されて大きな金銭的損失につながることがありますが、これと異なり、表示されて確認されたシグナルは消えることがありません。 エラーなしの取引開始 インジケーターアルゴリズムによって取引を開始する(資産を売買する)理想的な瞬間を見つけることができます。それを使用するすべてのトレーダーの成功率が向上します。
通貨強さウィザードは、取引を成功させるためのオールインワン ソリューションを提供する非常に強力な指標です。このインジケーターは、複数の時間枠のすべての通貨のデータを使用して、このまたはその外国為替ペアのパワーを計算します。このデータは、使いやすい通貨インデックスと通貨パワーラインの形式で表され、特定の通貨のパワーを確認するために使用できます。 必要なのは、取引したいチャートにインジケーターを接続することだけです。インジケーターは、取引する通貨の実際の強さを示します。このインジケーターは、トレンドに合わせて取引するときに有利に利用できる売買高の圧力の極値も示します。このインジケーターには、フィボナッチに基づく可能なターゲットも表示されます。 このインジケーターは、PUSH 通知を含むあらゆるタイプのアラートを提供します。 購入後ご連絡下さい。私の取引のヒントをあなたと共有し、素晴らしいボーナスインジケーターを無料で提供します! 幸せで有益な取引をお祈りします。
TrendMaestro
Stefano Frisetti
5 (2)
note: this indicator is for METATRADER4, if you want the version for METATRADER5 this is the link: TRENDMAESTRO recognizes a new TREND in the bud, he never makes mistakes. The certainty of identifying a new TREND is priceless. DESCRIPTION TRENDMAESTRO identifies a new TREND in the bud, this indicator examines the volatility, volumes and momentum to identify the moment in which there is an explosion of one or more of these data and therefore the moment in which prices have strong probability of f
TrendDecoder Premium
Christophe, Pa Trouillas
5 (3)
レンジと次の動きを特定    |  トレンドの最も早いシグナルと強さを得る   |  反転の前に明確な出口を得る   |  価格がテストするフィボ・レベルを見つける。 非リペイント、非遅延インディケータ - マニュアルおよび自動売買に最適 - すべての資産、すべての時間単位に対応 期間限定キャンペーン   >> 50%OFF 購入後、 推奨セッティングについては、このチャンネルで私に連絡してください。 MT5 バージョン: ここをクリック BladeSCALPER   と   PowerZONES   を使った完全な方法を入手する どのようなものですか? TrendDECODERは、トレンド監視をシンプルかつ簡単にするための複数のイノベーションを集約したものです。 Projective TrendLine (投影トレンドライン) - 今後のトレンドのスピードリファレンス。 RealTime TrendLine vs. Projective TrendLine (リアルタイムトレンドライン vs. Projective TrendLine) - 市場が同じ方
複数通貨と複数フレームの売買に関するアラート。 自動トレーリングストップとリスク報酬で利益を獲得! インジケーターが市場をスキャンして分析するため、何もする必要はありません。 1 つのチャートですべての通貨を取引しましょう!   購入後、コメントを残して私に連絡してください。トレードアシスタントEAをお送りします。 このインジケーターはいくつかのオシレーターと付属のフィルターを使用して、最良の確認されたエントリーポイントを見つけますので、それについて心配する必要はありません。 警告が表示され、監視することを選択したすべての時間枠と通貨のボタンが描画されます。 ボタンを押すだけでチャートに移動し、取引を開始できます。 このインジケーターは、すべての基本通貨と市場監視通貨の強さパネルも描画します (設定で調整可能)。これにより、すべてのペアの通貨と選択されたより高い時間枠が表示されます。 インジケーターウィンドウ: チャート通貨のトレンドフィルターとマルチタイムフレームトレンドパネルを備えた特別なMACDヒストグラム! すべての通貨と時間枠の取引アラートを提供し、
mql5と Telegramの モーニング・ブリーフィングで、詳細とスクリーンショットを含む毎日のマーケット・アップデートをご覧 ください! FX Power MT4 NGは 、長年の人気を誇る通貨強度計FX Powerの次世代モデルです。 この次世代ストレングスメーターは何を提供するのでしょうか?初代FXパワーの魅力すべて プラス GOLD/XAUの強さ分析 より正確な計算結果 個別に設定可能な分析期間 カスタマイズ可能な計算上限値により、さらに優れたパフォーマンスを実現 もっと見たい人のための特別なマルチインスタンス設定 すべてのチャートでお好みの色を無限に設定可能 数え切れないほどの通知オプションにより、重要なことを見逃すことはありません。 Windows 11とmacOSのスタイルで角を丸くした新しいデザイン 魔法のように動くインジケーターパネル FXパワーの主な機能 すべての主要通貨の強さの完全な履歴 すべての時間枠における通貨の強さの履歴 すべてのブローカーとチャートで同一の計算結果 100%信頼できるリアルタイム計算 -> リペイントなし ドロップダウン・リストから
Price Action Entry Alerts
Stephen Sanjeeve Sahayam
5 (3)
このインジケーターは、売買圧力についてすべてのバーをスクリーニングし、最大量の 4 種類のローソク足パターンを特定します。次に、これらのローソク足はいくつかの線形フィルターを使用してフィルター処理され、買いまたは売りのシグナルが表示されます。シグナルは、より高い時間枠の方向と組み合わせて、取引量が多い時間帯に取引される場合に最も効果的に機能します。すべてのフィルターはカスタマイズ可能で、独立して動作します。ボタンをクリックするだけで単一方向の信号を表示できます。 このインジケーターには、意思決定プロセスに役立つ最も重要な価格アクションとスマート マネーの概念も組み込まれています。 シグナルとトレードに関する教育をすべて 1 つのツールにまとめました。 特徴: 信号は再描画されません。 飲み込むキャンドル、拒否キャンドル、拡張範囲キャンドル、ピンバーを識別します。 有効なシグナルごとに複数のエントリー、ストップロス、複数のテイクプロフィットレベルを表示します。 大容量セッションでフィルタリングします。 サポート/レジスタンスレベルとローソク足の構造でフィルターします。 MACD ヒ
現在31%オフ! 初心者やエキスパートトレーダーに最適なソリューション! このインジケータは、独自の機能と秘密の数式を組み込んだ、ユニークで高品質かつ手頃な価格のトレーディングツールです。たった1枚のチャートで28の通貨ペアのアラートを表示します。新しいトレンドやスキャルピングチャンスの引き金となるポイントを正確に把握することができるので、あなたのトレードがどのように改善されるか想像してみてください! 新しい基本的なアルゴリズムに基づいて構築されているため、潜在的な取引の特定と確認がより簡単になります。これは、通貨の強さや弱さが加速しているかどうかをグラフィカルに表示し、その加速のスピードを測定するためです。加速すると物事は明らかに速く進みますが、これはFX市場でも同じです。つまり、反対方向に加速している通貨をペアにすれば、利益を生む可能性のある取引を特定することができるのです。 通貨の勢いを示す縦の線と矢印は、あなたの取引の指針となるでしょう。 ダイナミックマーケットフィボナッチ23レベルはアラートトリガーとして使用され、市場の動きに適応します。もしインパルスが黄色
FX Volume
Daniel Stein
4.6 (35)
mql5と Telegramの モーニング・ブリーフィングで、詳細とスクリーンショットを含む毎日のマーケット・アップデートをご覧 ください! FX Volumeは、ブローカーの視点から市場のセンチメントをリアルに洞察する、最初で唯一の出来高インジケーターです。 ブローカーのような機関投資家が外国為替市場でどのようなポジションをとっているか、COTレポートよりもはるかに速く、素晴らしい洞察を提供します。 この情報をチャート上で直接見ることは、あなたの取引にとって真のゲームチェンジャーであり、画期的なソリューションです。 以下のようなユニークなマーケットデータ洞察から利益を得てください。 比率は 、通貨のロングポジションとショートポジションの比率をパーセントで表示します。 比率の変化は 、選択した期間内のロング比率とその変化率を表示します。 Volumes Totalは 、通貨の取引量(ロングとショート)の合計をロット単位で表示します。 Volumes Long :全通貨のロングポジションの取引量を表示します。 Volumes(ショート )は、全通貨のショートポジションの取引量を表示
Thise indicator is up down v6  comes with tradingwiev version. purchased people, after installed on terminal ,contact me on mql5  to get BONUS  TradingView version. up-down indicator is no repaint and works all pairs and lower than weekly time frames charts. it is suitable also 1 m charts for all pairs. and hold long way to signal. dont gives too many signals. when red histogram cross trigger line that is up signal.and price probably will down when blue histogram cross trigger line that is dow
How to use Pair Trading Station Pair Trading Station is recommended for H1 time frame and you can use it for any currency pairs. To generate buy and sell signal, follow few steps below to apply Pair Trading Station to your MetaTrader terminal. When you load Pair Trading Station on your chart, Pair Trading station will assess available historical data in your MetaTrader platforms for each currency pair. On your chart, the amount of historical data available will be displayed for each currency pai
PRO Renko Systemは、特別にRENKOチャートを取引するために設計された高精度の取引システムです。 これは、様々な取引商品に適用することができる普遍的なシステムです。 システムは効果的に正確な逆転信号へのアクセスを与えるいわゆる市場の騒音を中和する。 表示器は非常に使いやすく、信号の生成に責任がある1つの変数だけがあります。 あなたは簡単にお好みの任意の取引ツールとレンコバーのサイズにツールを適応させることができます。 私はいつもあなたが私のソフトウェアで収益性の高い取引を支援するために余分なサポートを提供する準備ができています! 私はあなたに幸せで収益性の高い取引をしたいです! ご購入後にご連絡ください! 私はあなたに私のレンコチャートジェネレータを送信します。 私はまた、私の個人的な推奨事項やシステムの他のモジュールを無料で共有します!
まず最初に、このトレーディングシステムがリペイントされず、再描画されず、遅延しないことを強調する価値があります。これにより、プロのトレーディングに最適な状態になります。 「スマートサポートアンドレジスタンストレーディングシステム」は、新規および経験豊富なトレーダー向けにカスタマイズされた高度なインジケーターです。この包括的なシステムは、7以上の戦略、10のインジケーター、およびデイトレード戦略、スイングトレード戦略、サポートおよびレジスタンス戦略、ローソク足パターン戦略、VWAP戦略、マルチタイムフレームトレンド戦略など、さまざまなトレーディングアプローチを組み合わせています。これは、矢印信号、エントリーポイント、出口ポイント、トレードアラート、より高い時間枠のトレンド分析、リアルタイムのトレードモニタリング、そして洞察力のあるトレンドとボリュームキャンドルの着色を提供します。自動的なサポートとレジスタンスの検出により、さまざまな市況下でトレーダーが的確な決定を下すのを支援する多面的なインジケーターとなっています。 スマートサポートアンドレジスタンストレーディングシステムは、
Cycle Sniper
Elmira Memish
4.4 (35)
NEW YEAR SALE PRICE FOR LIMITED TIME!!! Please contact us after your purchase and we will send you the complimentary indicators to complete the system Cycle Sniper is not a holy grail but when you use it in a system which is explained in the videos, you will feel the difference. If you are not willing to focus on the charts designed with Cycle Sniper and other free tools we provide, we recommend not buying this indicator. We recommend watching the videos about the indiactor and system before pu
作者のその他のプロダクト
The "Scalper Arrows" indicator is designed for the scalping method of trading within trend directions. Operating principle of the indicator. Large arrows indicate the direction of the trend. Red arrows - for bearish direction, Green arrows for bullish. Within a bullish or bearish trend, there is an algorithm for generating scalping signals in the form of small arrows. Also, trend direction lines are drawn in the direction of the trend, and small arrow signals are generated in their direct
Wave Reversal Indicator - determines the direction of trend waves and price reversals. The indicator shows wave movements and trend directions. It gives recommendations where to follow the trader, helps to follow the trading strategy. It is an addition to an intraday or medium-term strategy. Almost all parameters are selected for each time frame and are changed automatically, the only parameter for manual adjustment is the wavelength. Works on various trading instruments and timeframes, rec
FREE
The BB Reversal Arrows technical trading system has been developed to predict reverse points for making retail decisions. The current market situation is analyzed by the indicator and structured for several criteria: the expectation of reversal moments, potential turning points, purchase and sale signals. The indicator does not contain excess information, has a visual understandable interface, allowing traders to make reasonable decisions. All arrows appear to close the candle, without redr
Arrow indicator with trend filter. Generates trend input without delays or delays - on the emerging candle. Suitable for use on any trading tools and timeframes. Easy to use, contains the direction of the trend in the form of a histogram lines and signal generator. Input parameters Period Trend Line - Period of the Histogram Line Signal Generator Period - If the period is longer, then the arrows are less Play sound Display pop-up message Send push notification Send email Sound file signal -
FREE
Volatility Trend System - a trading system that gives signals for entries. The volatility system gives linear and point signals in the direction of the trend, as well as signals to exit it, without redrawing and delays. The trend indicator monitors the direction of the medium-term trend, shows the direction and its change. The signal indicator is based on changes in volatility and shows market entries. The indicator is equipped with several types of alerts. Can be applied to various trading
The indicator " ZigZag on Trend " is an assistant in determining the direction of price movement, as well as a calculator of bars and points. It consists of a trend indicator, which follows the price direction by the trend line presented in the form of a zigzag and a counter calculating the number of bars traversed in the direction of the trend and the number of points on the vertical scale. (calculations are carried out by the opening of the bar) The indicator does not redraw. For convenience,
A technical indicator that calculates its readings on trading volumes. In the form of a histogram, it shows the accumulation of the strength of the movement of the trading instrument. It has independent calculation systems for bullish and bearish directions. Works on any trading instruments and time frames. Can complement any trading system. The indicator does not redraw its values, the signals appear on the current candle. It is easy to use and does not load the chart, does not require additi
Smoothed oscillator based on basic DeMarker indicators. Shows the volatility of the price direction. Can be used to determine intraday entry and exit points from the market. Suitable for use on all time frames and trading instruments. It is recommended to use on M5, M15 and M30. The green line shows the price direction up, the blue line shows the price direction down. The red line is a smoothed representation of the price. Input parameters      Period - Period of the main indicator DeMarker
FREE
Cluster indicator working in the price channel. For operation, the indicator builds a channel line - (dashed line). Inside the channel, cluster sections are determined that determine the direction of the price movement - (histograms in two directions), start with large arrows. Small arrows are plotted above / below each histogram - indicator increase volatility. The indicator does not redraw the values. Works on any tools and timeframes. Entrances are made when large arrows appear, inside s
A trend indicator showing the strength of bulls and bears in a trading range. Consists of two lines: The green line is a balanced overbought/oversold condition. The red line is the direction of trading activity. Does not redraw calculations. Can be used on all Symbols/Instruments/Time Frames. Easy to use and set up. How to use the indicator and what it determines. The basic rule is to follow the direction of the red line: if it crosses the green line from the bottom up, the market i
FREE
Zig-Zag indicator with additional signals for inputs. Visually easy to use: The red zig-zag line is an uptrend. The blue zig-zag line is a downward trend. Arrows in the form of additional signals. Works on any trading pairs. On any timeframe. Not redrawn. Input parameters Zig-Zag Period - Zig-zag period (from 5) Signal Period - period of signal arrows (from 3) Alerts for signals Play sound - Sound alert Display pop-up message - Notification by message on the screen Send push not
Signal indicator that displays price reversals from the upper and lower corners of the chart. It is adjusted for different volatility and timeframes by one parameter - Gradation . Works on any trading pairs. The recommended timeframe for use is from M15 and higher. Not redrawn. If necessary, I will help you choose the optimal setting. Input parameters Gradation - from 0 and higher. If the parameter is larger, arrows are displayed at shorter price intervals. Alerts for signals Play so
Developed methods for trading collected in one indicator. In the form of arrows, it defines entries in the direction of the trend. It has 2 types of arrows - trend and signal guides, informing about the potential movement in the direction of the trend. Works without redrawing, ready for use on all symbols/tools. The most suitable time frames to use are M15, M30, H1, H4. How to use The indicator finds the direction of the trend in the form of a signal arrow, a graphic rectangle stretches
Cyclical indicator for trading and predicting the direction of the market. Shows the cyclical behavior of the price in the form of an oscillator. Gives signals for opening deals when rebounding from the upper and lower boundaries of the oscillator. In the form of a histogram, it shows the smoothed strength of the trend. Will complement any trading strategy, from scalping to intraday. The indicator does not redraw. Suitable for use on all symbols/instruments. Suitable time frames for short-term
Scalping Entry Points - is a manual trading system that can adjust to price movements and give signals to open trades without redrawing. The indicator determines the direction of the trend by the central level of support and resistance. The dot indicator provides signals for entries and exits.  Suitable for manual intraday trading, scalping and binary options. Works on all time frames and trading instruments. The indicator gives several types of alerts. How to use the product The blue line
Candle Binary Scalper - is a technical analysis product for forex and binary options. Includes several technical indicators combined into a trading system. Suitable for manual trading within a trend, for scalping and binary options. Works on all time frames and trading instruments. Recommended Timeframes for trading M15, M30, H1 and H4, M5 and M1 should be used in case of high volatility. There are several types of alerts. How to use the product The optimal settings have already been sel
Cyclic Channel Stops - an analytical tool that allows you to conduct a cyclical analysis of price movements. The indicator specializes in modeling price behavior for making trading decisions. Adjusts to work on all time frames and trading instruments. There are several types of alerts. How the indicator works The wave algorithm calculates the specified number of candles and adjusts the indicator line to the price movement, continuing it or reversing it. Adjustable parameters set the cycl
Binary Lines is a technical analysis indicator for currencies, commodities, cryptocurrencies, stocks, indices and any financial instruments. Can be used for binary options or Forex scalping. Shows entry and exit points at fixed intervals and provides traders the necessary information about the results of possible transactions. Entry points are formed at the very beginning of the candle, in the direction of the MA line, duration trades in bars can be adjusted manually and adjusted to any financi
Line Breakouts - System for trend trading. Contains a trend identifier that can be adapted to any chart and trading instrument using the period and smoothing function. And a determinant of support and resistance levels. When the price is below the resistance line, open Sell trades, and when the price is above support lines - open Buy transactions. Stop loss should be placed a few points from the lines, Take Profit should be fixed after several candles (3-10-15), based on the time frame. The i
Level Breakout Indicator is a technical analysis product that works from upper and lower boundaries, which can determine the direction of the trend. Works on candle 0 without redrawing or delays. In its work, it uses a system of different indicators, the parameters of which have already been configured and combined into a single parameter - “ Scale ”, which performs gradation of periods. The indicator is easy to use, does not require any calculations, using a single parameter you need to selec
Scalping Arrows with Exit Generation is an independent trading system for scalping. Works in trend mode, configured for each time interval (TF). Entry arrows are calculated using mathematical algorithms and displayed when the candle opens. It is possible to change the settings for generating signal arrows. The indicator provides a three-level progression of exiting trades. Points with exit options do not depend on the market situation; they are built according to the Fibonacci model, whic
Volatility Trend System - a trading system that gives signals for entries. The volatility system gives linear and point signals in the direction of the trend, as well as signals to exit it, without redrawing and delays. The trend indicator monitors the direction of the medium-term trend, shows the direction and its change. The signal indicator is based on changes in volatility and shows market entries. The indicator is equipped with several types of alerts. Can be applied to various trading in
Scalping Entry Points - is a manual trading system that can adjust to price movements and give signals to open trades without redrawing. The indicator determines the direction of the trend by the central level of support and resistance. The dot indicator provides signals for entries and exits.  Suitable for manual intraday trading, scalping and binary options. Works on all time frames and trading instruments. The indicator gives several types of alerts. How to use the product The blue line
フィルタ:
レビューなし
レビューに返信